Confluence Trading- Crypto Academy / S5W6- Homework Post for @reminiscence01.
1. Explain Confluence trading. Explain how a trade setup can be enhanced using confluence trading.
Confluence trading:
Confluence trading can be understood through the word “confluence” itself as the confluence means the junction of two or more things meanwhile in trading the confluence simply means the agreement of price of an asset with chart patterns or tools such as technical indicators. So in simple terms, the confluence can be understood by the point at which the price chart and technical indicator result are the same or in agreement confirming the market trend so that is called the confluence of the chart.
So coming to the strategy of confluence trading, it involves the use of one or more technical indicators on the price chart to get the more authentic and accurate condition of the market or possible most accurate prediction about the upcoming trend to make the right decision of entering or exiting the market.
Now coming to how trade setup can be enhanced using this trading strategy, so as we discussed above the confluence trading help traders to predict and read the price movement better and the predictions or understanding of the market is more accurate in comparison to the trade setup based on the chart pattern or single indicators only. So trading with confluence trading helps traders not to fall into traps of false signals and they can make more accurate trade setups that yield the maximum possible profits.
2. Explain the importance of confluence trading in the crypto market?
Importance of Confluence Trading:
As the professor already mentioned the importance of this trading strategy however let us have a look at it in depth.
Better risk-reward ratio:
With the help of confluence trading, traders can look at the market more clearly and accurately and can estimate the suitable most stop loss and take profit value. So in short this confluence trading helps to make a good risk management strategy in their trades.
Finding divergence:
In the search of looking for confluence, traders can detect divergence between price and indicator movement that is an indication of trend reversal so the confluence trending not only confirms the market condition but also help traders to detect the upcoming trend reversal so the traders don’t end up falling in the false signal trap.
Trading with more confidence:
This along with the importance of confluence trading is also a heavy advantage of confluence trading as it helps traders to carry out trade with more confidence in him and Mark Twain once said confidence assures success so in short with a high confidence level in oneself one can trade more efficiently and the confluence trading by ensuring confluence of indicators and price boosts the confidence of trader.
High winning chances:
Confluence trading can be concluded among the most accurate trading strategies and using them simply increases the chances of getting expected profitable trade. With the help of this trading strategy, traders can detect perfect entry and exit points or can be alarmed of upcoming trend reversal hence that increases the chances of winning trades more.
3. Explain 2-level and 3-level confirmation confluence trading using any crypto chart.
Although the name itself is pretty self-explanatory i.e. 2 levels and 3 level confluence trading though we’ll dig deeper into these in this question. So as the name implies the 2-level confluence trading simply means using two indicators to carry out confluence trading meanwhile the 3-level indicator means using 3 indicators in a trade so let us dive into them more in separate headings.
2-Level confluence trading:
As said above the confluence trading means the use of two indicators however but 2 level confluence doesn’t limits to an indicator only it could be a chart pattern too i.e. confluence between any two things with price chart it can be two indicators or two chart patterns or an indicator with chart pattern to confirm a market condition.
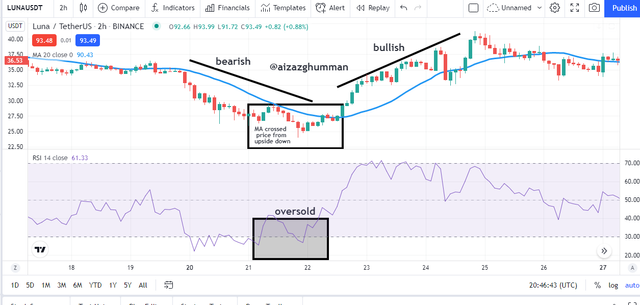
Now let’s have a look below on the chart we can see I have applied two technical indicators that are RSI and MA indicators so we can see on the chart the price enters in the oversold region that indicating an upcoming bullish market meanwhile the MA further confirms the bullish market by crossing the price from upside-down hence that shows the 2 level confluence between two indicators hence confirm the bullish trend.
3-Level confluence trading:
The 3-level confluence trading is no different than 2-level confluence trading in strategy however it is different in its apparent structure so as said above the 3-level confluence trading means the use of three indicators however but 3-level confluence also doesn’t limits to an indicator only it could be a chart pattern too i.e. confluence between any three things with price chart it can be three indicators only or three chart patterns or two indicators with chart pattern or vice versa to confirm a market condition.
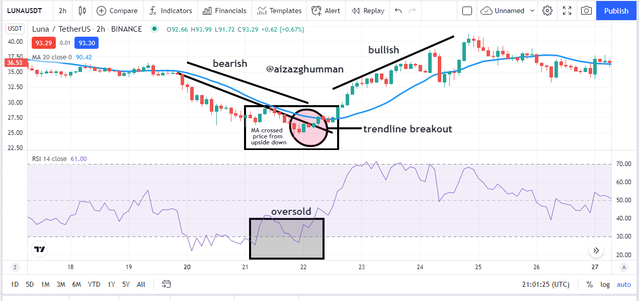
Now let’s have a look below for a practical demonstration of 3-level confluence trading on the chart we can see I have applied three technical indicators that are RSI and MA indicators so we can see on the chart the price enters in an oversold region that indicates an upcoming bullish market meanwhile the MA further confirms the bullish market by crossing the price from downside up hence that shows the 2 level confluence between two indicators hence confirm bullish trend now to make it 3-level confluence trading we can have a look at chart pattern that will be my third tool to make it 3-level confluence trading so for this I’ll be using trend line pattern so I drew a trend line considering the resistance levels in bearish trend so we can see here the price broke the trend line at a point that showed oversold region in RSI and the point at which MA crossed price from downside up confirming the trend reversal i.e. bullish market.
4. Analyze and Open a demo trade on two crypto asset pairs using confluence trading. The following are expected in this question.
• a) Identify the trend.
• b) Explain the strategies/trading tools for your confluence.
• c) What are the different signals observed on the chart?
For carrying out this I’ll be doing a buy trade for one pair of assets and selling trade for another so for sell order here’s my analysis:
SELL ORDER:
So considering the expectation first I will identify the market trend for this trade as we can see in the chart below that the market had been moving in a bullish trend and the structure of the market was bullish i.e. a new high was higher than the previous high and a new low was higher than previous low that suits the bullish market structure.
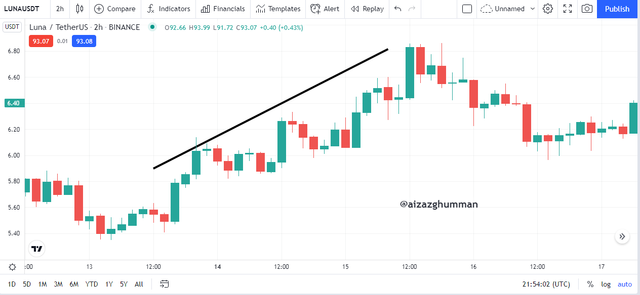
Now the strategy for my confluence trading or more like 3-level confluence trading will be first to use the trend line chart pattern so I drew the trendline of this bullish market joining all the support levels of the bullish market now I will add two indicators that are oscillator indicator i.e. stochastic indicator with Moving average indicator.
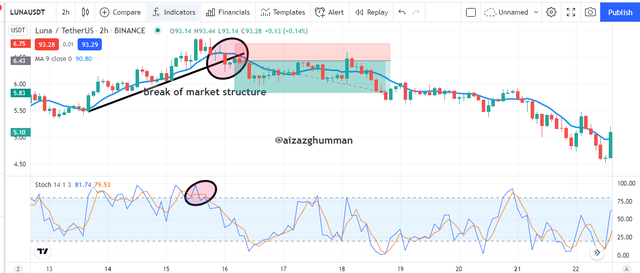
Now the last expectation for this task i.e. what are the different signals observed so as we can see in the chart below that stochastic shows an overbought region of asset indicating bearish market meanwhile moving average also crossed the price from upside-down indicating bearish market and the price also broke the market structure by showing trend reversal so I place my sell order and place my stop loss slightly above the last high and take profit slightly below the last low as we can see in the chart below.
BUY ORDER:
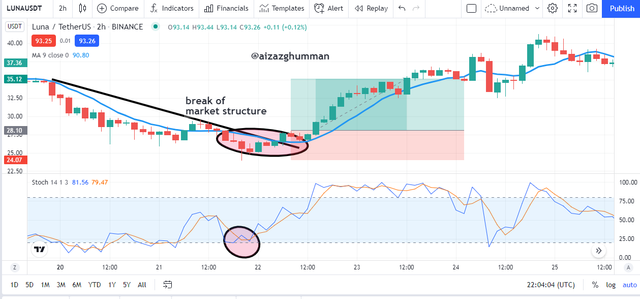
Now to carry out the trade on the second pair of assets I will identify the market trend for this trade as we can see in the chart below of trading pair * that the market had been directing in bearish trend and structure of the market was bearish i.e. a new high was lower than previous low and a new low was lower than previous low that suits the bearish market structure.
Now the strategy for my confluence trading or more like 3-level confluence trading will be first to use the trend line chart pattern so I drew the trendline of this bullish market joining all the support levels of the bullish market now I will add two indicators that are oscillator indicator i.e. stochastic indicator with Moving average indicator.
Now the last expectation for this task i.e. what are the different signals observed so as we can see in the chart below that stochastic shows oversold region of asset indicating bullish market meanwhile moving average also crossed the price from downside indicating bullish market and the price also broke the market structure by showing trend reversal so I placed my buy order and placed my stop loss slightly below the last low and take profit slightly above the last high as we can see in the chart below:
Conclusion
It is not reliable to trade via using a chart pattern or a single indicator as crypto markets are highly volatile and there are always market manipulators trying to hunt newbie traders by providing false signals so it is compulsory to know strategies that can help you with better analysis one such of strategy is to try confluence trading as it can confirm the apparent signals of the market.
The confluence trading itself is further of two types i.e. two-level or by using two methods to confirm market signal or 3 level confluence trading or simple using three tools to confirm the market trend.
Thanks to the professor for allowing us to write on this strategy and much appreciation for him for his efforts in the lecture.
Hello @aizazghumman , I’m glad you participated in the 6th week Season 5 of the Beginner’s class at the Steemit Crypto Academy. Your grades in this task are as follows:
Observations:
This is wrong. You are required to execute a trade and show prove of transaction.
Recommendation / Feedback:
Thank you for participating in this homework task.