[Intermediate Course] Steemit Crypto Academy Season 5 Week 4 | Trading With Puria Method Indicative Strategy | How To Make Our Own Strategy
Let's start it..
Trading With Puria Method Indicative Strategy | How to Make Our Own Strategy
1. Explain Puria method indicative strategy, what are its main settings. Which timeframe is best to setup this trade and why? (Screenshot needed and try to explain in detail)
Puria method indicative strategy:
We have read different chart patterns or technical indicator that helps trader to identify price movement and predict its direction to earn maximum profits through trading now the Puria method indicative strategy is a technique used by traders preferably for intraday trading. It is (as taught by the professor) is follow the trend strategy and is among the easiest strategies hence can be used by new traders too.
As the name implies this strategy involves the use of three indicators hence termed as an indicative strategy. The first two indicators used are moving average indicators meanwhile the third indicator is used in MaCD. With the help of these indicators, the traders can detect right to time to enter or exit the market or to identify the points where market.
Parameters:
Now to execute the strategy these indicators have specific parameters that are needed to be well settled for correct output and are the basis of the strategy so as we discussed this strategy utilizes three indicators so let’s dig on to what are parameters for these indicators.
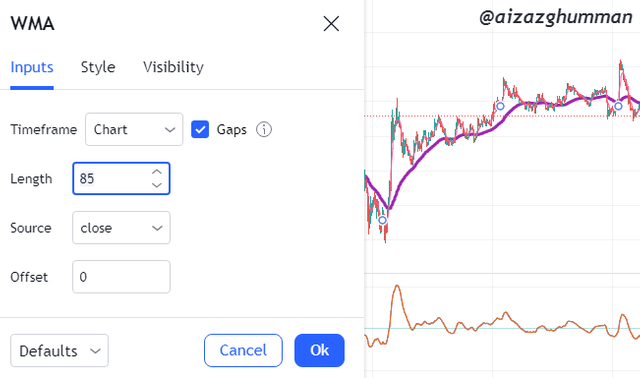
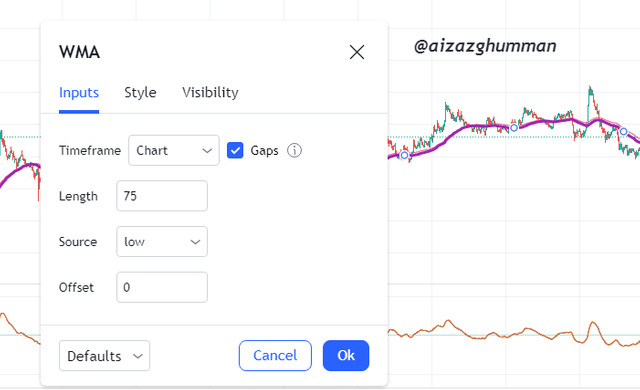
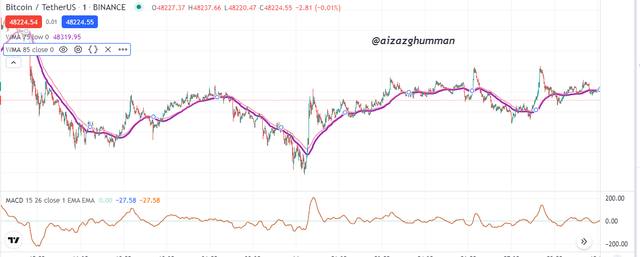
Starting from the moving average indicator so the MA indicators used are weighted moving average indicators applied twice on the chart so the parameters for the first WMA or weighted moving average is the ideal setting are to set the source at close and length at 85 meanwhile for second weighted moving average indicator the ideal settings are to set source at low and length of 75 that can see be seen in the screenshot down below.
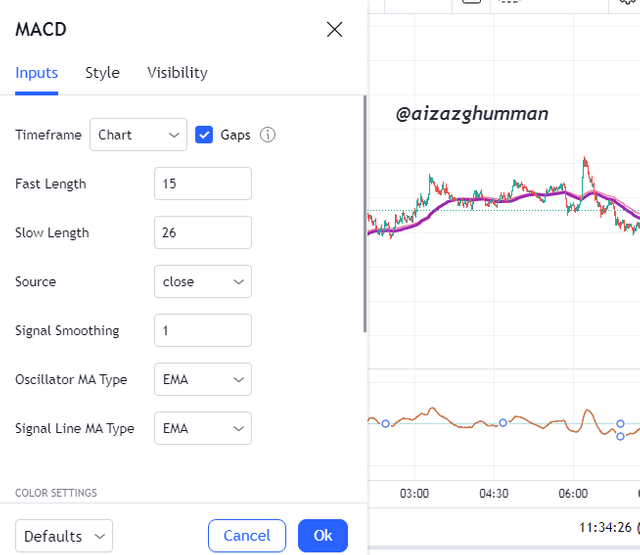
Now the third and last indicator of this strategy is MaCD that gives the entry or exit signal on the chart has certain parameters too such as fast length at 15 and slow length is of 26 and the additional setting signal smoothing at 1.
Now the last thing asked is the best time frame for this strategy so speaking based on my research it’s preferable to use the same time frame as of chart selected for carrying out intraday training however some time frames can manipulate you so it is better to study the history of price movement with this strategy on different time frames to get the best time frame. Here’s how this strategy looks when applied:
Now for buy and sell entry here are a few things we should consider in this strategy.
BUY ENTRY:
For buying, we must detect both the weighted moving average lines moving below the market price of the asset while the MaCD indicator once starts moving upward after reaching zero level then that is the correct to enter the market and place your buy orders as the market is likely to stay bullish.
SELL ENTRY:
Now for Selling the weighted moving average line must be moving above the market price of an asset and the MaCD indicator must be bending down and moving toward zero or simply when MaCD is bearish then it is said to be the right time to place your sell orders to earn maximum profits.
2. How to identify trends in the market using the Puria method. Is it possible to identify trend reversal in the market by using this strategy? Give examples to support your article and explain them. (Screenshot needed)
Talking about trends there are two types of a market trend that is bullish and bearish and if we talk about trend reversals that too again are of two types i.e. bearish or bullish reversal not to identify them using this indicative strategy here’s how you can do that.
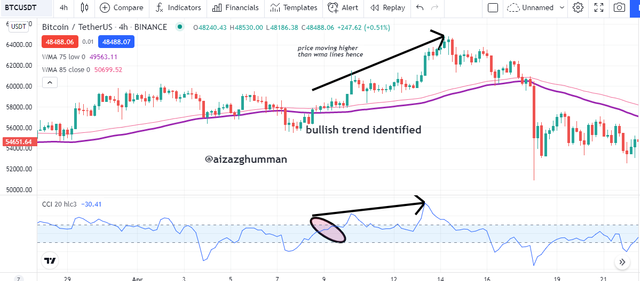
Identifying Bullish Trend:
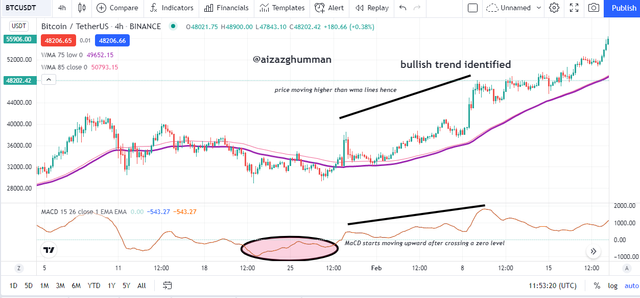
A bullish trend is when price moves in an upward direction or simply increases and using the Puria method indicative strategy the bullish trend can be identified when the price moves higher than the weighted moving averages line and MaCD starts moving upward after crossing a zero level or in short when the value of MaCD is given positive on the chart.
The chart below shows the identification of bullish trends through the Puria method strategy.
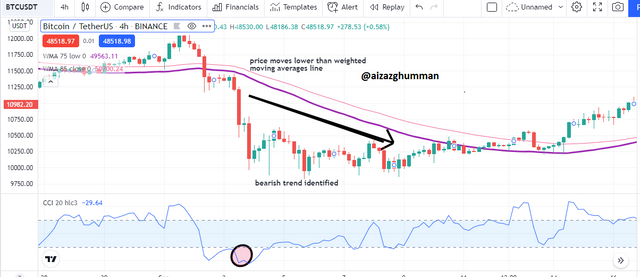
Identifying Bearish Trend:
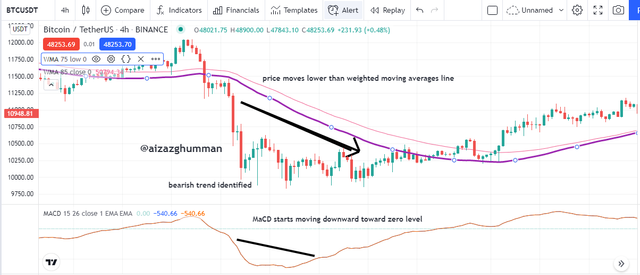
A bearish trend is when price moves in an downward direction or simply decreases and using puria method indicative strategy the bearish trend can be identified when the price moves lower than weighted moving averages line and MaCD starts moving downward toward zero level or in short when the value of MaCD is given negative on the chart.
The chart below shows the identification of the bearish trend through the puria method strategy.
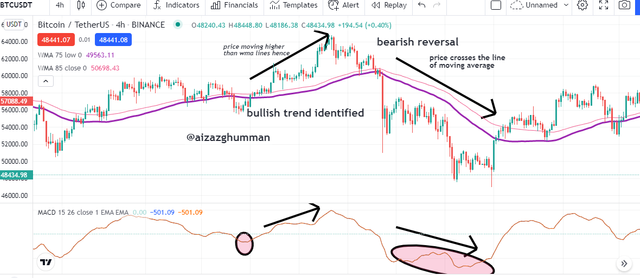
Identifying Bullish Trend Reversal:
Now for bullish trend reversal, we must remind ourselves of the bearish trend we identified above now keeping that in mind when the price crosses the line of moving average and the MaCD start moving in a bullish direction after being bearish so the trend is identified to reverse to bullish.
The chart below shows the identification of bullish trend reversal through the puria method strategy.
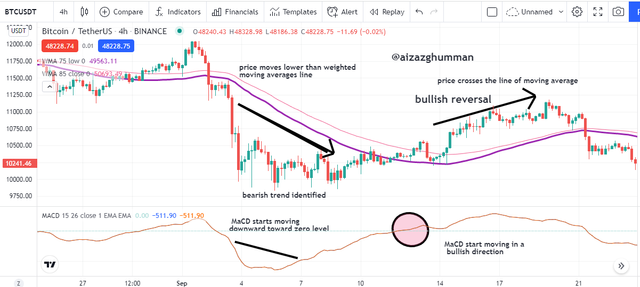
Identifying Bullish Trend Reversal:
Now for bearish trend reversal let us now remind ourselves of the bullish trend we identified above now keeping that in mind when the price crosses the line of moving average and the MaCD start moving in a bearish direction after being bullish so the trend is identified to reverse to bearish
The chart below shows the identification of bearish trend reversal through the puria method strategy.
3. In the puria strategy, we are using MACD as a signal filter, By confirming signals from it we enter the market. Can we use a signal filter other than MACD in the market for this strategy? Choose one filter (any Indicator having 0 levels) and identify the trades in the market. (Screenshot needed).
For this part of the task, I’ll be choosing the commodity channel index or CCI indicator that is an oscillator developed by Donald Lambert that can be applied on all the available time frames but is preferable for long-term trading. Like MaCD this indicator also helps in detecting the right entry or exit points of markets and works almost in the same way as that of MaCD.
The screenshot below shows the chart of trading pair BTCUDT being applied with puria method strategy as you can see the price was moving higher than WMA’s lines meanwhile the indicator also after crossing zero level moved in a bullish direction that helps to identify a bullish trend.
Now for the bearish trend, we can see in the chart below of trading pair BTCUSDT being set up with puria method indicative strategy the price moved in below the moving average lines and the CCL indicator is crossing 0 levels toward -100 line indicating bearish market or selling signals.
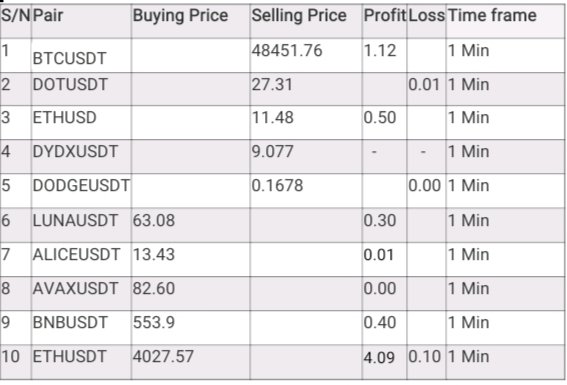
4. Set up 10 demo Trades (5 buying and 5 selling) on 5 cryptocurrency pairs using puria method indicative strategy. Explain any 2 of them in detail. Prepare a final observation table having all your P/L records in these 5 trades.
Components of the table:
S.no. Pair Buying Price selling Price profit loss time frame
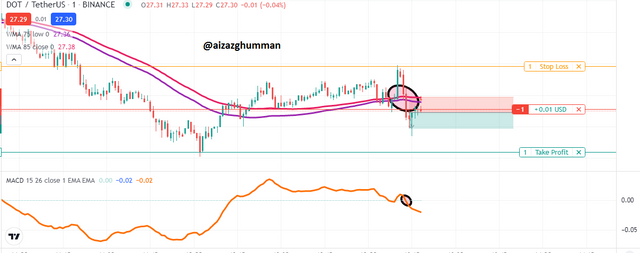
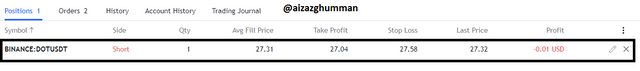
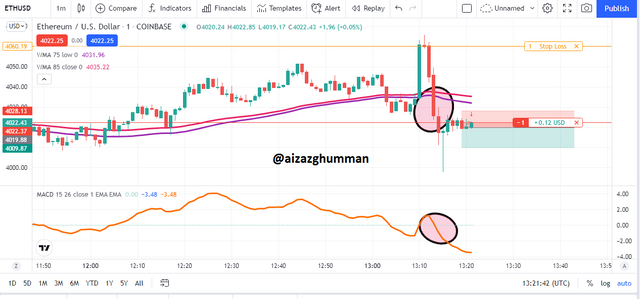
SELLING DEMO TRADES:
Explanation:
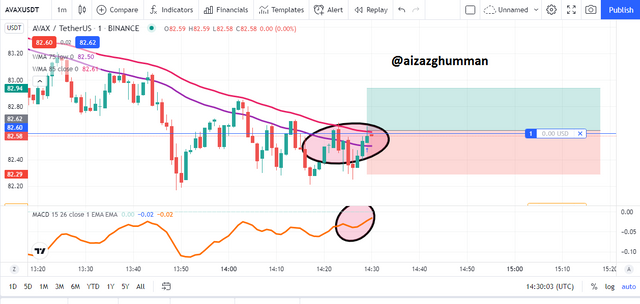
As we can see the price had been bullish and the WMA’s lines were below it and the MaCD was moving in an upward direction however then the price crossed the WMA’s line from upside down and the MaCD also started moving toward zero level indicating a downtrend so that’s when the seller should enter the market so as we can see in the chart of DOTUSDT below the profit and loss are settled in 1:1 ration.
BTCUSDT
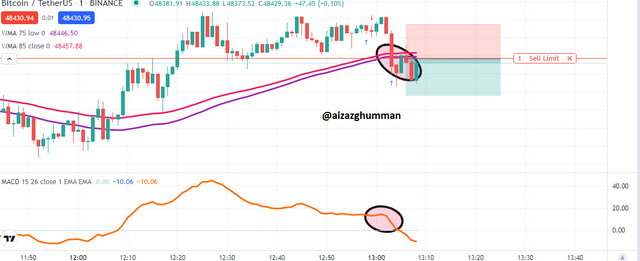
Here are what results were obtained from trade it showed profit:

2. DOT/USDT
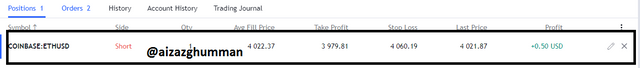
3. ETHUSD
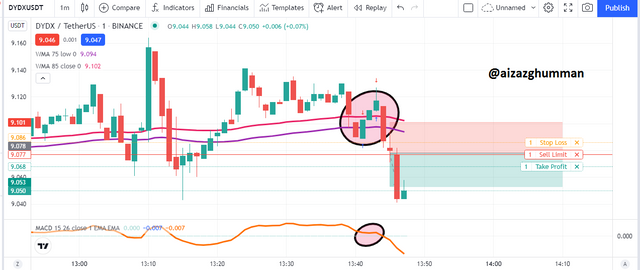
4. DYDXUSDT
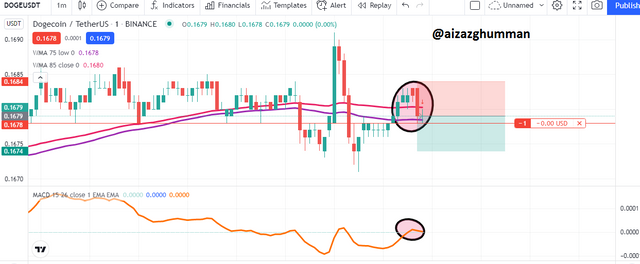
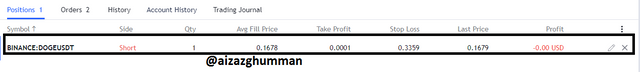
5. Dodge USDT
BUYING DEMO TRADES:
Explanation:
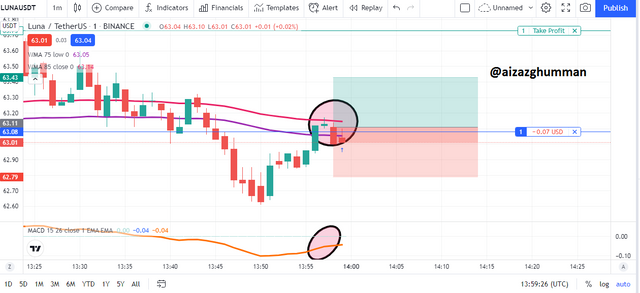
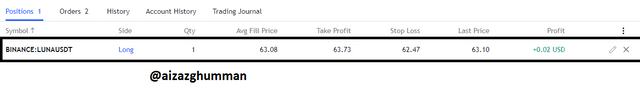
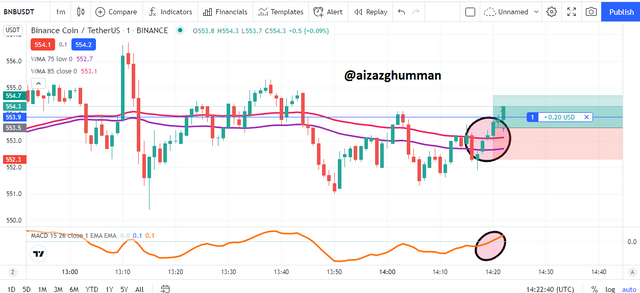
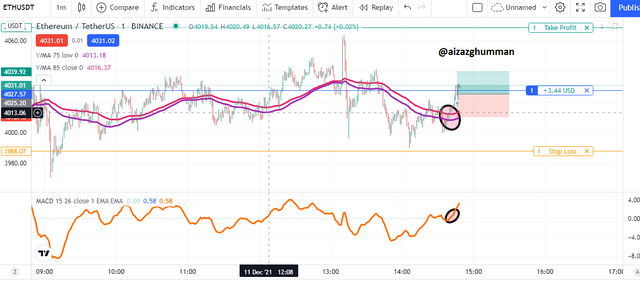
As can see in the LUNAUSDT chart the price crossed the WMA’s line from downside up and the MaCD also started moving from zero level to upward indicating an uptrend so that’s when the buyer should enter the market so as we can see in the chart below the profit and loss are settled in 1:1 ratio.
1. LUNAUSDT
Here we can see the result of trade:
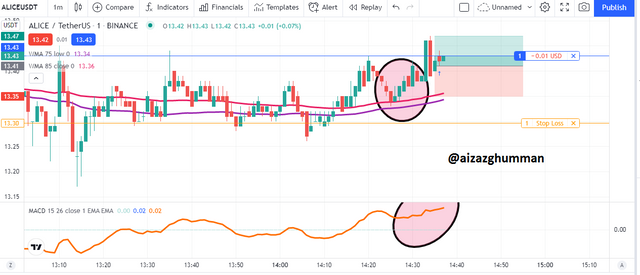
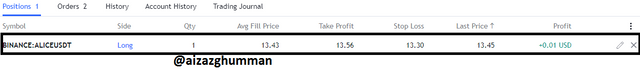
2. ALICEUSDT
3. AVAXUDT

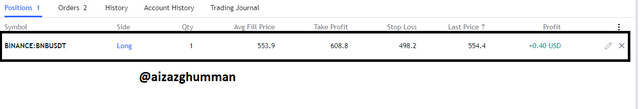
4. BNBUSDT
5. ETHUSDT

Trade Table
5. You have to make a strategy of your own, it could be pattern-based or indicator-based. Please note that the strategy you make must use the above information. Explain full strategy including a time frame, settings, entry-exit levels, risk management, and place two demo trades, one for buying and the other for selling.
So with some research, I was able to make an indicator-based indicator that may help the trader to execute a trade with a high win rate. So based on the strategy I’ve made I’ll be naming this strategy as Confluence of Indicators or simply Confluence strategy.
Market Ideology
There isn’t much to look into a market ideology for this strategy as this can work in any market considering the confluence strategy that we will be discussing below however it is preferable not to go with trading strategy in ranging market as there can be false signals.
Suitable Market
This strategy is a universal market strategy that is it goes with any market whether its stock, forex, or crypto market.
Time-Frames
Since I don’t have experience of this strategy with swing trading so I’d suggest this strategy to be better for scalp traders for intraday trading and the preferable time frame is not fixed one can study this strategy on the different time frame and can for the time frame that fits the strategy best I prefer anytime frame from 45 Min to 4h.
Entry and Exit Points
The entry and exit points we’ll be discussing in the demo trades however one thing needed to mention now is that the entry and exit are made when all the required conditions of strategy are matched.
Risk Management
For this strategy, the stop loss and take profit should be 1:2 i.e. the take profit should be 2 times higher than stop loss, and the same ratio of stop loss and take profit goes for sell entry.
Indicator to False Signal
Since down below we will learn the indicator comprises of three indicators so the indicator these indicators themselves can do the job of identifying false signals such as RSI that can help traders to be aware of weak signals.
The Confluence Strategy
For this strategy, we will be using three stochastic indicators, RSI and macd indicator. The stochastic indicator comprises of two lines and helps the trader to identify the oversold and overbought region and in this strategy, the key role of the stochastic indicator will be to indicate the perfect entry and exit signals in the chart.
Now the second indicator RSI in this strategy will not be used for the purpose it is famous for that is to indicate the overbought or oversold points but the RSI in this strategy will do the job of confirming the trend here we will change the parameters of RSI from 70/30 to 50 only so if the line is above then it is said to be uptrend meanwhile if it’s below 50 then it’s bearish market and time for sellers to enter the market.
Now the third indicator MaCD is a famous momentum indicator and used by traders in a way that if indicator lines cross below 50 then it is time for buyers to enter and if it crosses above the 50 positions a downtrend is coming so time for sellers to enter the market but this indicator works on trending market only not ranging so for this strategy we won’t be making entry using this indicator but will use it to further confirm the trend.
Demo trades:
For Buying:
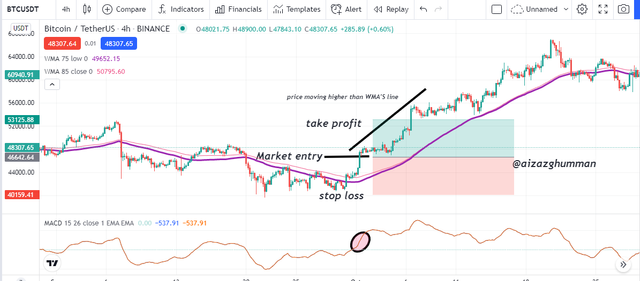
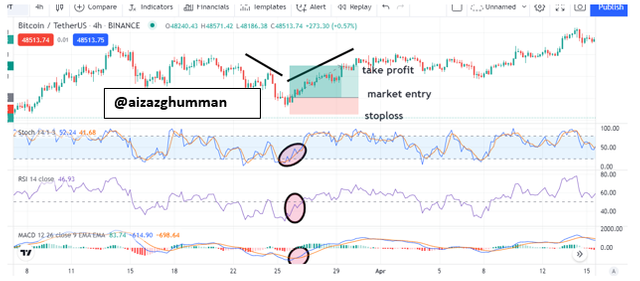
Now for buying first we will first see the stochastic indicator to enter the market we must see both lines of stochastic to be in oversold region and then start moving in a bullish direction now for RSI we must make sure that it starts to move in the direction above the RSI 50 line now the MaCD indicator lines must cross below the 50 and be directing towards upward. This is when buyers should enter the market however one must be careful that the stochastic line or any other indicator must not hit the overbought region.
The chart below shows the buy setup using this strategy note that the stoploss and take profit values are marked keeping 1:2 ration i.e. the profit is two times bigger than loss.
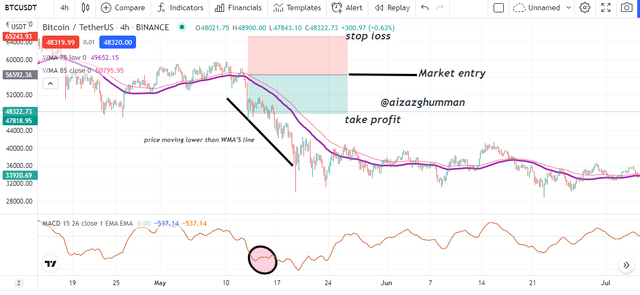
For Selling:
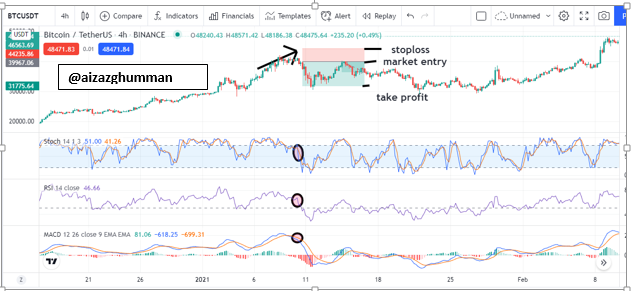
For selling first we will first see the stochastic indicator to enter the market we must see both lines of stochastic to be in the overbought region and slightly starts moving bearish now for RSI we must make sure it starts to move in the direction below the RSI 50 line now the MaCD indicator lines must cross above the 50 and be directed towards below. This is when sellers should enter the market however one must be careful that the stochastic line or any other indicator must not hit the oversold region completely. The trade is carried out when all three indicators are at confluence hence named confluence strategy or confluence of indicators.
The chart below shows the sell setup using this strategy note that the stoploss and take profit values are marked keeping 1:2 ration i.e. the profit is two times bigger than loss.
Conclusion:
The Puria method indicative strategy was new to me and I must it’s among the easiest strategy I’ve studied and can be easily understood by newbie traders. The assignment was fun to do thanks to the professor’s lecture that helped a lot. Hope I met his expectations for this task.
Thank you.