Perfect Entry Strategy using Stochastic Oscillator + 200 Simple Moving Average - Crypto Academy/S5W3 - Homework post for @lenonmc21
This is @aizazghumman; here I am going to share my homework post on the topic "Using indicators " given by respected professor @lenonmc21

State in your own words what you understand about the Perfect Entry Strategy (Place at least 2 examples on crypto assets)?
Before we get into detail about what perfect entry strategy I’d first like to throw light on what perfect entry is.
Perfect Entry
As the name implies the perfect is the perfect time to enter and in crypto the perfect time to enter the market to trade assets i.e. buy or sell.
Perfect Entry Strategy
We have read multiple crypto chart patterns or indicators to predict the future or current market movement or trend reversal to enter the market at right time to generate maximum profits however here in this assignment we’ll be discussing the strategy to make perfect entry we learned through the professor’s lecture. So from the lecture, we learned the perfect entry strategy can be implied in three steps mainly discussed below
Unfold the current trend using Moving Average 200 technical indicator
Finding Trigger Candle
* Stochastic Oscillator Indicator
Let’s have a look at these steps in detail
Unfold the current trend using Moving Average 200 technical indicator
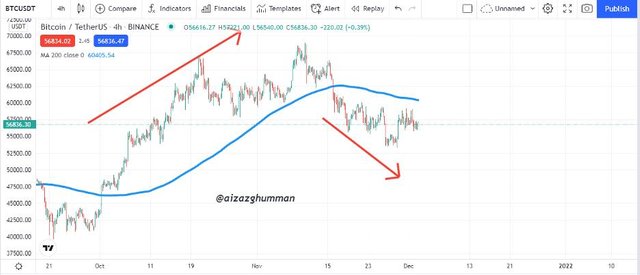
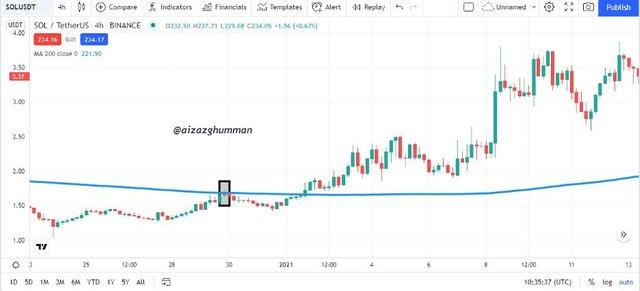
Though the heading explains it here in this step we determine the current movement of the market for which we along with price movement also add moving average 200 the “200” here is the mean line of indicator that represents the closing price for the last 200 days. So when the price is moving higher than this mean line the trend is said to be bullish and if it’s below the mean line the asset trend is said to be bearish hence we can unfold the trend using a moving average of 200 in correspondence with the price of action.
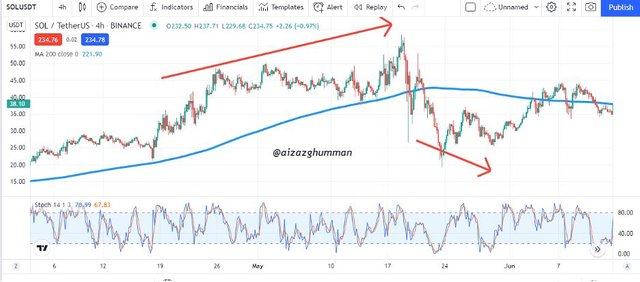
For better understanding let’s have a look below on chart of btcusdt and solusdt where I have applied moving average 200 it can be seen market was in an uptrend when the price was above the mean line of indicator meanwhile it was downtrend when the price was lower to mean line
Finding Trigger Candle
Now to have perfect trading entry the next step is to find the trigger candle. Now, what’s that? For that, we’d keep the first step to this in the back of our mind, and now keeping that we’d search for the point where the price action is at the mean line of MA 200. So when the price reaches the mean 200 lines it forms a small-sized candle called “Trigger candle”. It is formed when both the buyers and sellers are fighting for dominance i.e. buyers failing to take price above the price whereas the sellers fail to pull price below the MA 200 mean line. The price trend from here can be continued similar to previous or there can be a trend reversal.
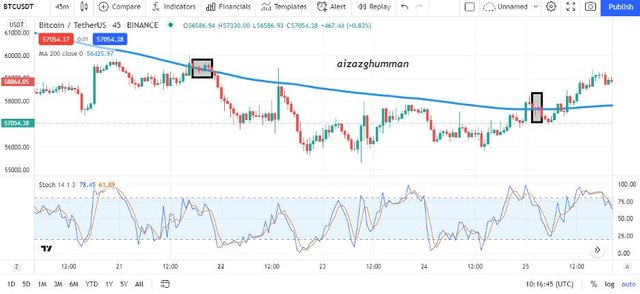
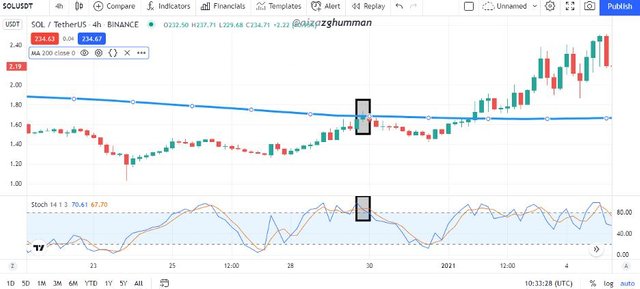
Now for a graphical understanding look at the chart below of BTCUSDT and SOLUSDT trading pair where we can find the formation of trigger candle having wick above and below the body of building that symbolizes trigger
Stochastic Oscillator Indicator
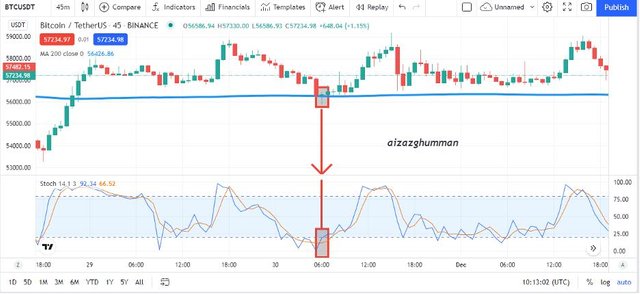
Now moving to the final stage of performing the perfect entry strategy we will be using a technical indicator that goes by the name of “Stochastic Oscillator indicator. This step plays a key role in perfect entry strategy as it asks for the remaining two steps of this strategy i.e. the indicator must match the price action and trigger candle for example if the price is above the mean 200 MA line then the indicator must be showing assets being accumulated i.e. oversold whereas if the price is below mean 200 lines then that means assets in oversold region or distribution phase.
Here the chart below shows the application of Stochastic indicator and 200-period moving average indicator on trading pair BTCUSDT and Solusdt that can show the confluence between indicators and price trend.

Explain in your own words what candlestick pattern we should expect to execute a market entry using the Perfect Entry Strategy
As discussed in question no: 1 of this homework post the purpose to make a perfect entry strategy is to facilitate traders with information of what is the correct time to place their buy and sell entries in the market. For that, the candlestick pattern which we can be expected can be the candlestick pattern we learned in the lecture called “Formation of Trigger Candle”.
Firstly coming to Trigger candle with the tiny body having wicks or shadows both on its top and bottom formed when buyers and sellers fail to push the price up or pull it down and the candle is formed at the position where the mean 200 period moving average lines passes at representing price isn’t moving higher or lower to that point Also the trigger or small candle shows the previous trend being weakened and not having the potential to continue.
Here’s the graphic representation of the formation of a small candle pattern in compliance with all three steps of the perfect entry strategy.

Explain the trading entry and exit criteria for buy and sell positions in any cryptocurrency of your choice (Share your screenshots)
Practice (Remember to use your images and put your username)
Criteria
The criteria for exit and entry for buy and sell position using perfect entry strategy is to wait for the chart where all three steps of this strategy discussed in question number one are at confluence keeping the take profit value higher where the stochastic indicator show overbought region for buying whereas for selling the take profit should be where the same indicator shows oversold region now for stop loss in buying should be slightly lower to trigger candle whereas in selling the stop loss should be slightly above than trigger candle.
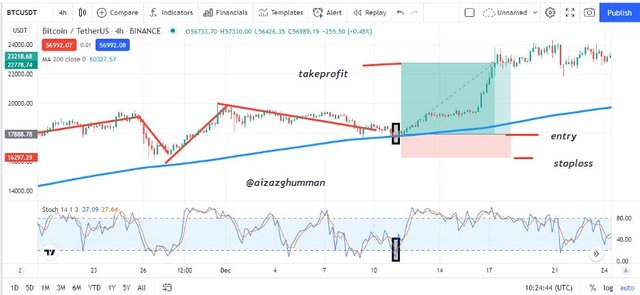
For Bullish market
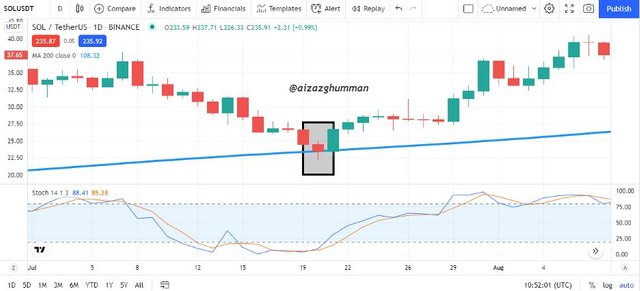
In a bullish market, the traders place their buy entries so here in the screenshot down below of btcusdt we can see all the three steps required to execute a perfect trading strategy are at confluence therefore I decided to place my buy entry on the formation of trigger candle and placed my stop loss lower to the trigger candle whereas setting my take profit at the place where stochastic indicator showed overbought region.
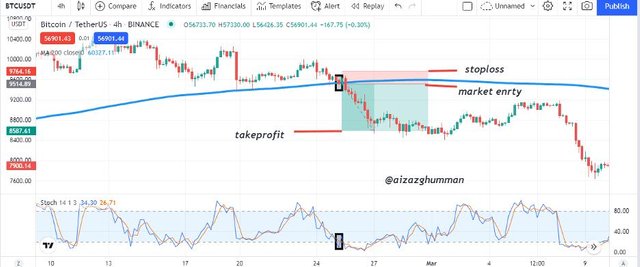
For Bearish Market
In a bearish market, the traders place their sell entries so here in the screenshot down below of btcusdt we can see all the three steps required to execute a perfect trading strategy are at confluence therefore I decided to place my buy entry on the formation of trigger candle and placed my stop loss higher to the trigger candle whereas setting my take profit at the place where stochastic indicator showed oversold region.

CONCLUSION
So far the assignment helped us to learn about the “perfect entry” strategy that is indeed real help for traders. The perfect entry strategy helps traders to enter or exit the market at the correct time and can be executed in three steps i.e. to determine the trend, candlestick confluence with 200 MA, and lastly the stochastic oscillator indicator. I’d thank the professor for making the assignment easy with a simple lecture I tried to do my best hope that meets your expectation.
Thank you.
hello professor @lenonmc21 kindly check it my home work again i put wrong tag by mistakenly thats why you did not find my homework post kindly check ot again iam very thankfull if you are check it again