Steemit Crypto Academy Season 5 Week 2 [Beginner's Course] - Recognizing Simple Patterns in Trading
This is @aizazghumman; here I am going to share my homework post on the topic "Recognized Simple patterns in Trading" given by respected professor @Sachin08

What is your understanding about Triangles in Trading? Explain all forms of triangles in your own words. (Screenshot required)
Triangles in Trading
The triangles are formed horizontally in alignment with a chart and are its formation is initiated through the broad most of triangle and with the market being in proves the range keeps getting the thin forming tip of the triangle. To understand these patterns one must know the basics of how these patterns work and what they indicate. Apparently, there are three types of triangles so let dive more into them
Ascending triangle
Descending triangle
Symmetrical Triangle
Ascending Triangle
The ascending triangle is the type of chart pattern which are bullish so they predict an uptrend of the price of an asset. We have studied roles of support and resistance level before in different homework posts however the ascending triangle comprises of two trend lines i.e. support line which is in the shape of the inclined plane moving lower to high and a resistance line that is completely straight as can be seen in the chart below
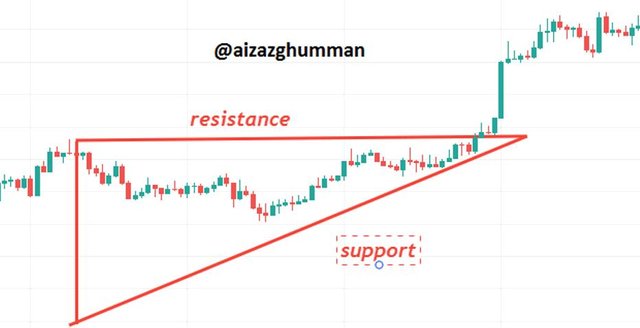
The completion of the formation of this ascending triangle is the time to place a buy order as the price is most likely to shoot up
Descending Triangle
As the name implies it is contrary to ascending triangle and since it’s exactly opposite to that of ascending triangle so it is formed in a bearish trend and predicts the downward movement of assets in the coming time.
Though indicates opposite movements the anatomy of this ascending and descending triangle is somewhat similar it also comprises two trend lines where support is a straight line where as the resistance line is inclined downward i.e. from higher to low. The chart below can give a graphical representation of a descending triangle.
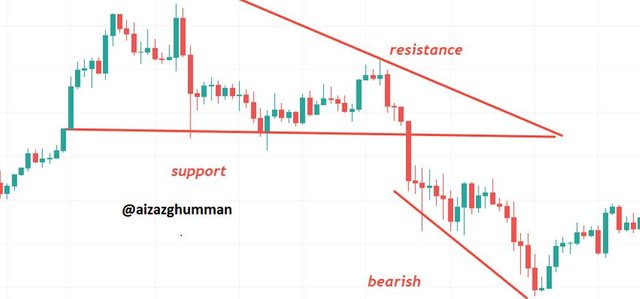
Once the chart pattern is completed it's a good time for traders to place their buy-sell entries as the price will be going bearish or they can buy these assets at a low rate to sell them in an uptrend.
Symmetrical triangle
The symmetrical triangle is another type of triangle used in technical analysis by traders and is among the most used chart patterns. This again comprises of two lines that are support and resistance however the support line is similar to support level in ascending triangle i.e. it moves from lower to high whereas the resistance line is similar to that of resistance line in descending triangle i.e. from higher to low direction. Let us have a look at the chart below to understand this chart pattern.
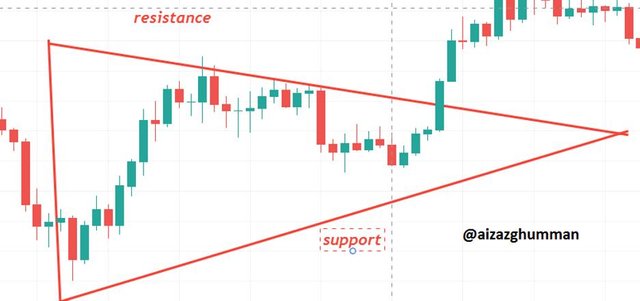
Once the triangle is formed traders can know either the trend will continue or reverse if the trend follows the earlier pattern the traders can understand if the price is going to increase in the respective direction and if the price after the breakthrough of pattern moves in the opposite direction it is said to be trend reversal indication.

Can we also use some Indicators along with it Triangle Patterns? Explain with Screenshots.
Anyone who trades using technical indicators along with different chart patterns for carrying out their technical analysis as these indicators can be used to confirm the chart patterns however crypto markets are highly volatile so there’s never 100% confirmation of trends but something is better than nothing so using these indicators can help traders to be a bit more sure of their predictions they got from technical analysis.
There are different types of indicators we have such as volume indicators, oscillators, momentum volatility indicators, and others. So the answer to the first part of this question is “YES” we can use indicators with triangle patterns to be surer before making a trade. Now coming to the explanation of how we do it.
For this, I’ll be using a momentum indicator that evaluates the highest and the lowest price of assets in the market giving major support and resistance level to traders and that is what is needed to shape a triangle.
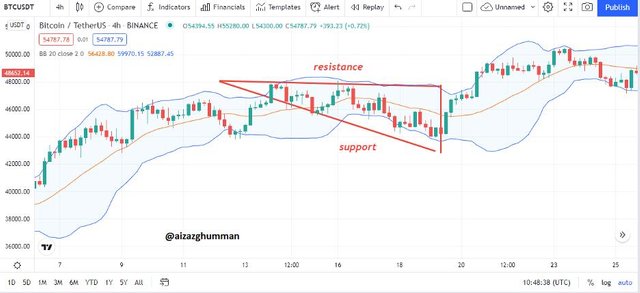
Let’s have look at the chart below where I used the momentum indicator that goes with the name of the Bollinger band here’s how we use it to detect trend lines and triangle patterns.

Explain Flags in Trading in your own words and provide screenshots of both Bull Flag and Bear Flag.
Flags in Trading
As we studied above there are different patterns of chart used for technical analysis by a trader so the flag is again one of those chart patterns used by traders, This pattern in appearance comprises of a long chain of the bearish and bullish trend and then continues to form a simple flag-shaped pattern that can be seen in graphics below.
The flags patterns are moved after quite a lot of movement of price in the market and the formation finally represents consolidation I.e. a trend is stable and now likely to stay in the same direction and quite continue that way.
We have two types of these flags patterns that are used to do technical analysis namely known as bull and bear flags. Let’s study them in-depth.
Bull Flag
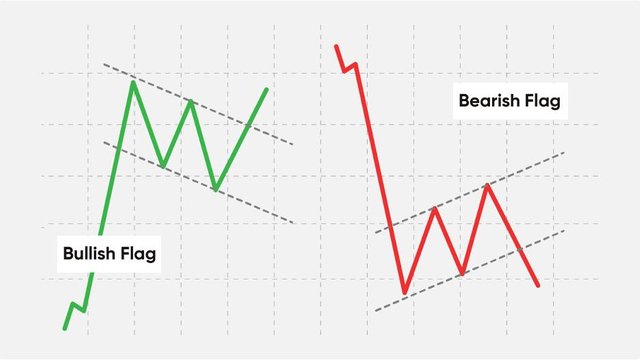
Let’s have a look at the image below to have an image of what we’ll be talking about when I say bull flag.

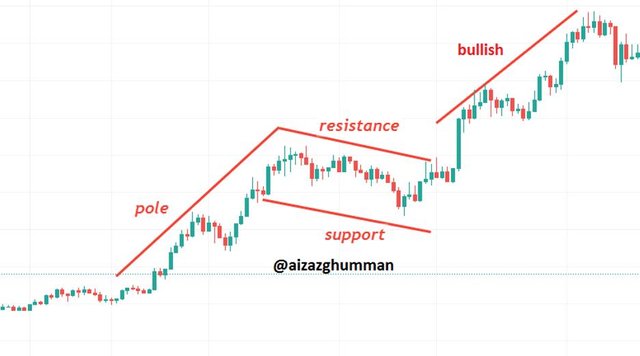
The bull flag can be seen in the chart above. It starts forming with a strong bullish trend for some time which forms the pole for the flag pattern followed by price movements which shape the rest of the flag and once the pattern forms price is like to move further up. So a bull flag is formed in a bullish market and consolidates a bullish trend. As we can see in the chart the pattern comprises three lines the pole line, support line, and resistance line.
When the flag form and the price breaks the resistance level and further goes up it is time for traders to place their buy order in the middle of a bullish trend as the price is likely to move further up.
Bear Flag
The bull flag follows the same anatomy as that of the bearish flag used for the exact opposite trend i.e. bearish. Before diving further let’s have a look at the graphics of this pattern to understand things better.
The chart above shows a bearish flag that forms after the price had been bearish for a long and the market strongly represented the bearish trend giving a trending market that forms a pole of the flag followed by some price fluctuation which turns the market from trending to ranging shaping a flag hence completing the flag pattern. The pattern again comprises three lines the first one is a straight line that represents the pole of the flag whereas the rest of the two lines are support and resistance level. Once the price falls below the support level it works as a confirmation of a bearish trend to consolidate and traders can place their sell orders as the price is like to fall.

Show a full trade setup using these Patterns on any Cryptocurrency chart. (Ascending Triangle, Symmetrical Triangle, Bear Flag)
Trade Setup for Ascending Triangle
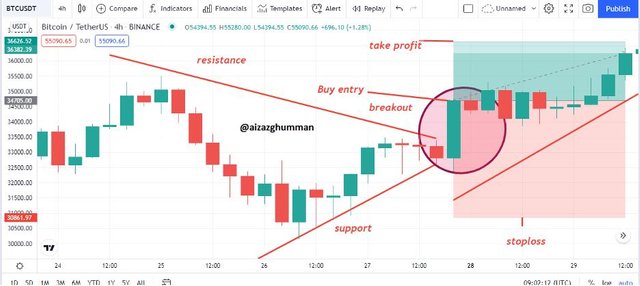
As we discussed above the ascending triangle is formed in a bullish market and indicates an uptrend. As the name implies it predicts the ascending movement of price. For traders to place their entries it is best to let the pattern complete and wait for a breakout to take place to place their buy orders that in this case will when price crosses the resistance level and moves further up. Let’s have look at the chart below where I did the trade setup for ascending triangle.
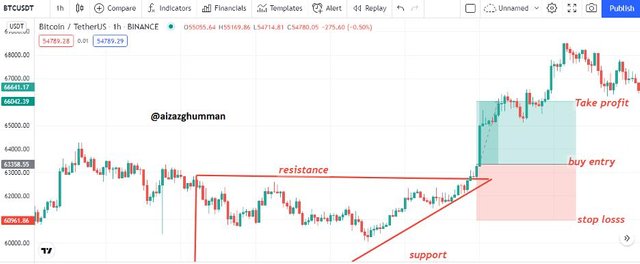
I marked my buy entry after the formation of the candle which broke out the resistance level as it further confirmed the bullish trend and set my take profit a bit above the resistance level and stop-loss close to the last low peak of the asset.
Trade Setup for Symmetrical Triangle
The symmetrical triangle comprises of descending resistance line and ascending support line and upon completion of the triangle, the break out of either of these support or resistance levels tells the upcoming direction of price. Here in the chart below, I placed trade setup using symmetrical triangle pattern as we can see in BTCUSD chart below I identified a symmetrical triangle then upon completion of the pattern I waited for another candle which breaks out the support or resistance level that was bullish candle so I place my buy entry and set take profit value above the last high peak of asset and stop loss below the last low peak of the asset.
Trade Setup for Bear Flag
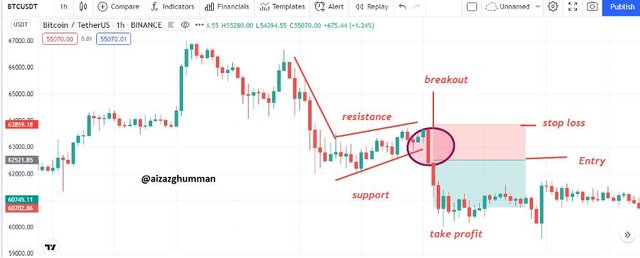
We discussed above the bearish flag indicates the consolidation of the bearish trend hence it is preferred to place sell entries upon completion of the trend. The screenshot below represents my trade setup for the bear flag here in the chart you can see I placed my sell entry once the bearish flag was formed and it passed the support level I waited for a bearish candle to form just to avoid market manipulation and placed my stop loss close to the resistance level and set my take profit lower to support can be seen in the chart below.

Conclusion
I said it before in different posts will say it again one must be aware of different chart patterns to yield maximum profit. I’d say the flag and triangle char patterns are the easiest to detect and predict market movements. So far the assignment made me dig on three types of chart patterns along with flag patterns which are further classified into two types of flags.
If I conclude this whole assignment so we discussed triangles and patterns along with their further classification also how we can use indicators with triangles and lastly we made a trade setup for different chart patterns.
I find this whole assignment helpful as a trader so thanks to the professor for this amazing research work and I highly appreciate his efforts in a lecture which made homework posts a lot easier.