Steemit Crypto Academy Season 5 Week 2 [Intermediate Course] - Matric Indicators
This is @aizazghumman; here I am going to share my homework post on the topic "Matric Indicators" given by respected professor @pelon53

Indicate the current value of the Puell Multiple Indicator of Bitcoin. Perform a technical analysis of the LTC using the Puell Multiple, show screenshots and indicate possible market entries and exits.
Puell Multiple Indicator
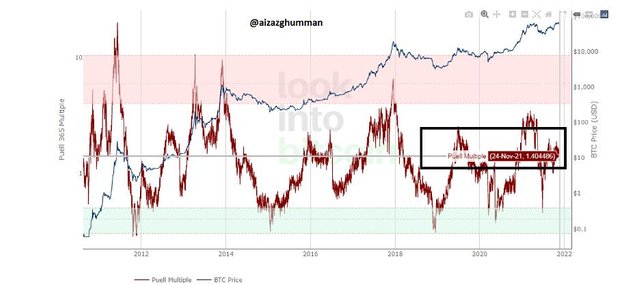
The puell indicator consists of two stripes one at the bottom which is green in color whereas the one at the top or high red when the puell indicator is low i.e. in green stripe it shows miners aren’t at much profit whereas contrast to this when puell indicator is in red stripe it indicates the profitability of miners.
The current value of puell multiplier at the time of writing this post is 1.404486
Technical analysis of LTC
The screenshot below will be used in this homework post for technical analysis of LTC using puell indicator. This indicator on LTC works the same as on bitcoin i.e. when the puell multiplier motion will be toward or in green stripe it shows the miner isn’t getting profitability hence best time for investors to make their purchases whereas the motion of puell multiplier towards red stripe shows the profitability of miner and investors here can gain profits by selling their earlier bought coins which they bought at low profitability of miners.
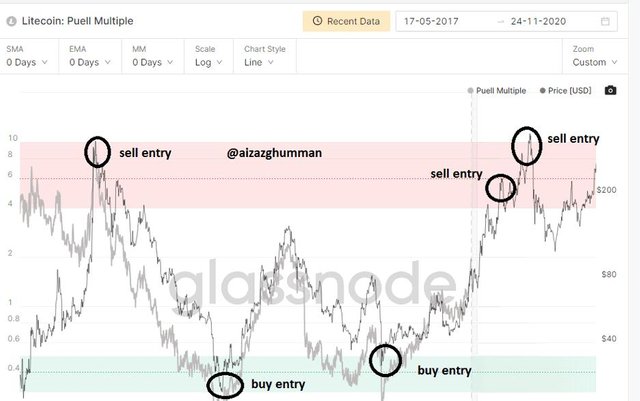
The chart above shows the puell multiplier indicator in red stripe which shows trader can place their sell entries here whereas I have also marked the possible buy entries which can be shown in the chart above when the puell indicator was at the green stripe.

Explain in your own words what Halving is, how important Halving is and what the next reward values that miners will have are. When would the last Halving be?
Halving
The halving in literature can be understood via the concept of dividing a thing into two or more equal parts the same goes with halving here in crypto. The halving in crypto refers to a halving of the reward the miner receives upon mining. The Bitcoin that is the father of all cryptocurrencies upon mining would be rewarded to miners.
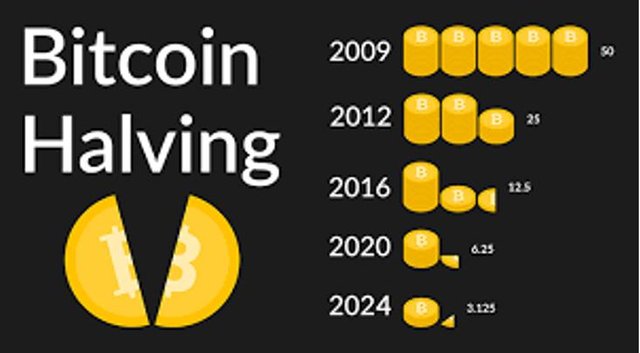
The initial value of halving reward was 50 BTC however the halving in bitcoin occurs after every four years reducing the miner reward into half of the earlier reward. Let us have a look at the history of bitcoin halving ever since it was launched and the occurrence of its first halving,
| Halving | Date | Block Reward |
|---|---|---|
| Halving 1 | 28 November 2012 | 25 |
| Halving 2 | 9 July 2016 | 12.5 |
| Halving 3 | May 2020 | 6.25 |
| Halving 4 | xpected 2024 | 3.125 |
Importance of Halving
The importance of halving can be estimated by knowing it is the halving property that gives worth to bitcoin. The halving of bitcoin simply can be understood as a process of lessening the number of bitcoin in the market which increases its worth among traders. The halving reduces the number of BTC supplying and the fewer coins we have the more important it holds and the more the coins are available for supply the less worth it holds. It can be seen through historical data every time upon halving the price of BTC has raised high making it popular and worthy in the market.
Source
What the next reward values that miners will have are. When would the last Halving be?
As can be seen above the current mining reward on bitcoin is 6.25 BTC however as we know the halving will be followed in 2024 and the upcoming reward for miners will be reduced to 3.124. Let’s have a look at possible halving dates until finished and rewards of miners of Bitcoin in the future in the chart below
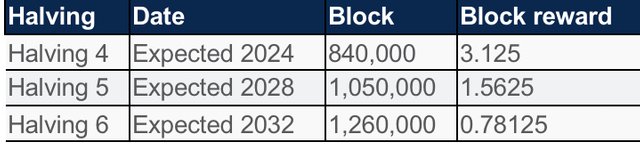
Last halving
The last halving of bitcoin is predicted somewhat in the year 2140 when 21M bitcoins will be mined after that miners are supposed to earn their reward through fees of users on the ecosystem.

Analyze the Hash Rate indicator, using Ethereum. Indicate the current value of the Hash Rate. Show screenshots.
Before coming to the analysis of the hash rate indicator let’s first know what it is. We have done many assignments on how mining works, its advantages, and disadvantages and many other things one of the things among that was mining involves computers with high computational power to resolve the complex mathematical puzzles to mine bitcoin. This is where the hash rate indicator comes into the picture.
Hash Rate Indicator
The hash rate indicator is another metric indicator that evaluates the computational power consumed by miners to solve the mathematical puzzles and confirm transactions. The higher the computational power the secure the blockchain is. This indicator can estimate whether there are many miners mining or less. This indicator can again help the investors to know when to invest or not i.e. when there are more miners and the computational power is high mean more people are investing hence investors can invest but when there’s a low hash rate it is not preferred for investors to carry out investments.
Let’s continue with the analysis of hash indicators through the ethereum blockchain. The chart below shows the hash rate indicator of the ethereum blockchain.
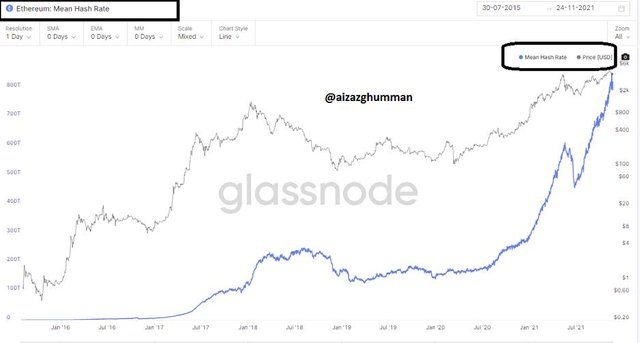
The chart above shows the mean hash rate of the Ethereum blockchain it can be seen the indicators show a high hash rate that is there’s high computational power being consumed and more people are spending on this platform hence it’s a good time for investors to carry out their investments on ethereum.
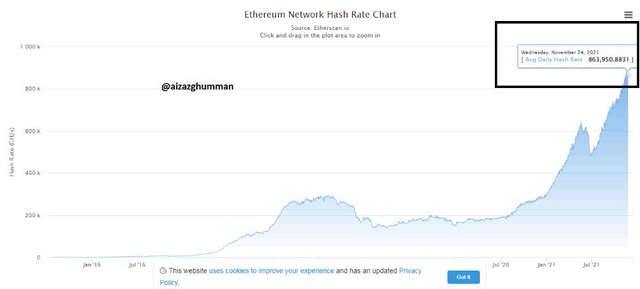
Now the current hash rate of the Ethereum blockchain at the time of writing this homework post is 863 950. 8831 GH.

Calculate the current Stock to flow model. Explain what should happen in the next Halving with the Stock to Flow. Calculate the Stock to flow model for that date, taking into account that the miners' reward is reduced by half. Show screenshots.
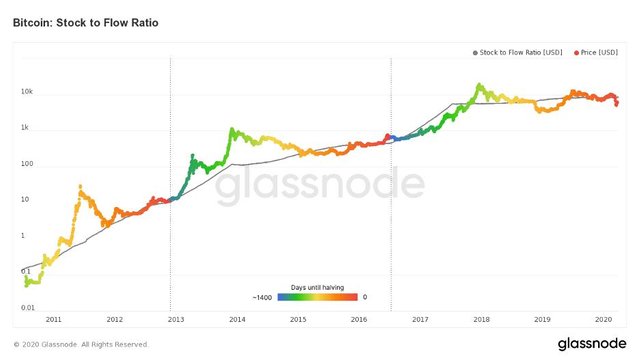
Stock to flow Indicator
Stock to flow is another metric indicator that is used to evaluate the surplus of tokens in the market or can be said as the ratio between available stock of token and annual flow of mining of tokens
Mathematical expression for stock flow (SF) = Available stock/ Annual flow
For calculating current stock-flow we must know the value of stock and flow the stock is the current value of bitcoin available whereas flow can be calculated using the following formula
Flow: Current miner reward x total number of blocks mined annually
As discussed above halving occurs after every 4 years upon completion of 21M blocks so the blocks generated per year can be calculated by
210000 / 4= 52500 are the total blocks generated per year
As discussed earlier the current miner reward is 6.25 BTC
Annual Flow: 6.25 X 52500 = 328,125
Whereas the current stock of coin market cap at the time of writing is 18,883,012 BTC
SF= 18,883,012 BTC / 328,125
Current SF = 57.4757
Now the stock to flow model can be calculated via: 0.4 X SF ^ 3
Stock to flow = 75.9528.
Explain what should happen in the next Halving with the Stock to Flow
We know bitcoin halving occurs after every four years and the miner reward reduces to half that will in 2024 and the reward will be reduced to 3.125 BTC. Now to know what will happen to stock to flow after the next halving we must know the relation between two i.e. the relationship between stock to flow and miner reward is inversely proportional as we know the reward is reduced upon halving hence the stock to flow value will increase.
I Calculate the Stock to flow model for that date, taking into account that the miners' reward is reduced by half.
As we know the halving occurs after every four years which now will be in 2024 and the reward of miners will be reduced to 3.125 BTC and the number of bitcoins that will be generated until then will be 656,250 BTC.
As we know the current circulating supply of bitcoin is however until then it will be:
= 18,883,012 + 656,250 = 19, 539,262
SF = available supply at that time / Annual flow
Annual flow = miner reward * blocks generated annually
Flow = 3.125 x 52500 = 16, 4062.5
SF= Stock / Flow
SF= 19,539,262 / 16, 406, 2.5
SF = 119.09645409
Now stock to flow model = 0.4 X SF ^ 3
= 0.4 x 119.09^3.
= 675594.144972

Conclusions
The study on metric indicators can help investors to estimate the market through using these indicators so it had been of great help to me as a trader. So far we covered three amazing metric indicators in this task used for entirely different purposes however each of these can help traders to detect the market behavior.
Bitcoin halving has always been an interesting topic to read on since it's pretty simple to easy. It simply reduces the reward for miners the next halving will probably be seen in the year 2024 reducing the miner reward to 3.125 BTC.
Lastly thanks to the professor and appreciation for the efforts he put to present us lecture which made things a lot easier for us to understand.