Trading strategy with the VWAP indicator - Crypto Academy - Dynamic Course for Beginners - S5W5
1. Explain and define in your own words what the “VWAP” indicator is and how it is calculated (Nothing taken from the internet)?
VWAP Indicator:
The VWAP is initials of the volume-weighted average price that is a technical indicator and is among popular and important technical indicators used by traders often. As the name implies this indicator indicates based on the average volume and price of the asset.
If we talk about its appearance then the VWAP indicators are not different from the moving average indicator however differs from it in the case of results as both indicator evaluates the result with different calculation method however we’ll be talking about the calculation of these indicators later in this question. However, if talking about how we predict the market using this indicator is quite similar to moving average i.e. placing our buy and sell entries according to the movement of price above and below the indicator line however the strategy of this indicator will be explained in another question.
A rare trait that makes this indicator one of its kind is unlike another technical indicator this indicator “VWAP” will maintain its indicated result on every time frame. Another thing to mention here is that the VWAP works for intraday trading only and cannot be used for anything other than that.
Now coming to the calculation of this indicator like every indicator this indicator also has a specific formula for its calculation that is as follows:
VWAP = Sum of volume and price / Number of daily candles
So from the formula above it can be estimated that the VWAP indicator indicates based on price, volume, and number of candles formed in a day. In short, the result of the Vwap indicator is obtained by summing up the volume of traded assets and price of assets traded and then dividing it by the number of candles formed daily.
2. Explain in your own words how the “Strategy with the VWAP indicator should be applied correctly (Show at least 2 examples of possible inputs with the indicator, only own charts)?
Before we start discussing the strategy of this indicator let us first learn how we can apply this indicator.
The vwap indicator can be applied in the following steps given down below:
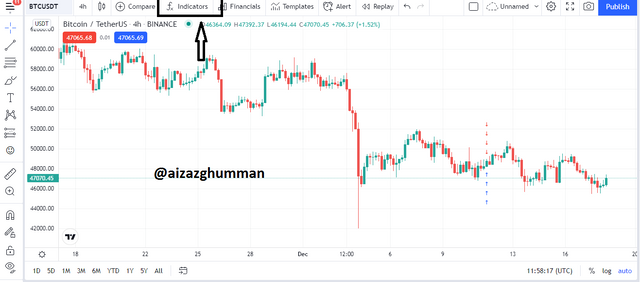
- First we’ll log in to the trading view chart as shown below and after that, we’ll click on the fx button given on the top of the as shown in the picture down below.
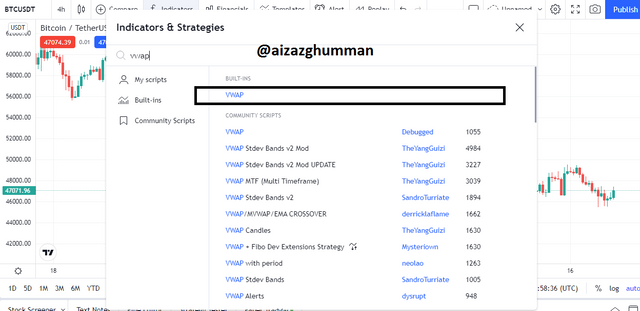
- Now next we will click on the search bar on the pop-up screen here we will enter the indicator name and then select it.
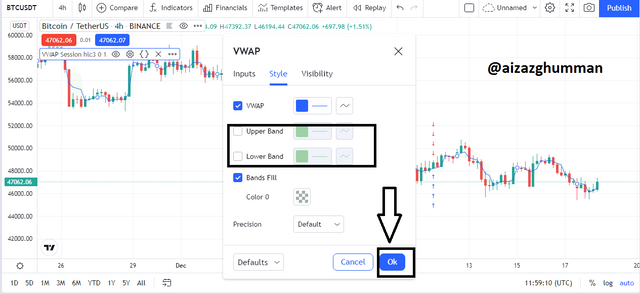
- As we can the indicator has been applied now next thing we will be doing is to go into the settings of the indicator and unmark the green lines of the indicator can be seen below.
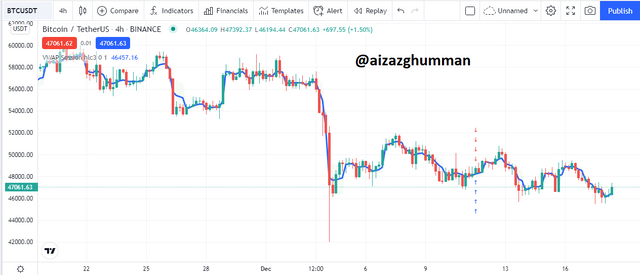
- Now finally you can see the indicator is placed on the chart.
Now we’ll be talking about how we can execute the indicator’s strategy correctly to earn maximum profits.
For earning maximum profits using VWAP strategy following steps can help traders to execute perfect strategy:
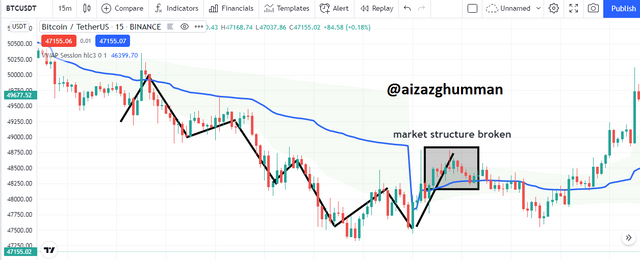
Firstly traders need to wait for market structure either bullish or bearish previously in an assignment post we discussed the break of market structure that happened when in the bullish market the new high is lower to previous high and in the bearish market the new high is higher than previous high so when that happens it is said to be a break of market structure so when it happened it is supposed to be the first step to execute the vwap strategy correctly.
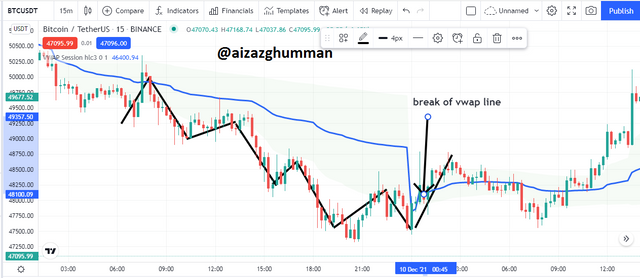
Now next step involves retracement for that we use the Fibonacci retracement tool for that we will wait for price after breaking the market structure to cross vwap line once it does we will imply the Fibonacci tool and will monitor that if the price when touched vwap line the retracement was between 50% to 61.8% or not if it was then the strategy is perfect to imply.
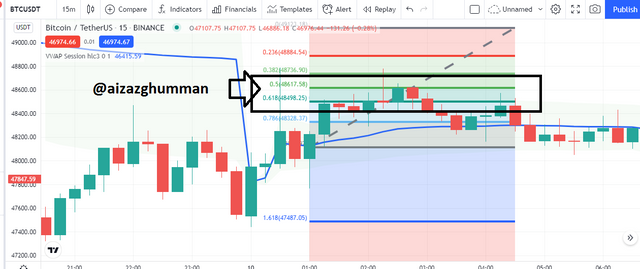
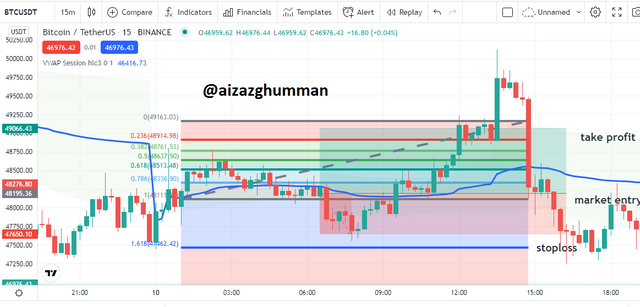
Now final step needed to finish the strategy of vwap indicator is to imply when the price is in the region of 50% to 61.8% so that’s time to enter a trade the take profit and stop loss should be in 1:1.5 ratio that is profit should be 1.5 times more than that of stop loss and stop loss should be lower to above mentioned Fibonacci levels.
3. Explain in detail the trade entry and exit criteria to take into account to correctly apply the strategy with the VWAP indicator?
Trade Entry and Exit Criteria:
In the question above we discussed the strategy of vwap indicator now here, we’ll talk about how we can use this strategy to decide our entry and exit from the market.
So the first thing to put into criteria before marking entry or exit from the market is to keep an eye on the market structure i.e. when it breaks that’s the time to make the decision accordingly. So when in the bearish market the new high is higher than the previous high or when in bullish the new high is lower than the previous high then the condition fits for deciding on entering or exiting the market.
Now the next thing we’ll put into consideration is when the price crosses the vwap line so that we can add the Fibonacci retracement tool so when we see the retracement of price in 50% to 61.8% region of Fibonacci that’s the time to enter or exit the market according to the expected direction of the market i.e. bullish or bearish.
- The next thing we do is set our take profit and stop-loss position is a ratio that takes profit should be 1.5 more than stop loss value.
4. Practice (Remember to use your images and enter your username)
Make 2 entries (One bullish and one bearish), using the strategy with the “VWAP” indicator. These entries must be made in a demo account, keep in mind that it is not enough to just place the images of the entry, you must place additional images to observe their development to be correctly evaluated.
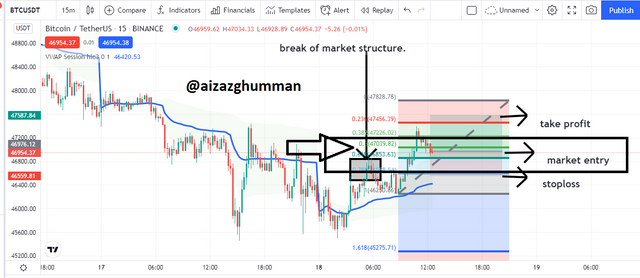
BULLISH MARKET:
For this, I will be making an entry on btcusdt chart of 15m timeframe so as we can see the break of bearish market structure so when the price touched vwap indicator line following the strategy I decided to draw Fibonacci retracement tool so when I saw retracement of the price is in the 50% - 61.8% region of Fibonacci retracement tool so I placed my buying entry here and set my stop loss below 50% to 61.8% region and set my take profit 1.5 times higher to that of stop loss.
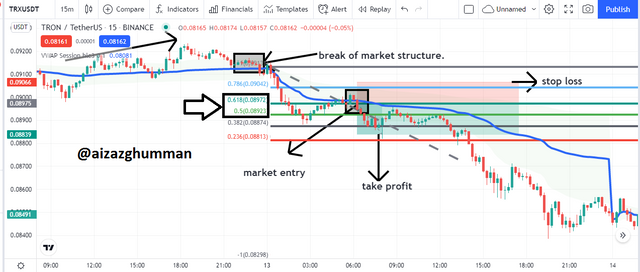
BEARISH MARKET:
For this, I will be making sell entry on Trxusdt chart of 15m timeframe so as we can see the break of bullish market structure so when the price touched vwap indicator line following the strategy I decided to draw Fibonacci retracement tool so when I saw retracement of the price is in the 50% - 61.8% region of Fibonacci retracement tool so I placed my selling entry here and set my stop loss below 50% to 61.8% region and set my take profit 1.5 times higher to that of stop loss.
Conclusion:
The vwap is among important and popular indicators and traders can earn themselves maximum profit by executing this indicator strategy correctly. This indicator looks much like moving average and works pretty much the same as that indicator but differs in calculating results. From what I heard executing the vwap strategy can get you amazing results so thanks to the professor for teaching this amazing strategy and much appreciation for the lecture given that made the task a lot easier hope I met the expectations of the assignment.
Thank you.