{Steemit Crypto Academy - Season 2, Week 8} The Wyckoff Method || XRP/USDT Wyckoff Chart
Hello everyone, it is a pleasure to be part of @fendit's class and participating in the assignment. Today, I will be writing on the Wyckoff Method but I will be focusing more on the aspect required off in the assignment. For better understanding, the assignment is stated thus;
Share your understanding of "Composite Man" and the fundamental laws. What's your point of view on them?
Share a chart of any cryptocurrency of your choice (BTC or ETH won't be taken into account for this work) and analyze it by applying this method. Show clearly the different phases, how the volume changes, and give detail of what you're seeing.
I will begin without wasting much time.
Share your understanding of "Composite Man" and the fundamental laws. What's your point of view on them?
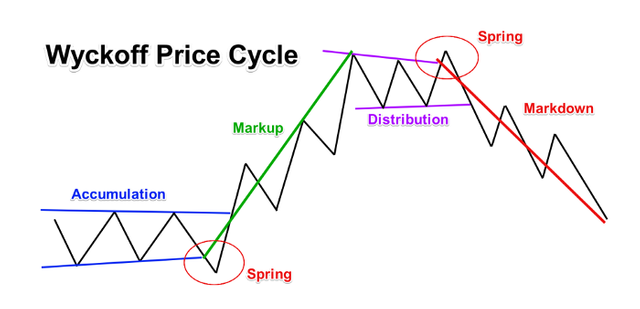
Composite Man can also be regarded as Smart money or Smart Investors, I will be using these names interchangeably in this post. To understand the composite man, you need to know that the market comprises of two major players, the ones who drive the market (composite man) and the general public (uninformed public). The composite man has knowledge of the market, insider information, and a large sum of money. With this factor, they can move the market, leading to four market stage cycles, "Accumulation, Markup/Uptrend, Distribution, and Markdown/Downtrend".
You might wonder how the composite man can be a factor in creating this cycle, well it is very simple.
Accumulation
It is a sideways trend in the market where the composite man/smart money carefully and skillfully buys into the market without causing a noticeable spike in the price. At this point, the buyers are off the market and the media isn't focused on the market. The large operators such as banks, institutions, and individuals with large trading capital and insider information buy at this phase of the cycle.
Markup/Uptrend
The accumulation of the composite man would lead to a classic spring which would draw the attention of the general public. The taught of an uptrend in the circle isn't always followed by the media, in fact, traders will be reluctant to follow the trade as it is assumed to be too risky to invest in but as price increases, the fear of missing out (FOMO) comes into play and the composite man use this medium to sell part of their holdings. with every sell in the dip, people position themselves to buy more so as to get their own share of the uptrend move. There will be volume in the market just as the trend increases.
Distribution
This is the point where the market reaches a solid point and people start to notice another sideways movement. At this point, traders with technical knowledge begin to put more attention on the market as the market would either go up or begin a downtrend but in most cases, it is believed to be a simple pause followed by another uptrend ride but the reverse is the case. The composite man sells the remaining holdings they have silently to the public. The selling is done skillfully so as not to break the market and cause a downtrend below the support level.
Markdown/Downtrend
This stage is the complete opposite of the Markup/uptrend phase. The market does not start like that, instead, people are still optimistic that the market will increase in price and so people would be willing to buy at the low with the intention that it is a correction. At this point, the composite man starts to sell short the positions so as to get more profit, and then the real downtrend begins.
Wyckoff Fundamental laws
The Wyckoff cycle is believed to be caused by a few fundamentals and these includes;
The Law of Supply and Demand
The Law of Cause and Effect
The Law of Effort vs. Result
The Law of Supply and Demand
This is one law that is known by virtually everyone in the market. It is no doubt that the price is determined by demand and supply, the higher the demand, the higher the price and the higher the supply, the lower the price. When demand is greater than supply, the price increases, when demand is lower than supply, the price reduces, and when demand is equal to supply, the price is stagnant.
- The Law of Cause and Effect
There are several causes and effect that leads to demands and supply and these causes are known as preparation periods. The preparation periods usually the accumulation and distribution periods which lead to uptrends and downtrends alike.
- The Law of Effort vs. Result
The law explains that prices are a result of efforts in the market to either move them up or down. This effort is often known as volume. When there is a high volume accompanied with sell, there is a market change downward, and when there is a high volume accompanied with the buy, the market move to an uptrend.
Share a chart of any cryptocurrency of your choice and analyze it by applying this method.
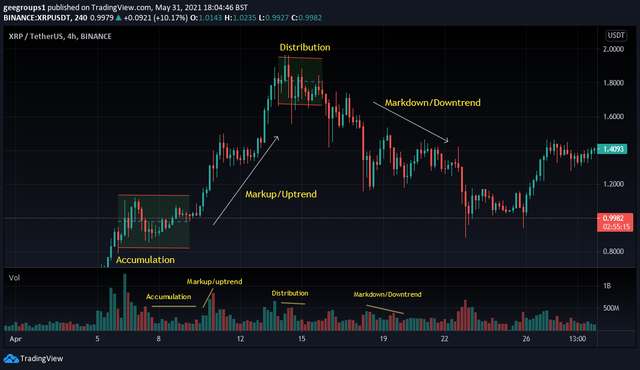
To study the Wyckoff method on a chart, I will be using the XRP/USDT trading pair, using a 4hr timeframe chart. There was an accumulation period between the 6th of April, 2021, and the 9th of April 2021. There was an uptrend/markup period between the 10th of April and 13th of April 2021, and a distribution period between the 13th of April, and the 16th of April 2021, and a markdown period between the 16th and the 23rd of April 2021.
Conclusion
Wyckoff's method proposes 4 stages of the market cycle and this is a very good method for individual traders to follow while trading so as to be safe while trading. At the point when a coin is going on the media as the coin of the century, it is a good time to start leaving such trade because the distribution stage is about to begin.
Thanks a lot @fendit for the class, I must confess that I enjoyed attending.
Thank you for being part of my lecture and completing the task!
My comments:
I'm not that conviced by your work. At first, the idea of a Composite man doesn't mean that there's uninformed investors or smart investors. It's just related to see the bigger picture in the market, aside from your position or general knowledge.
The rest of the explanations were a bit too vague and simple.
When it comes to the chart, there were some mistakes. At first, the accumulation period, although volume was ok, there were several ups and downs in price, while it should have been a bit more stable.
You didn't show either the re-accumulation and re-distribution periods that are clearly seen there.
As well as that, the analysis lacked a lot of development.
Overall score:
3/10