Effective Trading Strategy using Line Charts -Steemit Crypto Academy | S6W1 | Homework Post for @dichalmo
.png)

1- Define Line charts in your own words and Identify the uses of Line charts.
Using my own words, I like to keep it simple. A line chart is a graphical representation of the price of a commodity (token/coin in this context), using a line. This line is plotted with the price on the Y-axis and time on the X-axis and is vital in indicating the HIGHS AND LOWS of the price of the commodity. It can be used across many timeframes, to get a multi-timeframe analytical view.
This method of charting is embraced by many price action traders because of its simple nature and ability to filter the noise generated by insignificant fluctuations in price movement and points to the general trend of the market.
Uses
Trend determination
The line chart as stated above is used by price action traders to filter the noise and determine the market trend. It filters out the noise from insignificant fluctuations during trading periods of the day and this results in a clear direction of the market and even an indication of momentum.
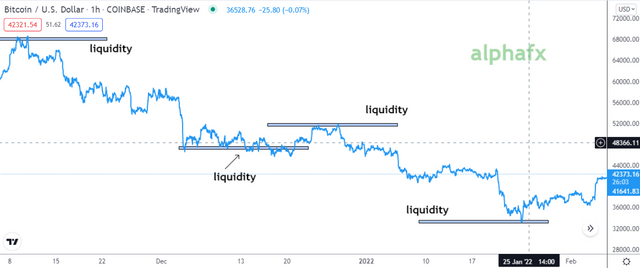
Liquidity Levels
The line charts are very good at depicting highs and lows and can be used to identify and monitor liquidity levels which will serve as support or resistance to price movement. Its nature also filters out insignificant spikes or market manipulations, providing more accuracy in the identification of liquidity levels.
Trading
With or without the help of indicators, the line chart can be used to analyse and enter trades. Chart patterns like divergences, double tops, head and shoulders, and their opposites can easily be spotted using a line chart.

2- How to Identify Support and Resistance levels using Line Charts (Demonstrate with screenshots)
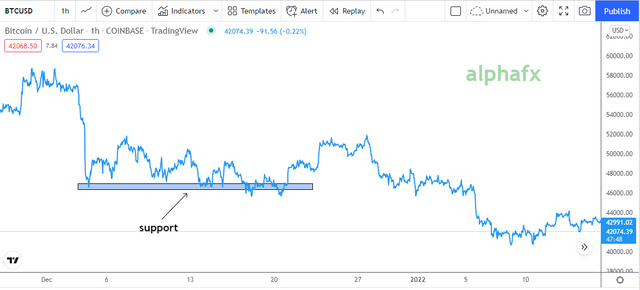
Liquidiy levels are price ranges which traders have marked to have high trading activity. There are many types of liquidity levels, but only two major types; Support and Resistance.
Support levels are liquidity levels which buyer aim their buy orders at, during a sell. The support one is an area where the market experiences bullish pressure. They can be recognized from the repeated number of lows forming at that price level.
Resistance on the other hand is a liquidity level where the sellers aim to placetheir orders. This creates a bearish pressure. When the market is overbought, that price level serves as a resistance, as most traders sell/take profits from this price level.
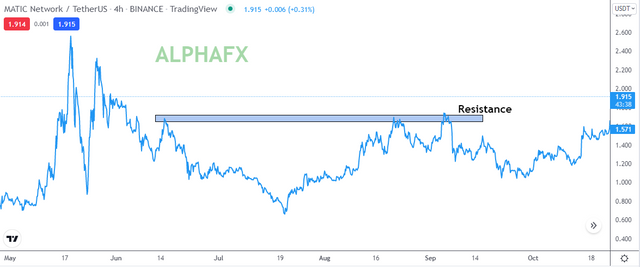
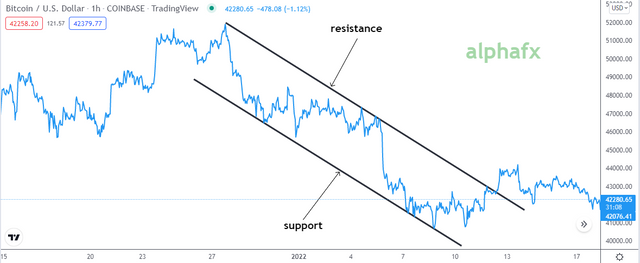
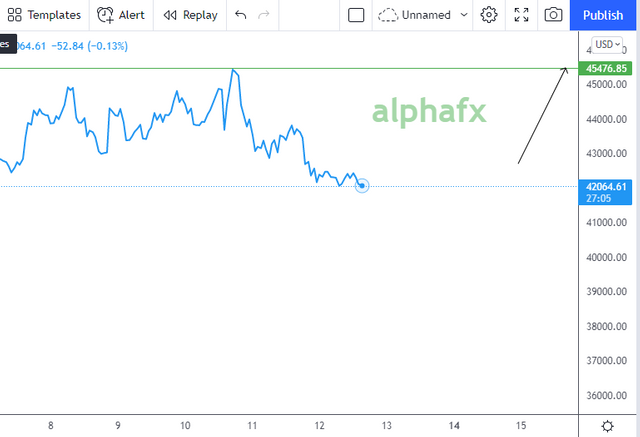
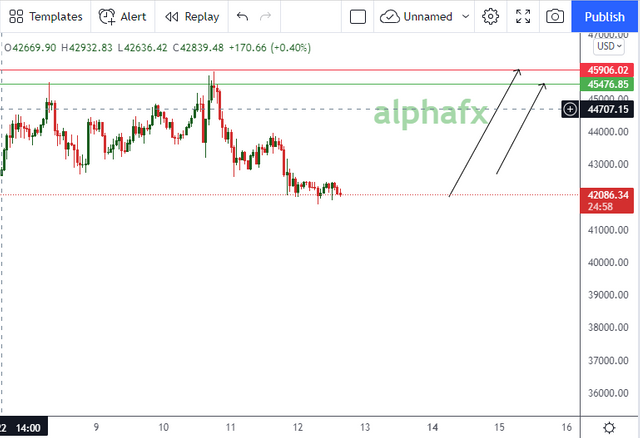
Sometimes, the support and resistance are not price levels, rather gradients. These make for slanted resistance/support as seen in the image below. They can also form channels, as the image below accurately depicts.
3 - Differentiate between line charts and Candlestick charts. (Demonstrate with screenshots)
There are a reasonable number of notable differences between the line chart and the candlestick chart. Breaking them down separately will be more informative for the readers, so let's go;
Charting [Timeframe]
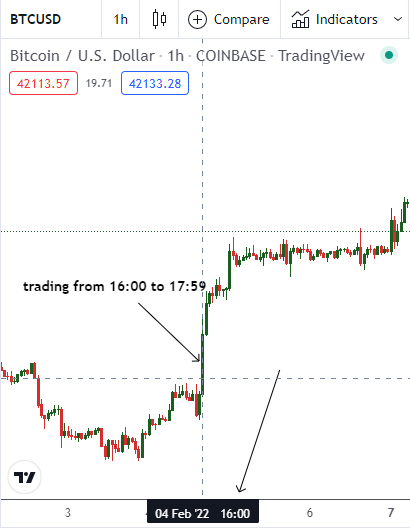
The candlestick chart represents a unit of its time frame with a candle. This means each candle in the 1hr timeframe represents an hour of trading. This is unlike the line chart where there is no distinguishable graphic representation of the timeframe, however the timeframes are used to give a more landscape or focused view.
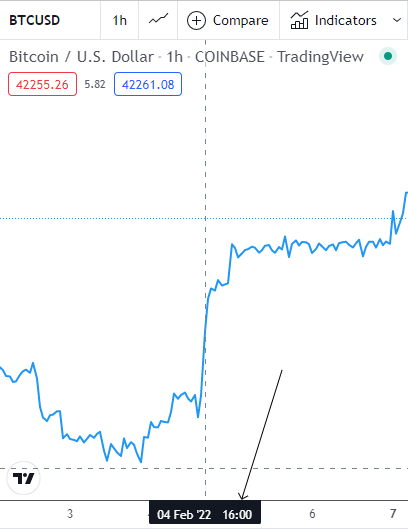
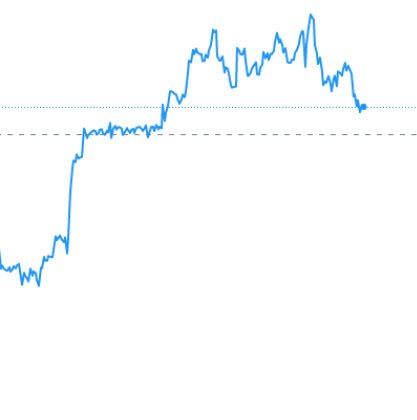
Screenshots from tradingview.com
The images above shows BTC in a line chart and a candlestick chart, focused at the same hour. We can see the candlestick distinguishing the time frame.
Noise Cancelation
The candle stick chart is more interested in the actual trend of the market and ignores periodic price fluctuations. This is not the same for the candle stick chart, as it tries to encompass all that happened with price within that period of time
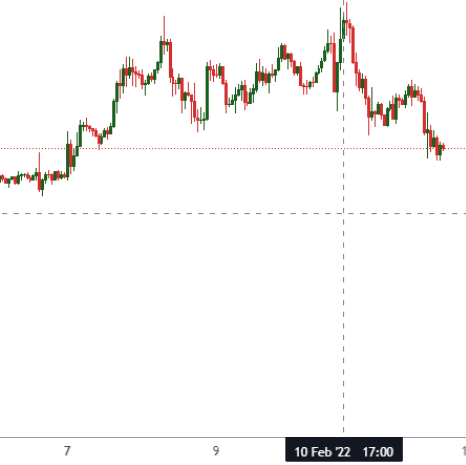
Screenshots from tradingview.com
As we can see, the two charts have different high. This is because the line chart filtered the insignificant movement in price, while the candlestick chart showed everything.
4 - Explain the other Suitable indicators that can be used with Line charts.(Demonstrate with screenshots)
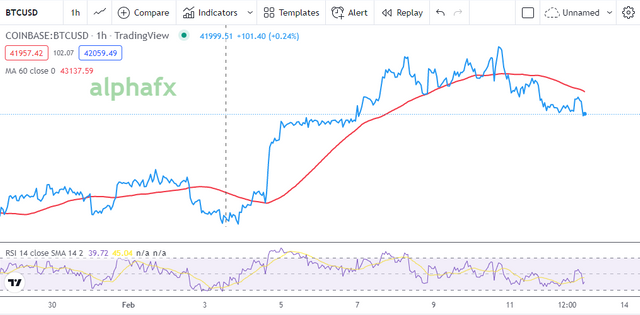
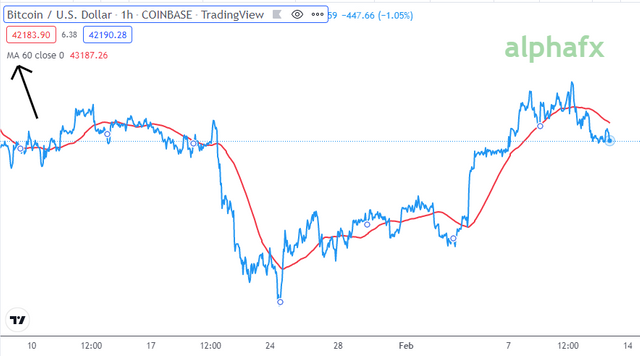
Personally, I've tested and used two indicators while using a line chart for analysis. They are simple indicators and arguably the most popular; The RSI and Moving average.
Using a Moving Average on a line chart can help you spot reversals. My customized setting on this indicator is the 60 period. 60 because I try to filter as much noise as I can. A cross between the price and moving average confirms a change in trend and this has an accuracy of about 80%.
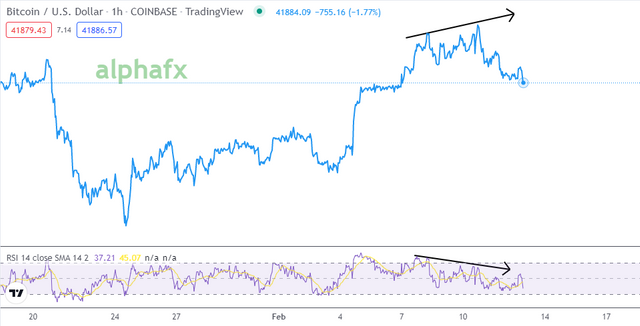
The RSI is used to spot divergences. A divergence occurs when the higher high and lower high or higher low and lower low combinations on the Price chart and RSI are different. AS SHOWN BELOW.
While a better confirmation for this signal is when the RSI goes above 70 or below 30, indicating an overbuy or oversell while the divergence is being formed.
Of course, you can combine these two indicators and have an even more accurate trading strategy; increasing your chances to at least 85% chance of profit or break-even.
5. Prove your Understanding of Bullish and Bearish Trading opportunities using Line charts. (Demonstrate with screenshots)
There are so many ways to find trades using the line chart. I'll stick to simple chart pattern for this question.
Head and shoulders (bearish reversal)
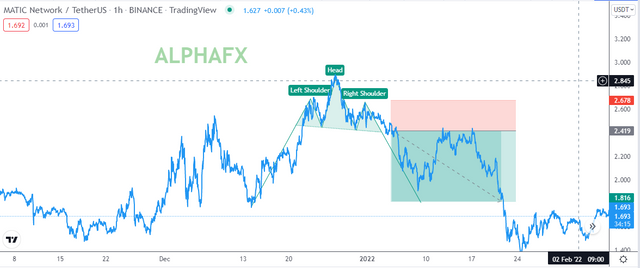
The image above shows what actualtrading looks like. While learning to trade, we are shown what ideal situations look like, but real head and shoulders are not perfect. We can see the market was generally in an uptrend, then a head and shoulders pattern formed. The trade is placed as the trend line is broken. A stoploss at a level above the previous high is put in place and a take profit of at least x2.
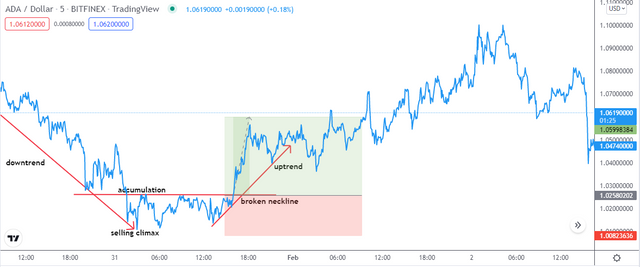
Wyckocff's Rule
The Wyckoff's rule is a general overview of market structure as portrayed below. There was a downtrend and an accumulation phase, as soon as the neckline was broken, the trade opened and an uptrend took place. The SL should be below the selling climax and TP at least 2:1 of SL.
6 - Investigate the Advantages and Disadvantages of Line charts according to your Knowledge.
There are advantages to using a line chart, however there are disadvantages too. Of course these do not apply to everybody, as certain types of traders find the line chart optimal and some do not share this view. Here is a simplified rolldown of the advantages and disadvantages:
| Advantages | Disadvantages |
|---|---|
| Easy to understand | Limited to certain indicators |
| less noise on chart | Cannot be used to trade fundamentals/sentiment |
| clear trend direction | doesn't show market Open, high, low and close |
| easy to spot waves and patterns | Cannot use to trade candlestick combinations e.g morning star |
CONCLUSION
Line Charts are in one wor, simple. A beginner trader should stick to the line chart. I believe so because of its simplified and direct nature. Unless one wants to study the behavioural pattern of the market through micro-details, there is truly no need for candlesticks and the rest. The line chart make trading simple, and trading should always be simple to be profitable.
Like I said earlier, different types of traders to different types of charts. I started my journey as a trader with the line charts, in 2020 I began learning candlesticks. I interchange the both depending on strategy and commodity traded. That being said, This was a wonderful lecture to partake in, thank you @dichalmo for this.