Ichimoku Kinko Hyo
INTRODUCTION
.png)
The professor @kouba01 extensively explained the japanese indicator; Ichimoku Kinko Hyo, literally translating to "a glance at equilibrum in chart". At first glance, every non-japanese speaking anime fan would say it sounds like some trading jutsu, and they would not be far off, popular trading techniques have been developed using this indicator.
The professor after the enlightening class did not fail to task us to ensure communication was achieved. This article is written as an attempt to complete the task below;
- Discuss your understanding of Kumo, as well as its two lines. (Screenshot required)
- What is the relationship between this cloud and the price movement? And how do you determine resistance and support levels using Kumo? (Screenshot required)
- How and why is the twist formed? And once we've "seen" the twist, how do we use it in our trading? (Screenshot required)
- What is the Ichimoku trend confirmation strategy with the cloud (Kumo)? And what are the signals that detect a trend reversal? (Screenshot required)
- Explain the trading strategy using the cloud and the chikou span together. (Screenshot required)
- Explain the use of the Ichimoku indicator for the scalping trading strategy. (Screenshot required)
- Conclusion:

KUMO
.png)
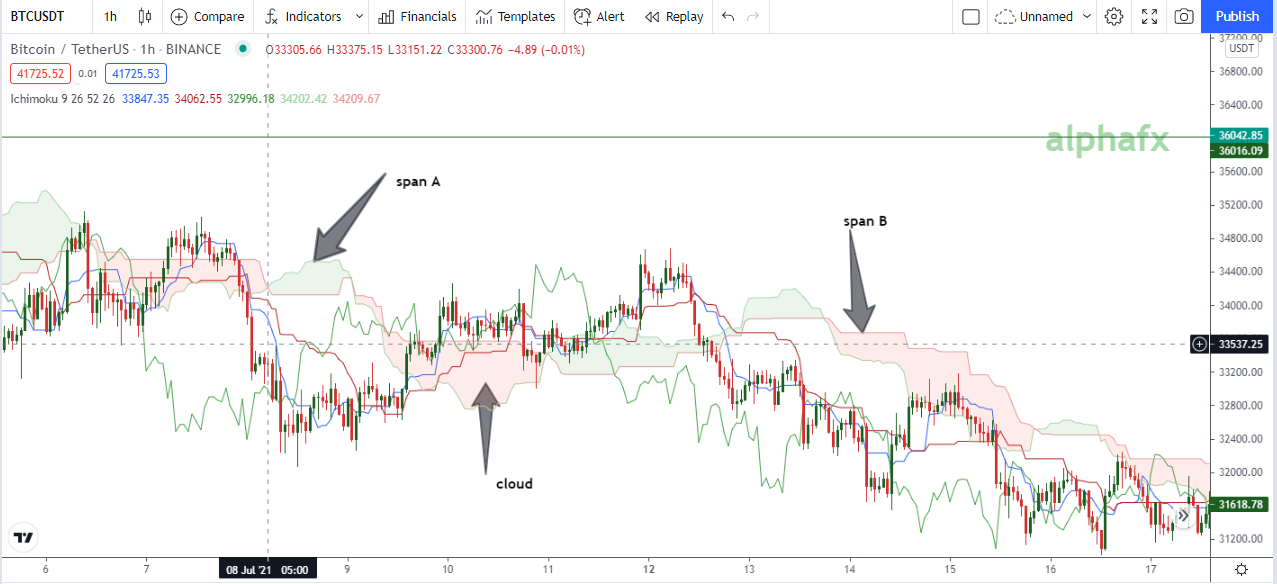
The word KUMO is japanese for "cloud" (in this context). The Ichimoku cloud is formed by the Senkou lines. The Ichimoku Kinko Hyo indicator is made up of
The first span (A) is derived from finding the average of the Tenkan Sen, a line plotted by finding the highest and lowest points for the past 9 periods and the Kijun Sen which is plotted from the highest and lowest points from the past 26 periods. The first Senkou line is then plotted 26 periods ahead of these. During uptrends, this line forms the upper boundary of the cloud, but the lower boundary of the downtrend.
The second Senkou span (B) is plotted from the highest and lowest points of the price movement for the previous 52 periods and is plotted 26 periods ahead. A twist occurs as the market changes to downtrend, and you find the span B forming the upper boundary of the cloud. During uptrends however, it is the red-line lower boundary.
Different platforms have different colours for representing the spans of the cloud, however in the image below, the green line is the Span A and red Span B.
CLOUD vs PRICE
In trading, the Ichimoku cloud is better used during defined trends and plays a lot of roles. Senkou Span A is known a the faster moving average while span b is the slower. When the Slower trades above the faster, the market is bearish and vice versa.
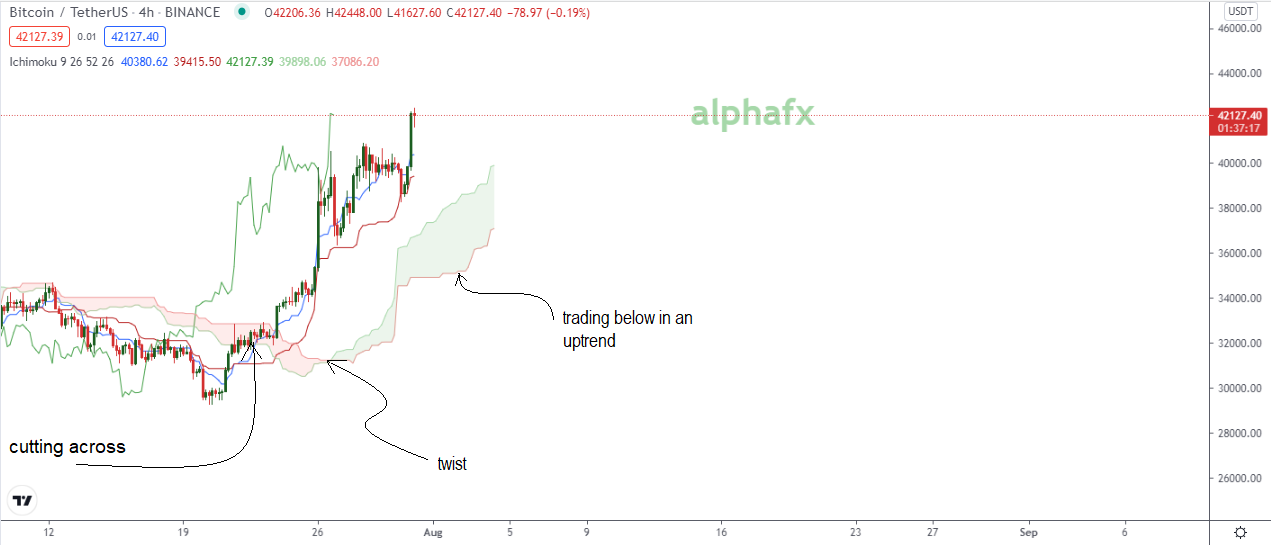
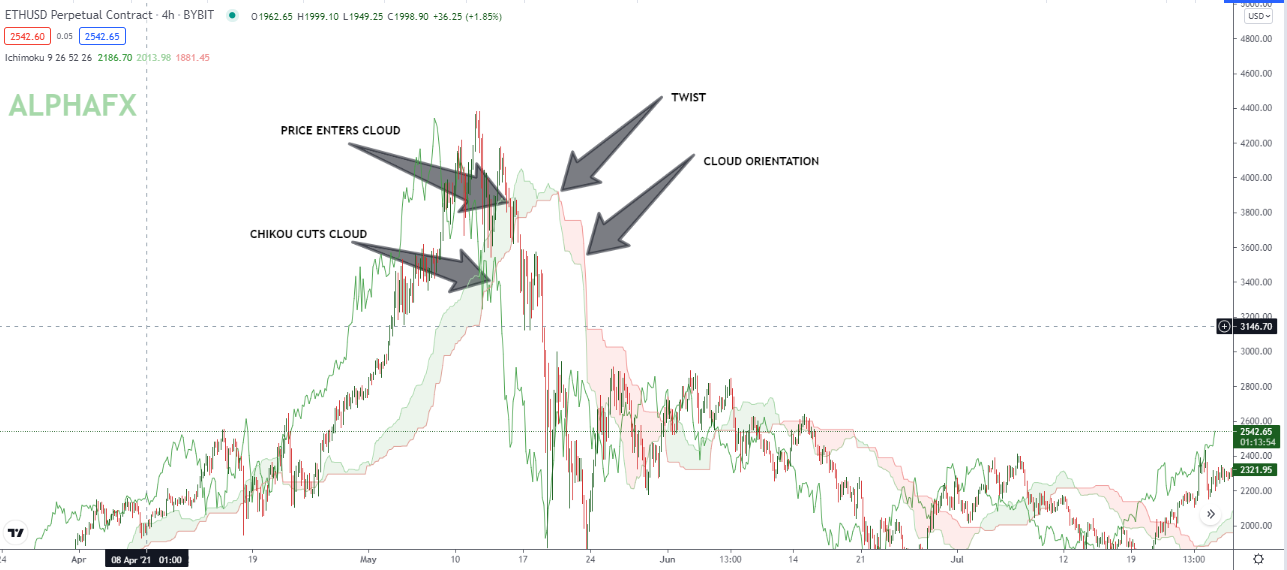
Spot trend changes; Although not always so, the ichimoku cloud trades below the price in uptrends and cuts the price to indicate a change in trend, and resumes trading above the price to indicate the change to a downtrend. There is always a twist, interchange of positions of the spans to support this indication in change of trend.
Finding support; During uptrends, support levels are very important to find entry points or reversal points. The span A senkou line of the ichimoku cloud serves as first support for the market while the span B is second support.
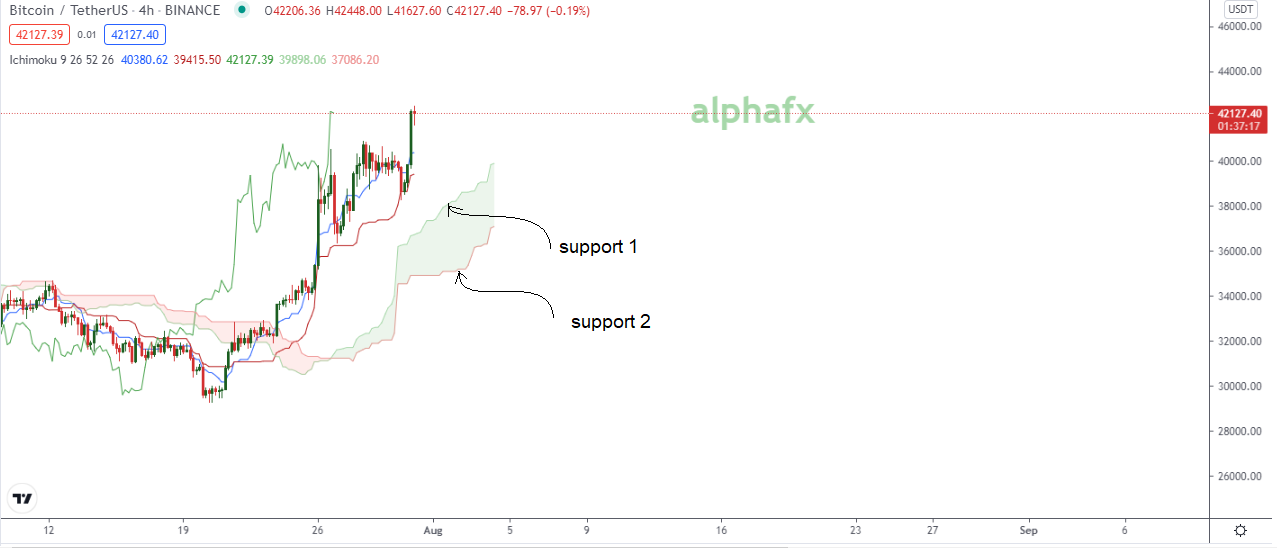
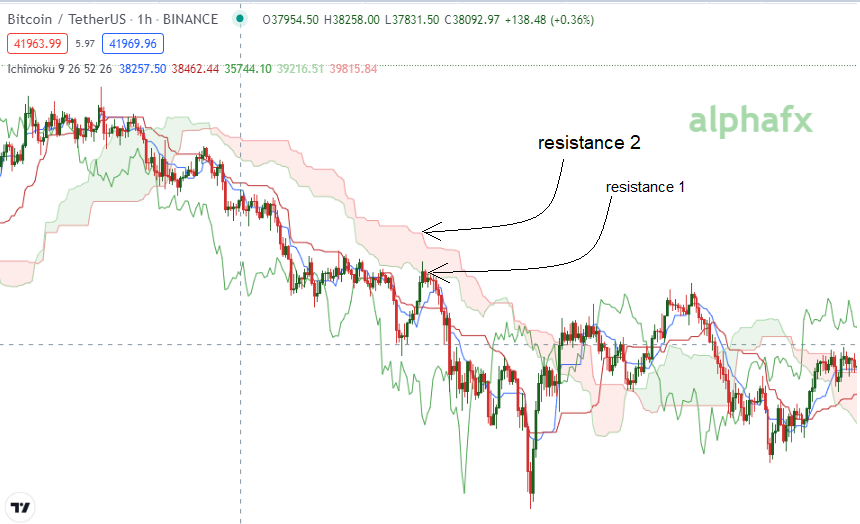
Finding Resistance; During downtrends, and the cloud cuts across the price to trade above, the resistance levels are indicated by the first and second senkou spans too. The span A represents the first(weaker) resistance and the span B serves as a stronger resistance
The Twist
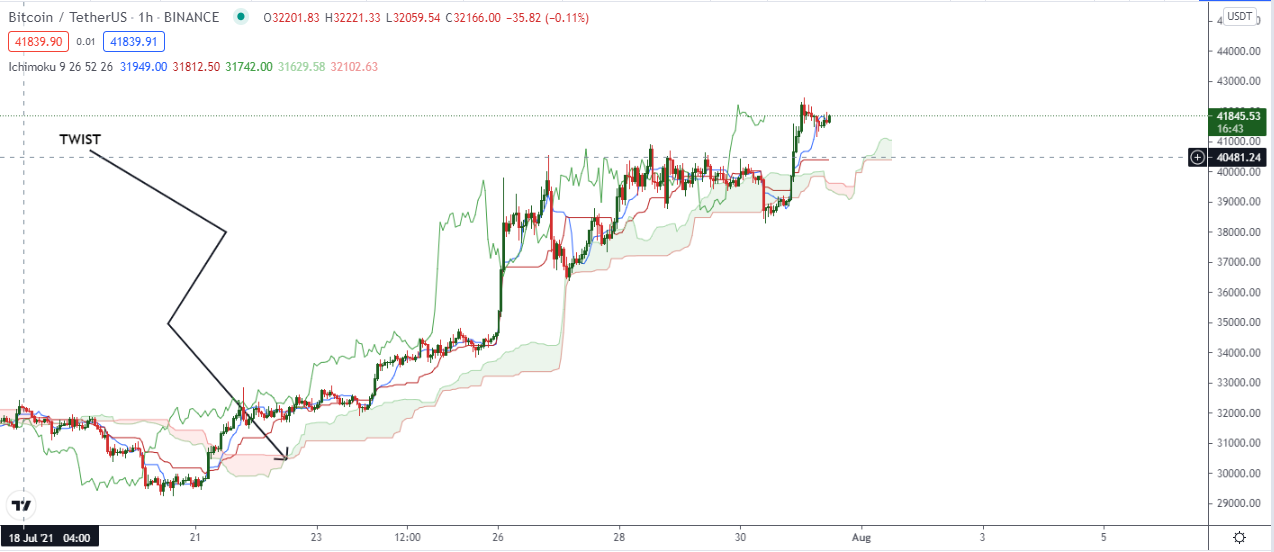
The twist occurs when there is a change in sentiment of the market, indicating a possible change in trend. On the chart, it literally looks like a twist, as indicated above, where the faster moving average interchanges position with the slower moving average.
In Trading:
Just like a cross in moving averages, the cloud twist is used by traders to identify changes in market sentiment. When the Senkou span A cuts across the span B, traders use this twist to monitor market sentiment and momentum of the market and take profits/cut losses short, if the sentiment of the market goes against an open trade.
Trend Confirmation
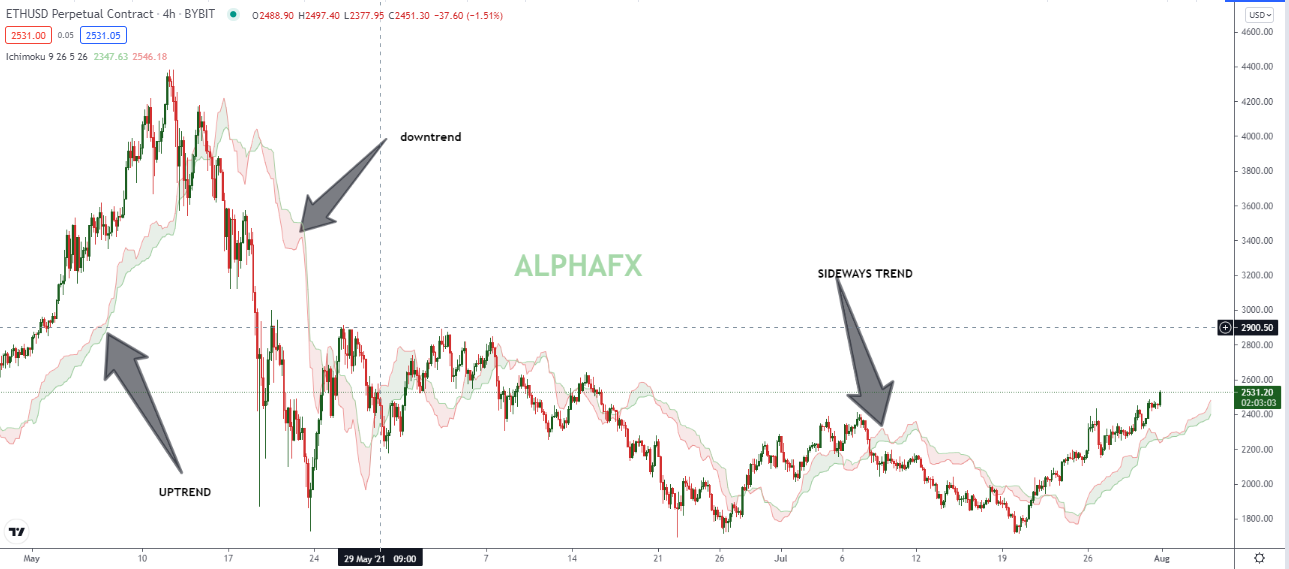
As much as we'd like to think it is very easy as stated above to confirm trends, By using the position of the Senkou Span A and B, we know this could go both ways, forming a green cloud or red cloud. These two scenarios cannot accurately depict the three possible trends, Uptrends, Downtrends and Sideways trends.
For Uptrends, when the twist occurs and the cloud begins trading below the price, The Senkou span A is above the B. To confirm this is in an uptrend, just like in the image above, the cloud has to show upward motion.
Downtrends are significantly portrayed by a twist leading to the Senkou span B trading above the A, The cloud being above the price and finally, the cloud has to show downward motion.
Sideays trends are the trick, they are not easily spotted as the SSA and SSB could be in any position. However, you can distinguish a sideways trend with the flat nature of the cloud.
Trend Reversal
Trend reversals can be spotted using the Ichimoku Kinko Hyo indicator, however this needs confirmation from these four actions before it's safe to ay the trend has changed.
The twist occurs, the SSA and SSB interchange positions.
Price action breaks into the cloud, and cuts across it, signalling a change in direction.
The Chikou span, a very smart MA, is known for avoiding false trends, when it cuts across the cloud, it shows a strong indication of a possible change in trend. The Senkou and Kijun can also show their capabilities as support and reisitance during this.
Last but not the least, the actualmorientation of the cloud confirms the change in trend. If the cloud formed after the twist shows defined direction with the slower curve being the SSB moving in the direction of the new trend, the trend can be trusted.
Trading System Using Chikou and Cloud
The chikou is the lagging line, 26 periods behind price action, and this means its 52 periods slower than the cloud. However these two work hand-in-hand to confirm trend. It is safe to say a trading system based off these two parameters will be based on trend reversal and catching the new trend early.
This can be done using the system above, first confirm the trend;
- The twist occurs, the SSA and SSB interchange positions.
- Price action breaks into the cloud, and cuts across it, signalling a change in direction.
- The Chikou span, a very smart MA, is known for avoiding false trends, when it cuts across the cloud, it shows a strong indication of a possible change in trend. The Senkou and Kijun can also show their capabilities as support and reisitance during this.
- Last but not the least, the actual orientation of the cloud confirms the change in trend. If the cloud formed after the twist shows defined direction with the slower curve being the SSB moving in the direction of the new trend, the trend can be trusted.
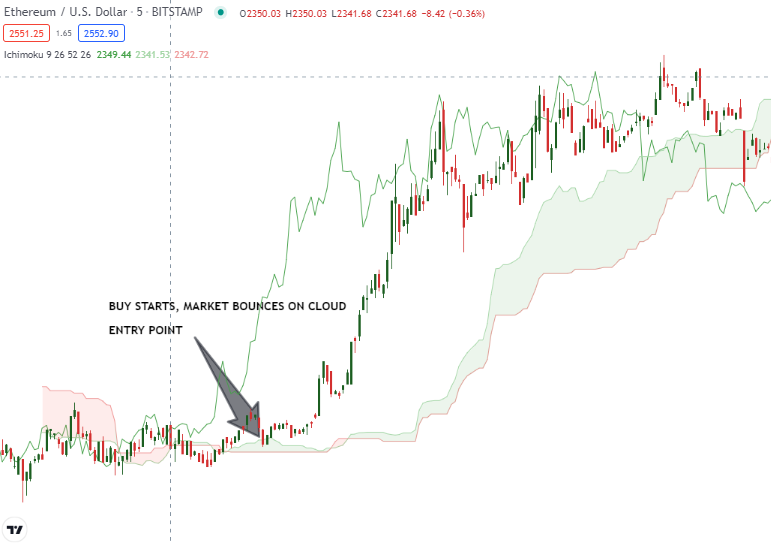
When the trend is confirmed, a good entry point would be to wait for price to test the resistance/support zone, created by the cloud. The new resistance zone will hold under normal circumstances and the new trend will continue.
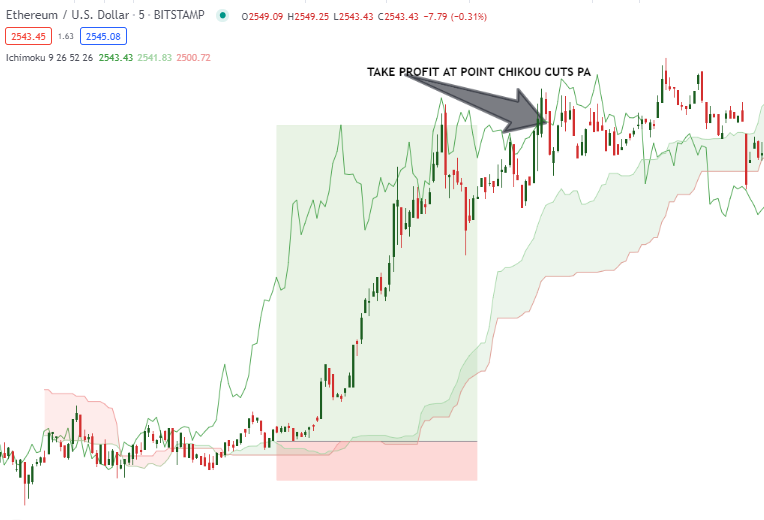
Stop loss should be above the ichimoku cloud zone (or below if the trade is a buy). Profit can be taken using support or resistance zones, or when the chikou cuts price action next.
Scalping With Ichimoku Indicator
First wait for the twist and the chikou cut.
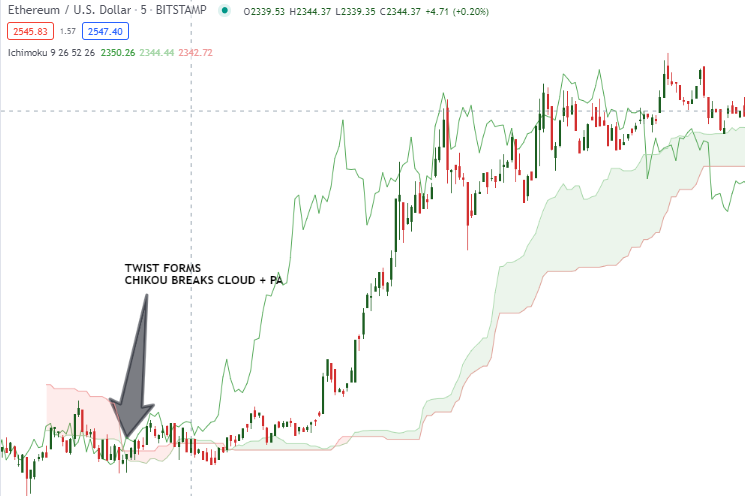
wait for trend to begin, then retest cloud, enter market as it bounces off the cloud.
Ride the market until the chikou cut the price action again to indicate changing sentiments in market.
CONCLUSION
The Ichimoku Kinko Hyo indicator has been around for long, it was used trade rice in japan. It is a reliable indicator and makes good use of the periods. Change in trends and fluctuating support/resistance are common problems traders face, however this indicator finds a way to reduce the problem with its spans serving to mark these points. Using good risk management and careful planning, it is a wise indicator to use.
Hello @alphafx,
Thank you for participating in the 5th Week Crypto Course in its third season and for your efforts to complete the suggested tasks, you deserve a 5.5/10 rating, according to the following scale:
My review :
An article with average content that contained answers to some questions that lacked depth in the analysis, and I will justify some of the observations for you:
Your interpretation of the cloud and its lines was brief and lacked some depth in the analysis.
You did not delve into the analysis of the relationship between price action momentum and the Ichimoku cloud, especially using the Kumo Thickness. As well as to determine the levels of support and resistance that differ from the traditional method.
Your interpretation of the twist and how to use it when trading is missing some depth in the analysis.
The fourth question guarantees correct information but lacking deepening the analysis of the answers.
Thanks again for your effort, and we look forward to reading your next work.
Sincerely,@kouba01
Thank you for your review.
For improvement purposes
What is criteria are to be fulfilled under the parameter “originality”?
Thank you
Very insightful my gee.....i have been waiting for your post for a long time now.....welcome back sir.
How have you been?
God gat us my gee