Trading with Rate of Change Indicator - Crypto Academy /S4W8-Homework Post for kouba01. 27/10/2021
Hello everyone, welcome to week 8 of the season 4 Steemit Crypto Academy course by professor @koubal.
Without wasting much of our time, let me quickly proceed with the given tasks.

QUESTION 1
In your own words, explain the ROC indicator with an example of how to calculate its value?And comment on the result obtained.
The ROC indicator which stands for "Rate Of Change in price" indicator is a momentum based indicator which helps to detect how fast the price of a given asset is either rising or falling. It does this by calculating the percentage change in price.
Through its calculations, the ROC indicator also signals trend direction. When the percentage change in price of an asset is positive, it is an indication that the current price has been on the upside over a certain period when comapared to the previous price.
The Rate Of Change indicator is represented by an oscillating line similar to that RSI indicator with its major difference being that it moves around numbers with a midpoint of 0.
Aside signaling trend direction, it also shows trend continuation by trending above or below the mid point.
A trend above the mid point is an uptrend and that below the mid point is a downtrend.
It is also used in identifying divergence by trending in a direction opposite that of the price chart. When this happen, it is a signal for a possible trend reversal.
The ROC indicator is an indicator which is efficient for a trader in various ways. Being a momentum indicator, it also indicates an overbought and oversold regions.
HOW TO CALCULATE VALUE
Formula:
ROC = (current price - price of N periods back) / Price of N periods back × 100.
Using BTC|USDT price chart in the last 9 periods.
Lets say current price of BTC= $60,000
Previous price = $59,000
Substituting the values in the above formula we have:
ROC=(60,000-59,000)/59,000 × 100
ROC=(1,000)/59,000 × 100
ROC=0.0169 3Sf × 100
ROC=1.69%
COMMENT
From the above calculation, the ROC indicator on the BTC|USDT price chart is positive in the last 9 periods which is an indication of an uptrend.
QUESTION 2
Demonstrate how to add the indicator to the chart on a platform other than the tradingview, highlighting how to modify the settings of the period(best setting).(screenshot required)
I will be performing this task using Goodcrypto.com
Step 1
Log into Goodcrypto.comon your browser and click on web app as seen below.

SourceStep 2
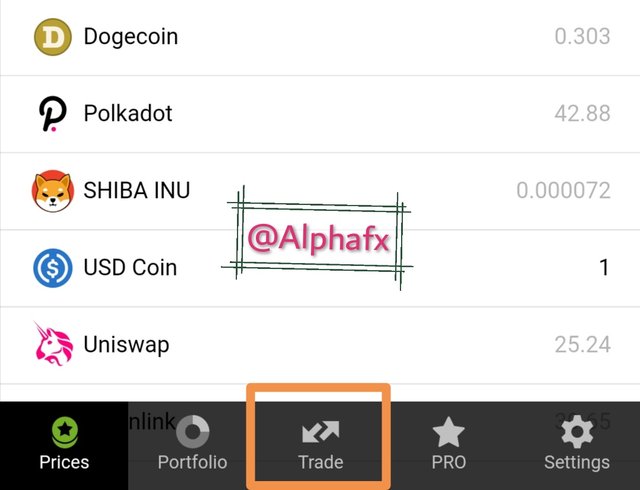
After selecting web app, click on trade.
SourceStep 3
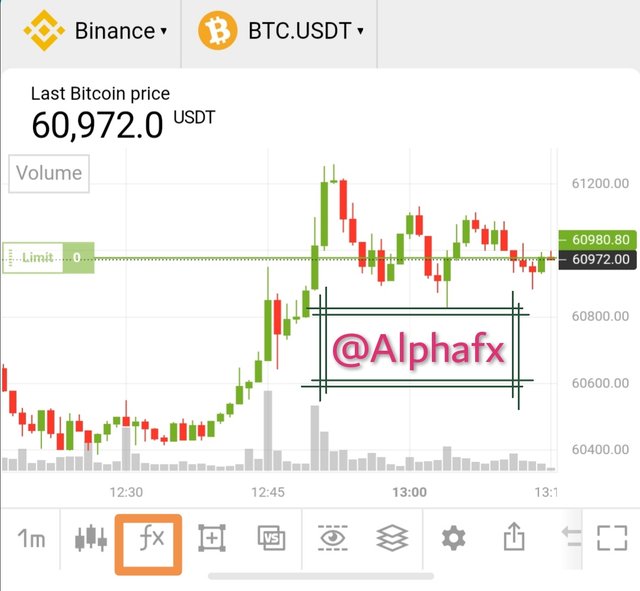
After selecting trade, click on FX to access the list of indicators on the platform.
SourceStep 4
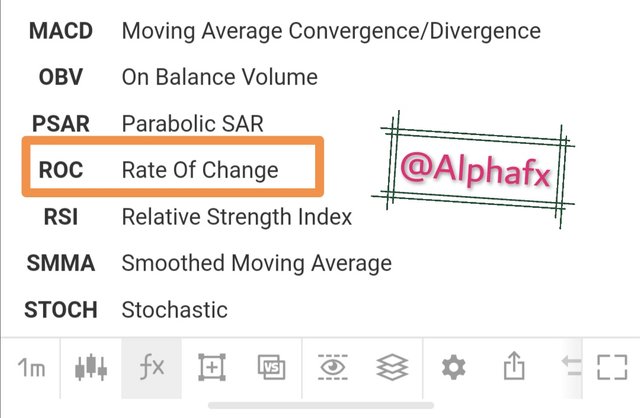
On the list of indicators, select ROC.
SourceStep 5
The ROC indicator have been successfully added as seen below.
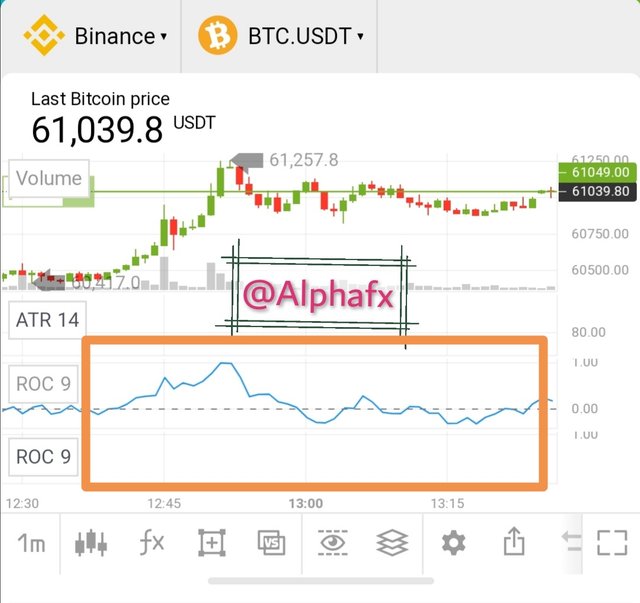
Source
MODIFYING INDICATOR
Step 1
Click on ROC as indicated by the arrow and click on settings as seen below.
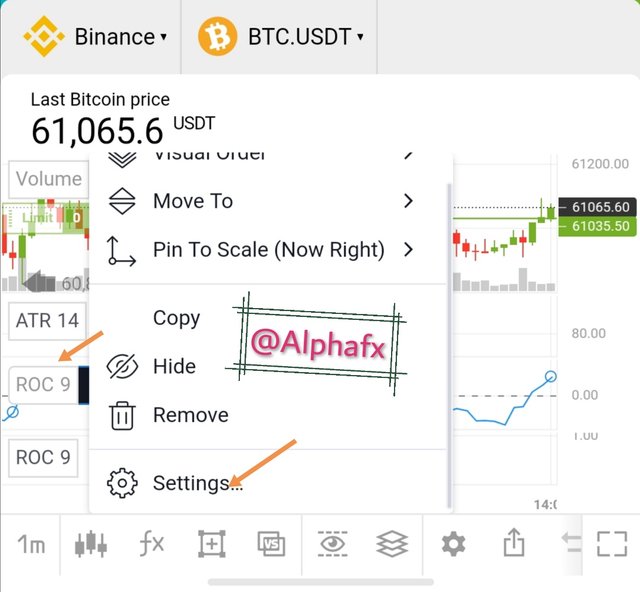
SourceStep 2
Under input you can click to choose the period of your choice. Under style, you can change the colour of the indicator and zero line.
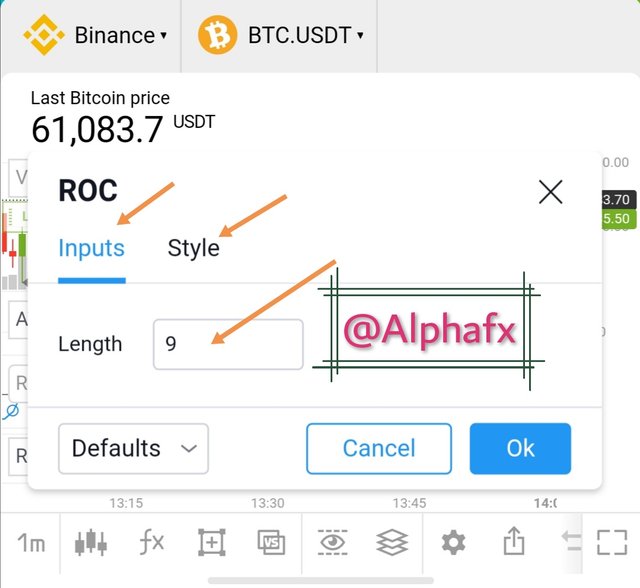
SourceStep 3
I have modified the indicator by choosing a period of 12 and changing the colour of the zero line to sky blue.
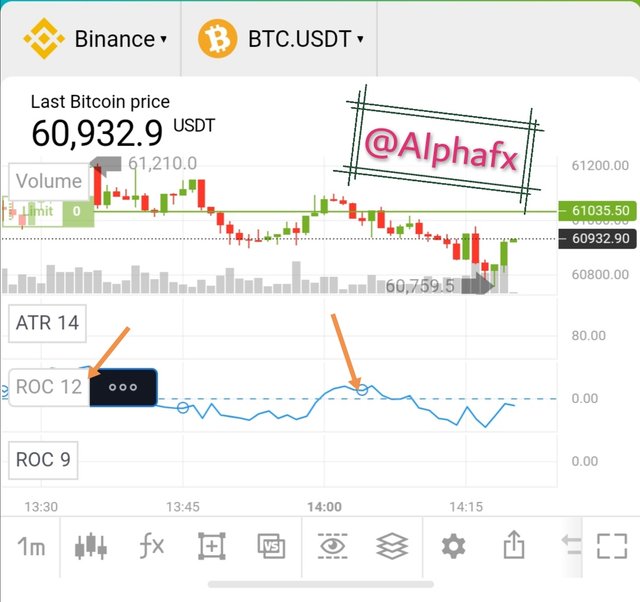
You will have to first modify the indicator in a way that it will be clear and its zero line, apparent.
Regarding the period, the best setting is the setting that works best for a trader as there are varing trading styles. There are different periods for different trading styles with the common ones being 12 and 25.
The indicator should be supported with other technical analysis tools for more efficient results.
QUESTION 3
What is the ROC trend confirmation strategy? And what are the signals that detect a trend reversal? (Screenshot required)
As we have already talked about, the ROC indicator is used in calculating the percentage change in price of an asset within a given period. When this percentage change is positive, it indicates an uptrend and when it is negative, it indicates a downtrend.
The ROC trend confirmation strategy is bascially identified by the mid point.
When the ROC indicator trends above the mid point of zero, it shows that the asset is uptrending and when it trends below it, it shows a downtrend.
ROC Indicator above the mid point indicating and uptrend
Source
ROC Indicator below the mid point of zero which confirmes a downtrend
Source
TREND REVERSAL
The ROC indicator gives signal for trend reversal through indicating oversold and overbought region, crossovers and divergence.
When price is at the ovebought region, it is an indication that buyers has a very high tendency to start selling which in turn will reverse price movement. Same thing happens when the price is at the oversold region but in the opposite way.
When ROC trend crosses over or below the mid point, it is an indication of possible total trend reversal.
Divergence occurs when the ROC indicator is trending in a direction opposite that of the price chart. This indicates that the price trend is weak and is prone to a possible reversal.
QUESTION 4
What is the indicator’s role in determining buy and sell decicions and identifying signals of overbought and oversold؟(screenshot required)
The ROC indicator plays a major role in determining buy and sell orders.
The mid point which serves as a balance between uptrend and downtrend helps in identifying when a price has gone bullish or bearish by the ROC indicator trending above or below it respectively.
When the ROC indicator moves straight above the mid point, it indicates a buy signal.
When the ROC indicator moves straight below the mid point, it signals a trader to take a sell position
DIVERGENCE
Here I will be using a spread of -0.5/+0.5 to identify my support and resistance zones respectively
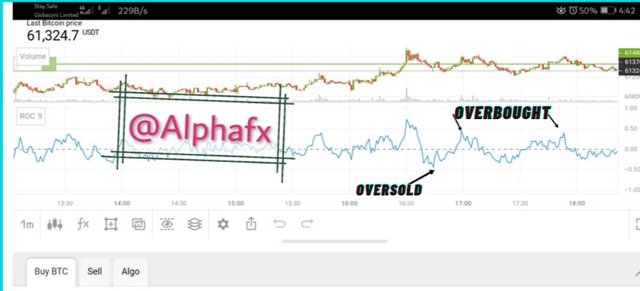
Once the ROC indicator is at the overbought region, it signals a possible trend reversal which in turn hints a trader to take a sell position.
The same thing happens when the ROC indicator is at the oversold region. It signals a trader to take a buy position due to a posible trend reversal.
QUESTION 5
How to trade with divergence between the ROC and the price line? Does this trading strategy produce false signals?(screenshot required)
Divergence occurs when the price chart is moving against the indicator.
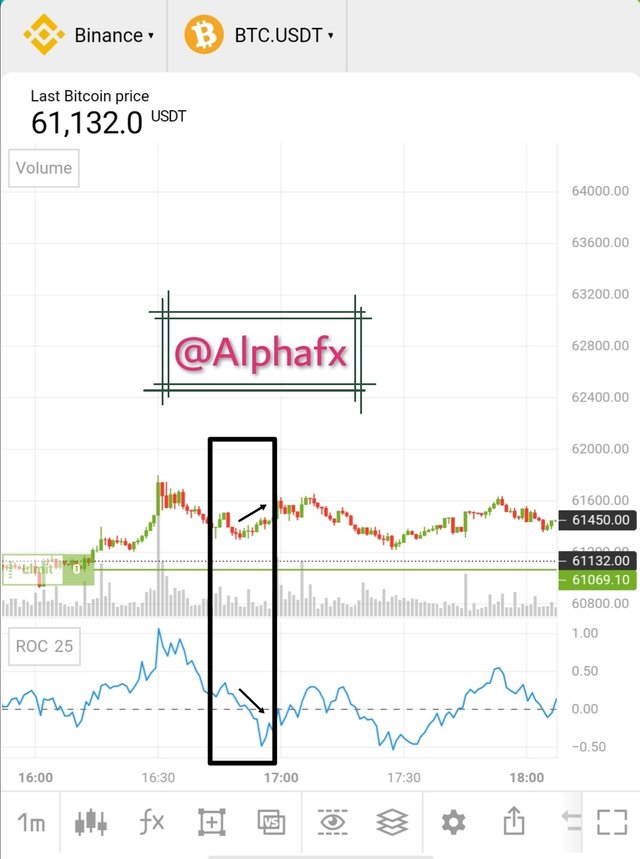
Trading with divergence using ROC indicator is a means of identifying false signals.
When their is a divergence, it means that the current price trend which is trending against the indicator is a weak one and is prone to a possible reversal.
Therefore a trader is expected to take a position against the trend or best wait for a breakout before entering the market.
DOES THIS TRADING STRATEGY PROVIDE FALSE SIGNAL
No indicator is 100 percent accurate at all times and that is why it is best to use more than one technical analysis tool during trading.
The said false signal given by the ROC indicator on the screenshot above is justified by divergence.
Divergence can simply be regarded as the justification for false signals for the fact that it gives reason on why a price chart is moving against an indicator and this reason being that the price trend which is moving against an indicator is a weak one. In other words, a divergence can be regarded as a false signal filter.
QUESTION 6
How to Identify and Confirm Breakouts using ROC indicator?(screenshot required)
A breakout occurs when a price breaks above a resistance or a support zone usually identified by a trendline
A breakout is an indication of a very high momentum in the market and with ROC being a momentum based indicator, it will be useful in identifying breakouts.
The ROC indicator trends closely at its midpoint and a sharp movement on either side identifies a breakout.
- Let me show what I mean using a price chart.
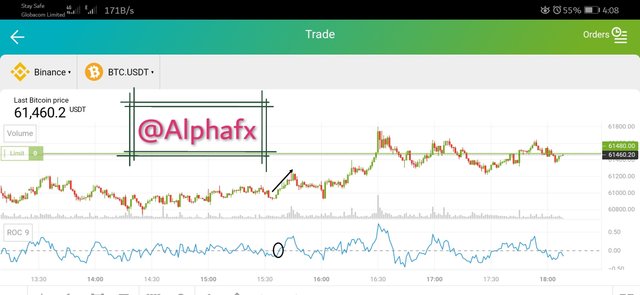
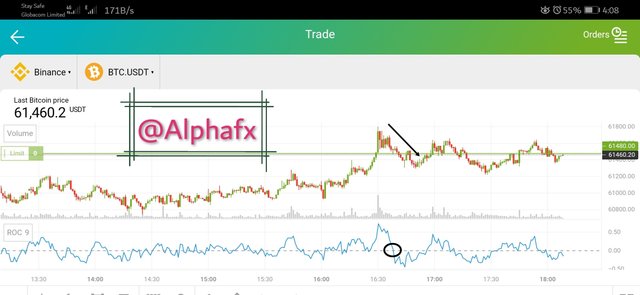
Bearish breakout
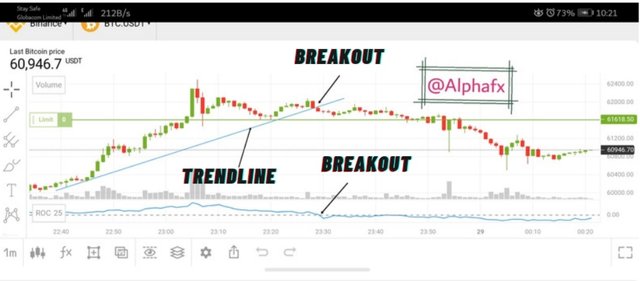
Looking at the above chat, we will see how the ROC indicator made a sharp drop from its mid point at the point identified as a breakout with a corresponding breakout on the price chart.
After the above breakout, the formal uptrend movement, turned bearish just as seen on the chart above.
QUESTION 7
Review the chart of any crypto pair and present the various signals giving by ROC trading strategy. (Screenshot required)
In other to more efficiently analyze the market, a trader is adviced to not just depend on one indicator but rather combine it with other indicators for more accurate analysis.
In combing indicators, it is also important not to add much indicators on one chart in other to avoid complications.
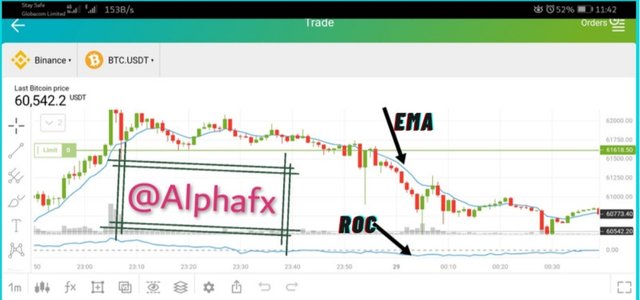
I will be combing the ROC indicator with the EMA indicator in other to accurately verify the trend movement.
The EMA is a trend indicator which shows the actual trend direction by filtering out minor fluctuations in price movement.
Combining the EMA with the ROC will help in easily identifying the trend direction. If the EMA trends above the price chart, it shows a downtrend and if it trends below the price chart, it shows an uptrend.
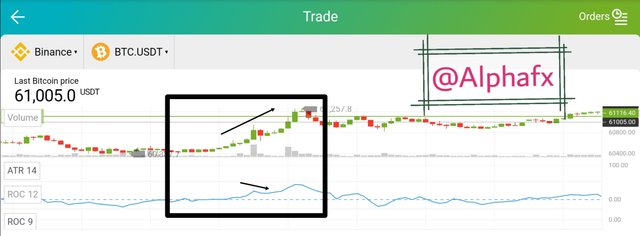
- BULLISH SIGNAL
The ROC in combination with the EMA can easily give a buy signal. When the ROC indicator crosses above its mid point, it signals an uptrend and with the EMA trending below the price chart, that is more like a confirmatory signal.
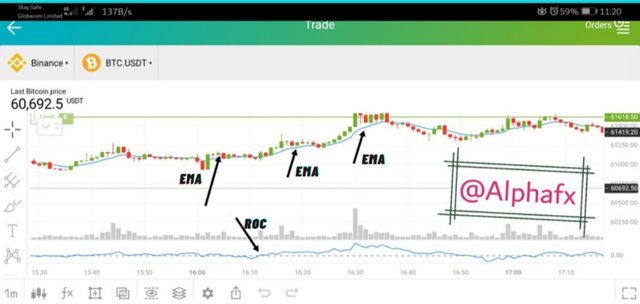
Uptrend
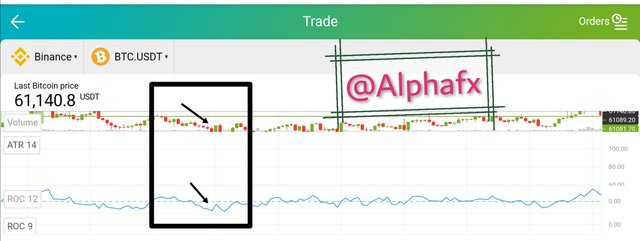
- BEARISH SIGNAL
Similar to bullish signal but opposite. The ROC indentifies a bearish trend by crossing below the mid point. The EMA serving as a comfirmatory indicator trends above the price chart which also indicates a downward trend.
Downtrend
- BREAKOUT SIGNAL
The ROC also confirms a breakout by spiking through the mid point. For a bullish breakout, it spikes down and for a bearish breakout, it spikes up. The EMA in turn changes trend direction by trending in correspondent to the breakout direction made by the ROC.
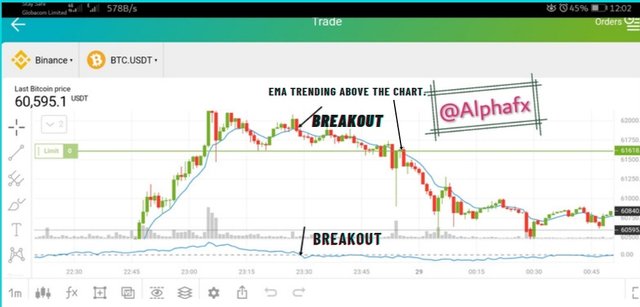
Breakout
- OVERBOUGHT AND OVERSOLD SIGNAL
The ROC also signals a trader on when asset is being overbought or oversold which is an indication of a possible price reversal.
Spread of +0.5/-0.5
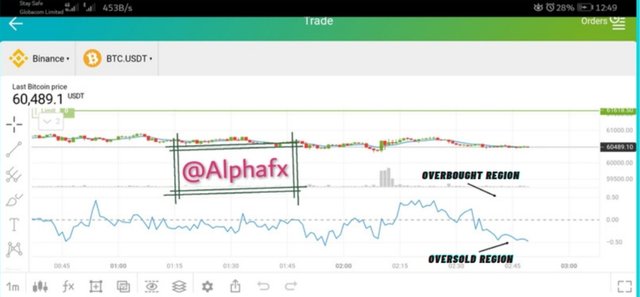
Looking at the chart above, the ROC is already at the oversold region which signals a possible price reversal.
CONCLUSION
The ROC indicator is a momentum based indicator which provides various important signals for a trader. This signals include trend continuation, breakouts, overbought and oversold, etc.
As always, It is always advisable to combine this indicator with other technical analysis tool in other to maximize profit and minimize loss, the market is multidimensional and no indicator looks at it objectively from all angles, inclusion is key to success.
Special regards to professor @kouba01 for this wonderful lecture.
Hello @alphafx,
Thank you for participating in the 8th Week Crypto Course in its 4th season and for your efforts to complete the suggested tasks, you deserve a Total|6/10 rating, according to the following scale:
My review :
A work with acceptable content in which you generally focused more on commenting on charts than on analysis.
Thanks again for your effort, and we look forward to reading your next work.
Sincerely,@kouba01