Steemit Crypto Academy | Market Patterns and Blockchain Projects | Homework task for @imagen
Hello Steemians !!
Today I'm going to make my Steemit Crypto Academy Homework task by professor @imagen Lesson that talking about Market Patterns and Blockchain Projects. A new and good lesson for me. I will try to discuss it, i hope my knowledge is more developed about that.
Investment
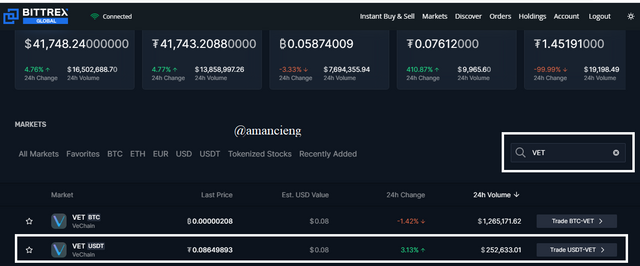
I will invest in VeChain (VET) coin. I use the Bittrex exchange. The transaction process is as follows:
In the market section type VeChain (VET) coin in the search field. I chose the VET/USDT pair.
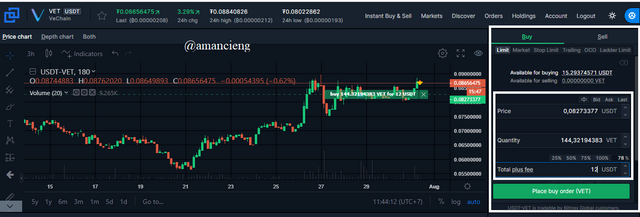
There are Buy and Sell options. Here I select the buy option and fill in the amount of 12 USDT as investment. I fill in the limit price amount and the amount of VeChain (VET) coins I will get will appear. Then place buy orders (VET).
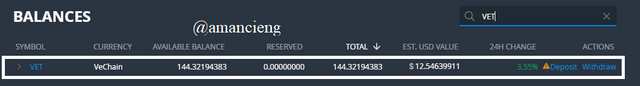
The purchase of the VET/USDT coin pair has been successful. Purchase details can be seen in the balances section.
Reason
The reason I invest in VeChain (VET) coin is because this coin has excellent functions and features in tracking a product that has been produced by certain companies engaged in the car and property industry. This is intended to help prevent fraud or imitation which is very vulnerable to occur in the real world. The presence of this coin has made cryptocurrency increasingly known and needed by many parties.
This coin will prove to the public that a product is genuine or fake. This platform can process and process large amounts of transactions and data so it is very feasible to use, especially in running a business. In the business world, the use of this coin has a very positive impact on the companies that work together. This can make the company grow and have an efficient system. This is sure to make this coin grow even more.
Market Capitalization and Ranking
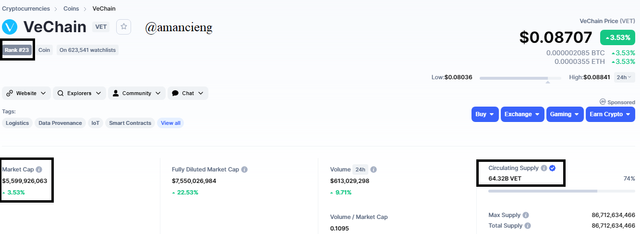
Market cap is the sum of the VeChain (VET) coin prices which refers to the overall price of the crypto company's shares expressed in USD. Market capitalization is constantly changing over time due to price volatility in the cryptocurrency market. Based on data from CoinMarketCap so far, the market cap of VeChain Coin (VET) is $5,599,926,063. This amount is obtained by multiplying the current price by the amount of supply in circulation. Where the current price is $0.08707 and the circulating supply is $64.32B.
VeChain Coin (VET) is ranked 23 in the cryptocurrency market list to date. This shows that this coin is a coin that has a high potential to compete with other coins in the market. The market capitalization and ranking this coin indicates to investors and traders that this coin is very suitable for long-term investment. The market capitalization and ranking of a coin is bound to change over time. Fundamental analysis is needed to make good and profitable investments.
Founder

The image above is a group of people who founded and developed the VeChain (VET) coin. These are the people who play an important role and have a great influence on everything that is related to this coin. Their work and responsibilities are enormous. Their skills and experience in the cryptocurrency world are unquestionable. They continue to oversee the VeChainThor blockchain functional committee and stakeholders. They are the main factors that make VeChain's growth, stability and lifespan higher quality. Good and effective management is their vision and mission.
Roadmap

The picture above is a roadmap for the VeChain (VET) project which started running in 2017. The issuance of VeThor and its economic model is the first step in the presence of this coin in the cryptocurrency ecosystem. Then their second step was run in 2018. They launched the VeChainThor blockchain and VeChain wallet after hard work on building this project. Then they took the third step in 2019. They expanded the VeCHainThor ecosystem to be better known and developed in the cryptocurrency market. The change in the name of VEN to VET is proof that they have succeeded in improving the quality of the coin by migrating from the ethereum blockchain to its own blockchain.
Objective of the Project
The presence of VeChain (VET) coin in the cryptocurrency world has improved the quality of the economy and business run by investors, traders and companies. The functions, features, characteristics and goals of this coin are very helpful for many parties in the process of tracking a product, indicating the authenticity or counterfeit of a product, guaranteeing the product, supply chain transparency, low transaction costs, security, and others. This has a very positive impact on anyone who uses and invests in this coin. This coin is also believed to continue to grow because of its high potential and use.
Evening Star Pattern
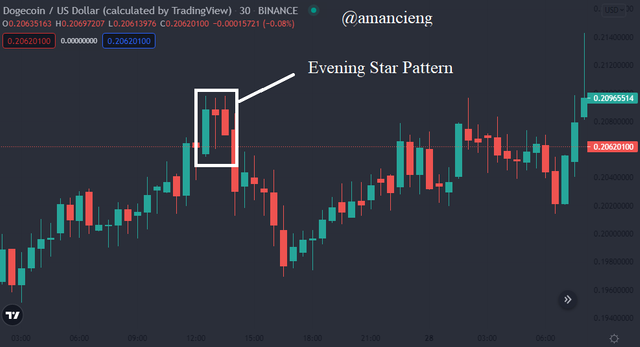
Evening Star Pattern is a type of candlestick that can be seen and analyzed on the chart of a crypto coin. This pattern indicates an imminent price reversal signal. This pattern occurs when the price changes from a bullish phase to a bearish phase. Traders usually call it a bearish reversal pattern. This is evidenced in the picture above which shows the bullish candlestick no longer continues. Then the small candlestick rose slightly indicating a price reversal signal. Then a bearish candlestick proves a bullish to bearish phase change. The hit rate of this pattern is 72% on the success rate.
This type of pattern can be identified by looking at three candlesticks:
- A long bullish green candlestick indicating the price is rising.
- Small green or red Doji candlestick which indicates an imminent price reversal.
- A long bearish red candlestick that is at least 50% of the length of the first candlestick indicating the price is falling.
Bullish Abandoned Baby Pattern
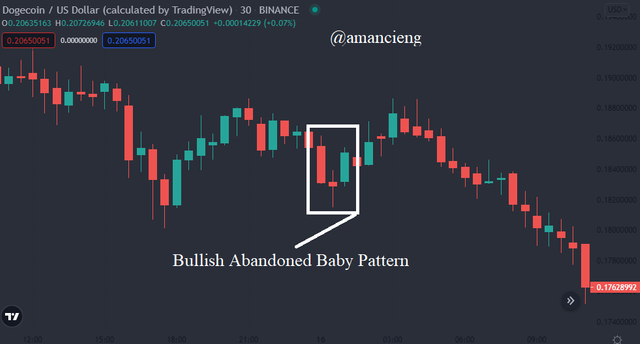
Bullish Abandoned Baby Pattern is a type of candlestick that can be viewed and analyzed on a crypto coin chart. This pattern indicates an imminent price reversal signal. This pattern occurs when the price changes from a bearish phase to a bullish phase. Traders usually call it a bullish reversal pattern. This is evidenced in the picture above which shows the bearish candlestick is no longer continuing. Then a small candlestick goes down slightly indicating a price reversal signal. Then a bullish candlestick proves a bearish to bullish phase change. The hit rate of this pattern is 65% on the success rate.
This type of pattern can be identified by looking at three candlesticks:
- Long bearish red candlestick indicating the price is falling.
- A small green or red Doji candle that is located below the first candlestick and has a gap indicating an imminent price reversal.
- A long bullish green candlestick located above the Doji candlestick indicating the price is rising.
Bearish Abandoned Baby Pattern
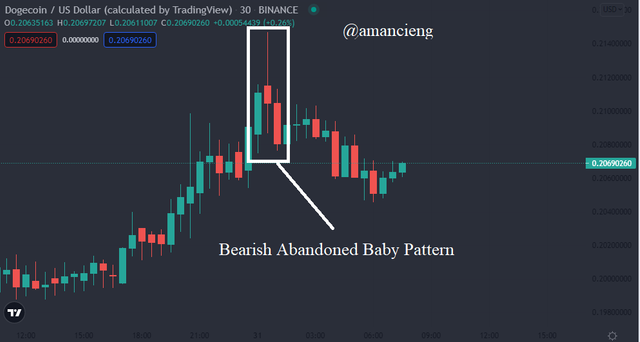
Bearish Abandoned Baby Pattern is a type of candlestick that can be viewed and analyzed on a crypto coin chart. This pattern indicates an imminent price reversal signal. This pattern occurs when the price changes from a bullish phase to a bearish phase. Traders usually call it a bearish reversal pattern. This is evidenced in the picture above which shows the bullish candlestick is no longer continuing. Then a small candlestick rose slightly indicating a price reversal signal. Then a bearish candlestick proves a bullish to bearish phase change. The hit rate of this pattern is 65% on the success rate.
This type of pattern can be identified by looking at three candlesticks:
- A long bullish green candlestick indicating the price is rising.
- A small green or red Doji candle that is located above the first candlestick and has a gap indicating an imminent price reversal.
- A long bearish red candlestick located below the Doji candlestick indicating the price is falling.
Analysis for 3 Days BTC/USDT
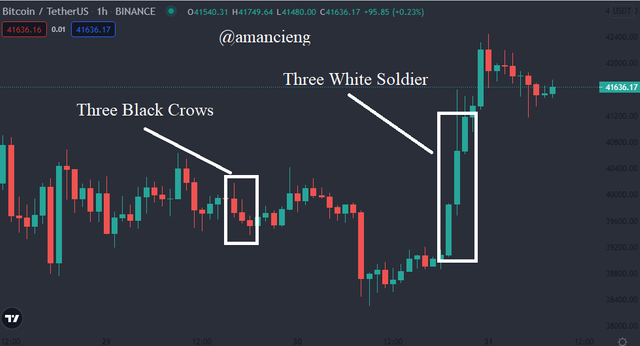
There are several identifiable patterns in the last 3 days on the chart of the BTC/USDT crypto pair as follows:
- Three Black Crows Pattern
Based on the chart above, 3 continuous red bearish candlesticks indicate a significant decrease in the price of BTC/USDT. This indicates a bearish price reversal in the market. - Three White Soldiers Pattern
Based on the chart above, 3 continuous green bullish candlesticks indicate a significant increase in the price of BTC/USDT. This indicates a bullish price reversal in the market.
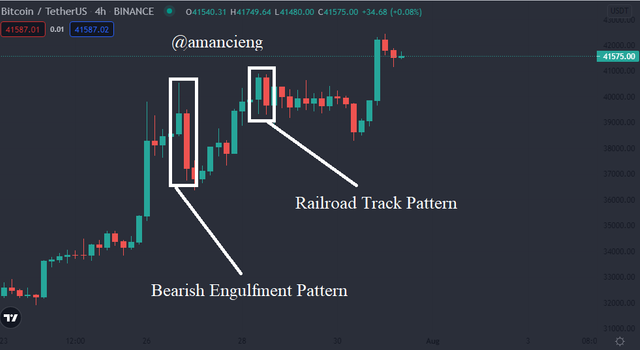
Analysis for 7 Days BTC/USDT
There are several identifiable patterns in the last 7 days on the chart of the BTC/USDT crypto pair as follows:
- Bearish Engulfment Pattern
Based on the chart above, the last green bullish candlestick was swallowed up by the next red bearish candle. This shows a reversal in the price of BTC/USDT which initially rose and then decreased. - Railroad Track Pattern
Based on the chart above, the green bullish candlestick is the same length as the red bearish candlestick. These are two candlesticks shaped like railroad tracks. This indicates the possibility of a BTC/USDT price reversal from bullish to bearish and vice versa.
Conclusion
In order to make and run a good investment in the cryptocurrency world, it is necessary to get to know and analyze a coin beforehand. There are many factors that can be investigated and studied such as technical and fundamental analysis, whitepapers, projects, and others. Furthermore, understanding and experience of the types of candlestick patterns on the chart of a coin are also very helpful for determining when to buy or sell a coin. All that concerns the factors that affect the cryptocurrency market is key in investing.
Gracias por participar en la Tercera Temporada de la Steemit Crypto Academy.
Felicitaciones, realizastes un gran trabajo.
Continua esforzandote y espero seguir corrigiendo tus asignaciones.