Crypto Academy Season 3 Week 8. Homework Post for @asaj
In your own words define the random index and explain how it is calculated
Is the random index reliable? Explain
How is the random index added to a chart and what are the recommended parameters? (Screenshot required)
Differences between KDJ, ADX, and ATR
Use the signals of the random index to buy and sell any two cryptocurrencies. (Screenshot required)
Introduction
Each crypto index is grouped together and consists of password currencies that are weighted supported market capitalisation (market capitalization).
The market capitalisation of currency is calculated by multiplying the amount of units of an asset by the market price of dollars on the market currently.
In your own words define the random index and explain how it is calculated

The Random Index is a tecnical analysis indicator comparing an asset's price movements to the random moves in order to show significance of a trend statistically. It's also known as the KDJ indicator and is used to scrutinize and predict changes available prices and price patterns of various trading assets.
The KDJ index is additionally a very practical technical indicator mostly utilized in short-term stock exchange analysis . KDJ may be a sort of a Strike Cassik Indicator, with the sole difference being that there's an additional line called the 'J line' where the values on the front and back and a light lines indicate whether the stock is just too sold (over 80) or oversold (less than 20) and the instant %K crosses chances are the instant of sell or buy.
The J line hereby represents the divergence of a value since a long time ago or over a long period. The worth of 'J 'can exceed 0, 100 on the front and back and the light lines of a chart.
How it is calculated.
The KDJ index consists of three curves or lines in terms of The moving speed; that's the fastest curve (and is that the J line), followed by the K line, and thereafter the slowest, that is the D line in other words, in terms of value, they may be referred to as, the K value, D value and J value where K and D values range between 0 and 100, and the J value ranges between 0 and 120 and represents a divergent of D value from K value. It is from these lines that the name KDJ comes. When these lines converge they tend to show some trading upheavals coming.
Mathematically speaking, the intervals of the KDJ index are often mainly divided into three parts i.e overbought, oversold or wandering areas. The overbought and oversold levels go hand in hand with the number of times the trend may change.
Levels by default are set at 20, and 80 percent flexibly readjusting in case of need for more sensitivity or to lower false alerts. Of those, the 20% areas are overbought, 80% areas are oversold. The area between 20 and 80 is the balance of trade area.
If the values of K, D j are greater than 50, it's an extended market and therefore the futures exchange is bullish. If the values of K and D j are both below 50, then it's a brief market and therefore the futures exchange is brief .
The KDJ index graph has rock bottom sensitivity with the slowest D curve. The K curve is followed by the J curve being the foremost sensitive.
If J is bigger than K and K is bigger than D, then the three index curves are placed during a long position, indicating that the market may be a long market. When the three lights cross with money, the indicator sends a buy signal.
If the three exponential curves are during a short position, it means the short-term trend is down. If the three curves are a dead cross, the indicator signals a sell.
If the KD line repeatedly causes a cross brake and rises and falls near the 50th line, it means the market is organized. At this point , investment behavior must be determined by observing the dynamic relationship between the J value and therefore the KD deviation
Is the random index reliable?
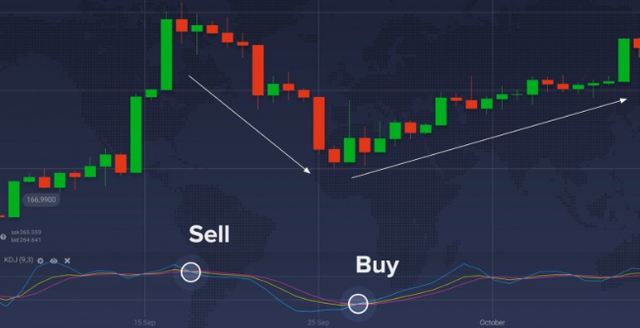
When handling KDJ, there are two sorts of signals that you simply want to receive.
• When the blue line is above the yellow line and the yellow line is above the purple line and the three lines converge, you'll consider selling the asset.
• The reverse is additionally true. With the blue line above the yellow line and therefore the yellow line above the purple line, when the curve converges to any level below , you'll consider buying an asset.
For best results, KDJ are often utilized in combination with other indicators like ADX (Average Directional Index) and ATR (Average True Range). The electrons are always before the curve, which may suggest a future trend reversal. The latter can determine market volatility, which is particularly useful as KDJ isn't working within the flat market.
Indeed this is often not an indicator which will offer you an accurate signal 100% of the time. Sometimes even the simplest one can fail and leaves you a losing deal. Whatever indicators you believe, one must remember to follow basic risk management and capital allocation rules.
The KDJ indicator, also referred to as a probabilistic indicator, may be a very practical technical analysis indicator. It mainly predicts the price trend through the form of three curves K, D, and J. The name 'probabilistic' may thus show that it's dependable on many factors, but can be reliable to certain extent.
Initially preferred to analyze the futures exchange, this indicator gradually matured and was accredited within the gold market and was widely used to analyze medium- and short-term trends within the gold market.
It's the foremost commonly used technical analysis tool within the gold market supported by the principle of statistics.
The KDJ index is calculated by taking a selected period of time , recording the very best , lowest and shutting prices of that period, and analyzing and calculating the short period supported the proportional relationship. Therefore the K, D, and J values connect their values with a curve to make three independent curves. This set of curves may be a good predictor of future trends in gold prices. The KDJ metric calculation uses the very best , lowest and shutting prices for a specific period because the basic data for calculating the K, D and J values. The K, D and J values form a group of coordinates at the indicator Point, and therefore the connection of those points forms an entire KDJ indicator which will reflect the trend of price fluctuations.
Curve trends are often easily and quickly found at the proper time for intervention. The probabilistic index KDJ was developed and supported by the KD index. The KD index doesn't allow investors to understand exactly when to shop for or sell, just by using the K and D values to research about trade trends. When you use KDJ, not only are you able to reflect the of KDJ quickly analyze trading points through the trends of K line, D line and J line, you leave no stone unturned. Its essence is an arbitrary concept of variation, so it are often accurate and it's easy to forecast short-term and medium-term price trends.
Gold fork and Dead fork with KDJ index
Various indicators include many sorts of gold forks and dead forks. The emergence of those two sorts of intersections generally indicates a change in gold price trends within the short term. Therefore, the intersection of the two is a crucial acquisition and sell signal for short-term operations.
KDJ indicator golden fork
When indicator line K intersects indicator line D from bottom to top, the KDJ indicator golden fork appears and a buyer signal is issued. If sales of but 20 golden forks occur too within the region, the buy signal are going to be stronger.
KDJ indicator dead fork
When indicator line K crosses indicator line D from top to bottom, a KDJ indicator dead fork is made and a sell signal is issued. The sell signals are going to be even stronger if a dead fork appears within the area of 80 or more.
Technical indicators form a golden fork and a dead fork, but often it suggests a reversal of gold prices. However, for security reasons, investors are advised to perform a comprehensive analysis of gold prices together with various indicators so as to realize stable returns.
KDJ currently determines valuation trends whereby it mainly combines the concepts of momentum, moving averages and therefore the benefits of strong exponents.
If the trade curve is reversed KDJ will assist you find the purpose where the trade is opposed. The details of KDJ are mainly that you simply can go with 80 points.
Be especially careful when the K value of KDJ is on the brink of a sign that's 80 or more. Shareholders will immediately eliminate any unknown elements. Since things is unknown, subsequent trend can't be judged. There's no risk of creating a profit beyond your own abilities. However, not all K values over 80 cannot hold a share and the best thing is to research about it.
You'll combine other indicators like moving average, MACD too. If the KDJ's K value is a smaller amount than or on the brink of 20, it is a signal that it's sold out too. But don't think it's safe to shop for now. you ought to know that the Chinese gold market has no bottom. The ground is less than the ground . Of course, you'll also compare it with other indicators.
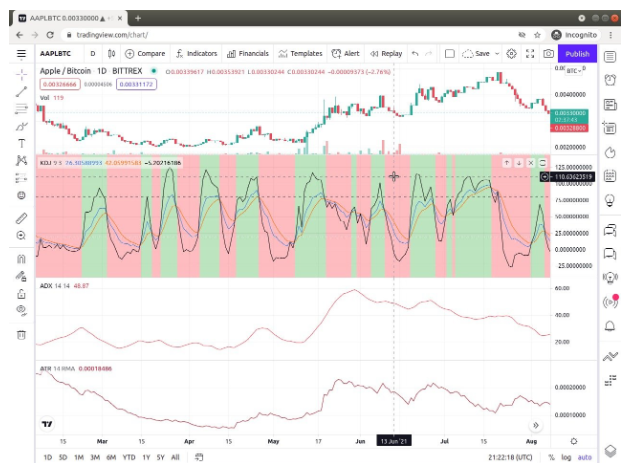
How is the random index added to a chart and what are the recommended parameters? (Screenshot required)
• Go to trading view website.
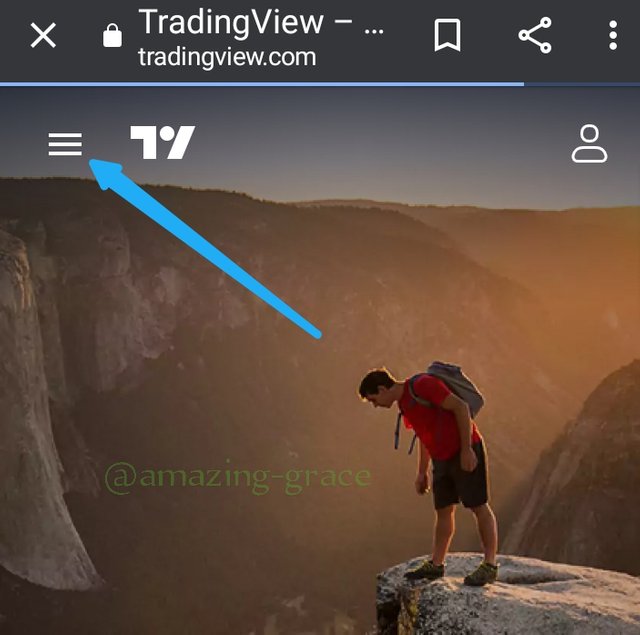
• Click on Chart, on the navigation bar of interface. It opens a chart for the default, select asset.
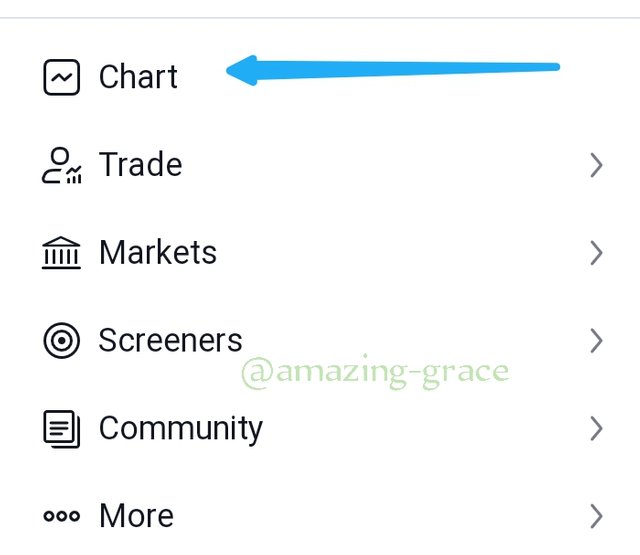
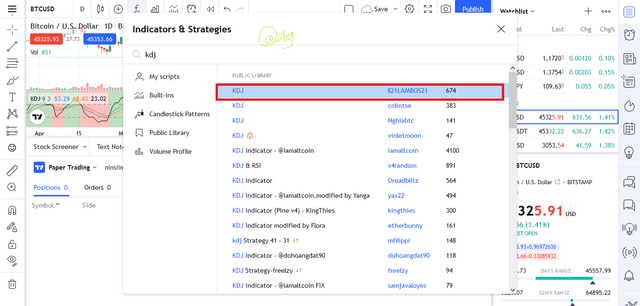
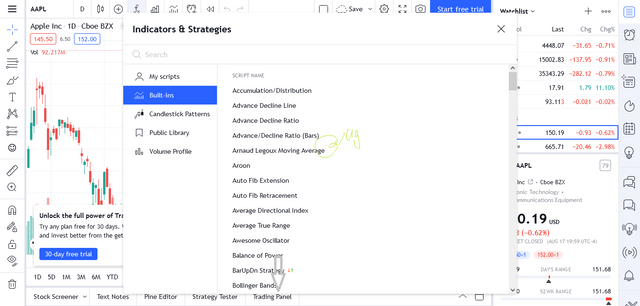
• Click on the Indicators and methods option on toolbar to access Indicators.
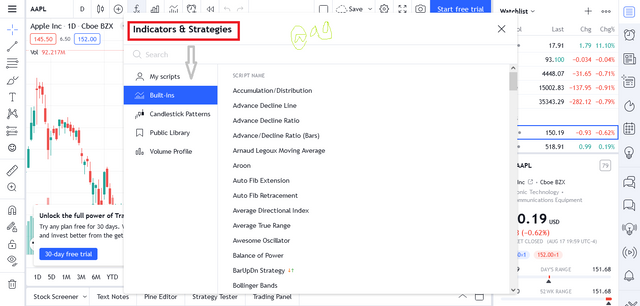
• The Indicators and methods option displays button for in-built indicators.
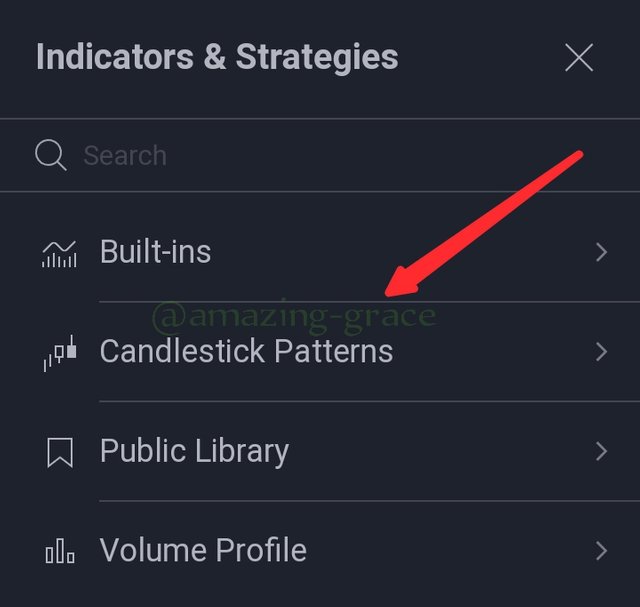
• Scroll to the K column on the KDJ Indicator.
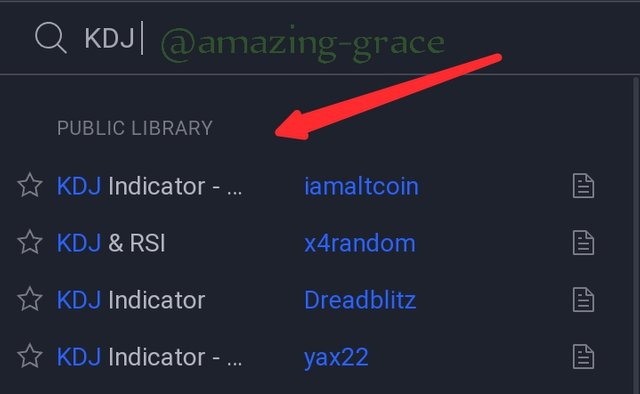
• The KDJ Indicator by ll21LAMBOS21 is the one selected.
Indicator parameters
Setting the KDJ index parameters is highly determined by investors different trading preferences where I investors practice trading to improve trade. Therefore it is necessary to always refer to the market environment and trends as well as individual stocks when you are trading as there is no absolute bad or good parameter.
They KDJ indicator is mainly got through the study of the inter-relationship between the highest, lowest, and closing price and this maximizes the advantages of the Market Direction and Moving Average. The default parameters of KDJ stock trading software are 9, 3 and 3 days.
Usually in the short term process the technical index parameters will be more inspirational but not to sensitive i.e if it is too sensitive, a more invalid technological way in reference signals will appear.
Some investors in the market can adjust the parameters to 6, 3 and 3 days when using the short term trading reference and as a result the index is more active in the short term.
The KDJ indicator has many optional parameters.
• K value index moving average type Period of smoothed% K prefer to D value indicator moving average sort of D value period Multiplier of%
• K and% D values for calculation of% J value Series type with% K,% D, and% J values. The subsequent code shows the way to create a KDJ index with EMA smoothing and%
• D value and SMA smoothing with a period of 10% K value and a period of 20.
There are three series that form the KDJ indicator, so each has its own method.
- % kSeries() in K circuit
- dSeries() within the D series
- % jSeries() within the J series.
You could change the series type at any time using the series Type() method. The concept of the KDJ indicator are often adjusted within the same way as the other indicators. It depends on the chosen series type. The subsequent example shows two plots using KDJ indicators with different parameters and visualization settings.
The difference between KDJ, ADX and ATR.
ADX
Trading within the direction of a robust trend can reduce risk and increase potential profits. The Average Directional Index (ADX) is employed to work out when prices are strong and trending. In many cases, it's the simplest trend indicator.
ADX is employed to quantify the strength of the trend. The ADX calculation is predicated on a Moving Average of price range expansion over a given period. Other terms are often used, but the default setting is that the 14 bar :1 ADX are often used with all trading means like stocks, investment trusts, exchange traded funds and gifts. ADX is displayed as one line with a low value of 0 and a high value of 100.
ADX is omnidirectional since it records the strength of a trend, whether the worth is trending upward or downward. Two indicators are usually drawn within the same window because the two Directional Movement Indicator (DMI) lines that ADX derives from (see below).
When the DMI exceeds the ADX, the worth is rising, and therefore the ADX measures the strength of the uptrend. When the ADX exceeds the DMI, the worth declines, and therefore the ADX measures the strength of the downtrend.
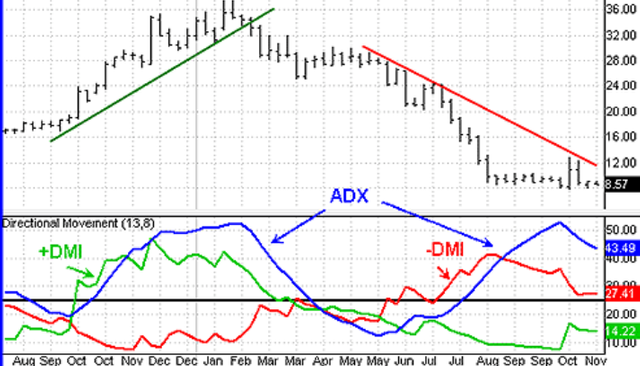
Like the other indicators, ADX should be useful for price analysis and potentially for filtering signals and controlling risk along side other indicators. Wilder's DMI (ADX) consists of three indicators that measure the strength and direction of a trend. The DMI (Direction Movement Index) consists of three lines: ADX (black line), DI (green line), and DI (red line).
The ADX (Average Directional Index) line shows the strength of the trend. the upper the ADX value, the stronger the tendency. The positive direction indicator (DI) and therefore the negative direction indicator (DI) indicate the present price direction. If DI exceeds DI, the present price trend is rising. If DI exceeds DI, the present price trend is declining.
The important point is that DMI may be a collection of indicators including DI, DI and ADX. Both DI and DI measure the up-and-down movement of the worth and therefore the crossover of this line are often used as a trading signal. ADX measures the strength of an up or down trend. Numbers above 25 show a robust tendency. Important takeaway DMI may be a collection of indicators including DI, DI and ADX. DI and DI all measure price
ATR
(Average True Range) may be a fluctuation index that shows how an asset behaves on the average during a given period. This indicator are often useful to ascertain when a date radar wants to open a trade and may be wont to determine stop-loss orders. the way to ride an enormous trend using the ATR indicator. Determine the ATR drainage used (3, 4, 5, etc.). If you're long, the viscosity minus the X ATR is that the trailing stop loss. If it's short, add X ATR at the low end and that is a trailing stop loss. it is also a useful indicator for long-term investors to watch , as if the ATR value is comparatively stable over an extended period of your time , you'll always anticipate when volatility will rise. the typical true range (ATR) is that the average of truth range over a given period of time .
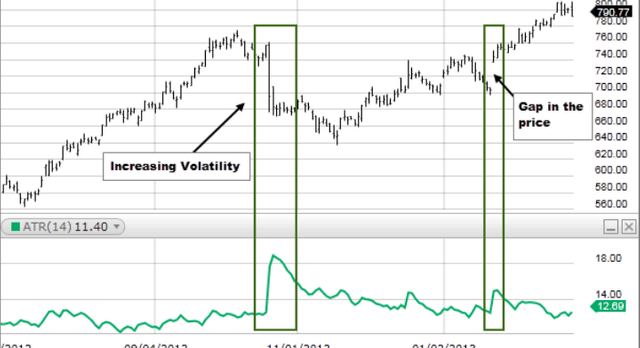
ATR measures volatility by taking under consideration differences in price movements. generally , the calculation of ATR is predicated on 14 hours per day, weekly or monthly during the day. generally , ATR (Average True Range) are often calculated on a daily, daily, weekly, or monthly basis supported 14 time periods. The primary TR value is just High minus Low, therefore the first 14-day ATR is that the average of the daily TR values for the last 14 days.
Notable differences
When a financial asset on the market features a high ATR value, it indicates high volatility, while a coffee ATR value signifies low asset volatility on the market. Seasoned traders use it to guide their exits and entrances into the market. Unlike KDJ, ATR doesn't show the direction of a stock or asset’s price on the market and it's primarily concerned with the volatile nature of the asset. Therefore, Average True Range values are equivocal when it involves trend prediction, and its computations are heavily hooked in to previous market data. ATR is graphically represented on the chart with one line.
Random Index as compared to the 2 indicators above is graphically represented by three lines. KDJ can signal possible breakouts or trends through the line's position within the 100 to 0 boundary. It forecasts a possible bullish trend when the lines fall below the 20 marks, which is characterized because the Oversold region. Alternatively, the movement of the curve above the 80 marks, also referred to as the Overbought level, foreshadows a possible bearish trend.
KDJ Indicator are often used to determine entry and exits points within the market. It, however, fails to supply an accurate signal in flat markets, thus when volatility is low. As a result, it's often utilized in conjunction with other indicators to render more accurate trading services.ur time . The respective ADX value of a trend denotes the momentum of its trend. Thus, An ADX value between 75 and 100 signifies an intensely strong trend, whereas a worth bounded between 0 and 25 indicates a seriously weak trend movement. Additionally, a trend engulfed between 25 to 50 and 50 to 75 features a strong and really strong trend respectively. The chart below shows all three indicators at once, side by side.
Use the signals of the random index to buy and sell any two cryptocurrencies. (Screenshot required)
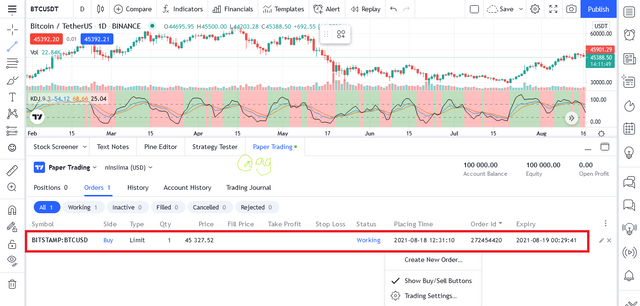
A. I will use the BTC/USD Chart first.
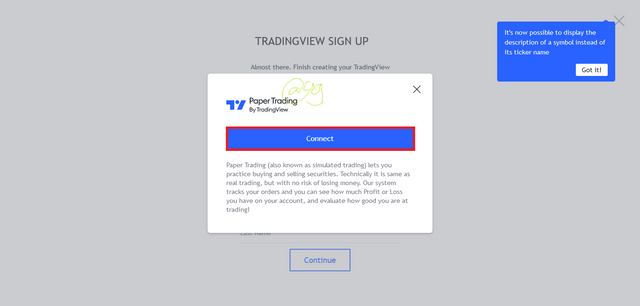
• I click on Trading Panel
• I then connect my account to Paper Trading
• I add the KDJ Indicator, open a new order to buyBTC/USD. J line is in oversold.
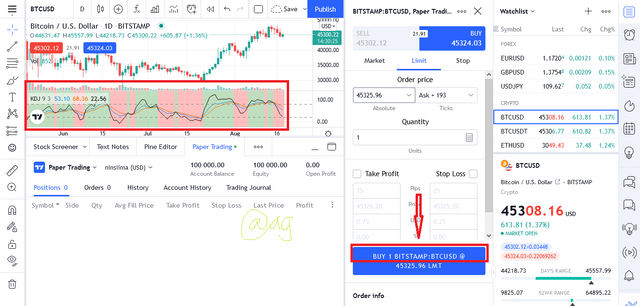
- My order was ready. It will take some waiting hereafter to make some profits.
B. I will also use Tron/USD.
• I observe that the %K and %D Line for the chart are Oversold. So I click Sell.
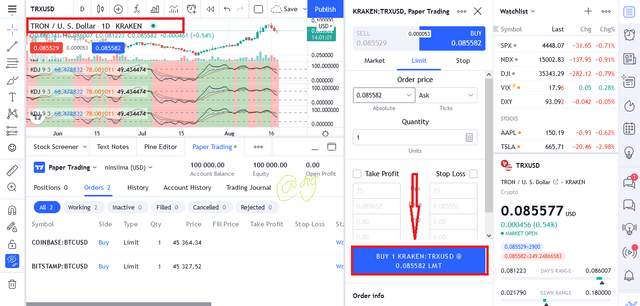
• My order is ready.
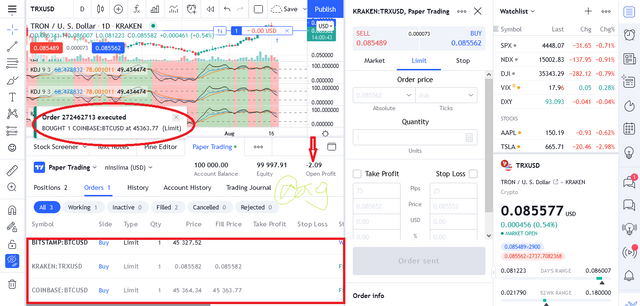
It will still take patience to make some profits.
Conclusion
To conclude my findings on this lesson by professor @asaj, i will say that the KDJ indicator is highly dependable and used alongside other indicators, can give traders better speculation for their trade. Therefore, i have learnt how to place orders using the indicator and as seen above, i managed to make a few profits. Thank you.
Good job @amazing-grace!
Thanks for performing the above task in the eighth week of Steemit Crypto Academy Season 3. The time and effort put into this work is appreciated. Hence, you have scored 7.5 out of 10. Here are the details:
Remarks
You have displayed a good understanding of the topic Amazing Grace. You have completed the assigned task. As a suggestion, do not use photos with an entity's watermark.
Alright prof. Thank you sir
You have been curated by @yohan2on, a country representative (Uganda). We are curating using the steemcurator04 curator account to support steemians in Africa.
Keep creating good content on Steemit.
Always follow @ steemitblog for updates on steemit