Crypto Academy Season 3 | Intermediate Course: Crypto Assets and the Random Index (KDJ)
The search for a reliable way to forecast asset prices has led to the creation of several technical indicators. Each succeeding indicator aiming to rectify the flaws of its predecessors. Unfortunately, due to how random price appears to move, it has been difficult to invent an indicator that is completely dependable.
Within the past few weeks, we have established the importance of conducting research before engaging in a trade. A vital part of that research includes technical analysis. And technical analyses are done with the help of technical indicators. This week, we will take a look at another technical indicator — the random index (KDJ).
Though not perfect, the random index seeks to answer the questions other indicators in its category can only dream of answering.
| Disclaimer: This article is not investment advice. The content of this write-up is made for educational purposes only. Analysis of historical price movements does not guarantee a future reoccurrence. Trade exercises are expected to be done on a demo account. |
We will cover the itemised points below, after which you will be required to perform some exercises in other to assess your understanding of the topic.
- What is the KDJ Indicator?
- How the Random Index Works
- How to Set Up the KDJ Indicator
- Signals of the Random Index
Also, the term 'KDJ indicator' will be used interchangeably with 'random index.' So here we go!
What is the KDJ Indicator?
KDJ indicator, also known as the random index, is a technical analysis tool that helps investors and traders to identify changes in price movements, trend reversals and good market entry and exit points. It is a relatively new indicator that is heavily inspired by the stochastic oscillator.
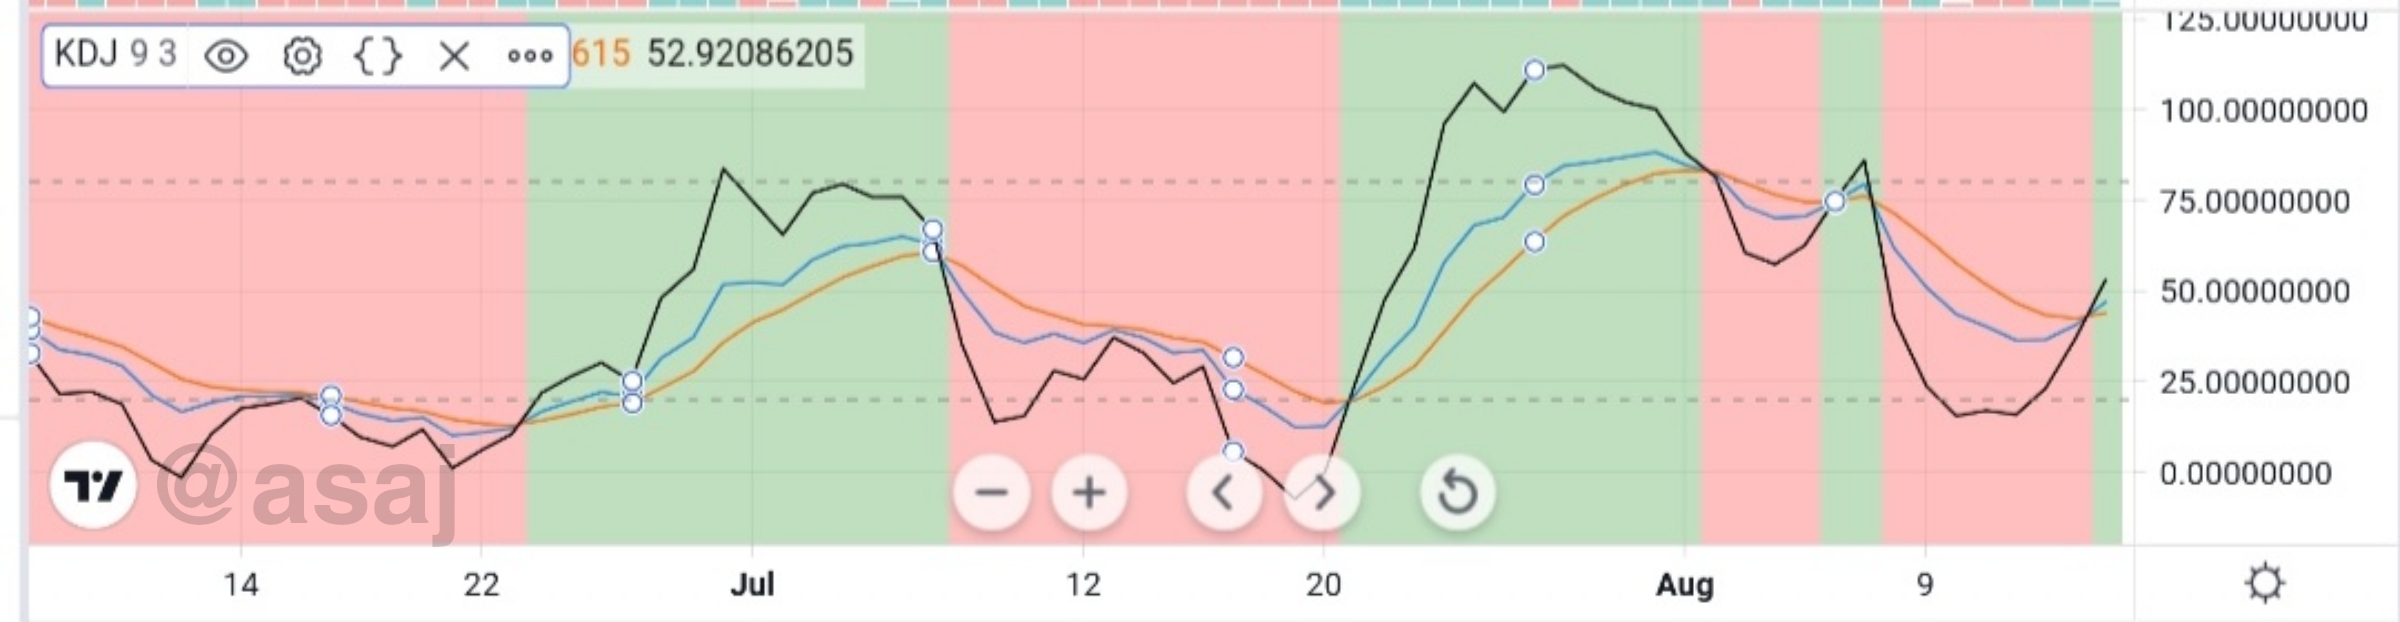
Fig. 1: The crossing of KDJ lines | tradingview.com
The random index has three lines, namely K-line, D-line, and J-line. Two of these lines are similar to the lines of the stochastic oscillator. Given their relationship, it is no surprise. Therefore, the addition of a third line, called the J-line, is what majorly differentiates the random index from the stochastic oscillator. The J-line depicts the divergence of the D-line from the K-line.
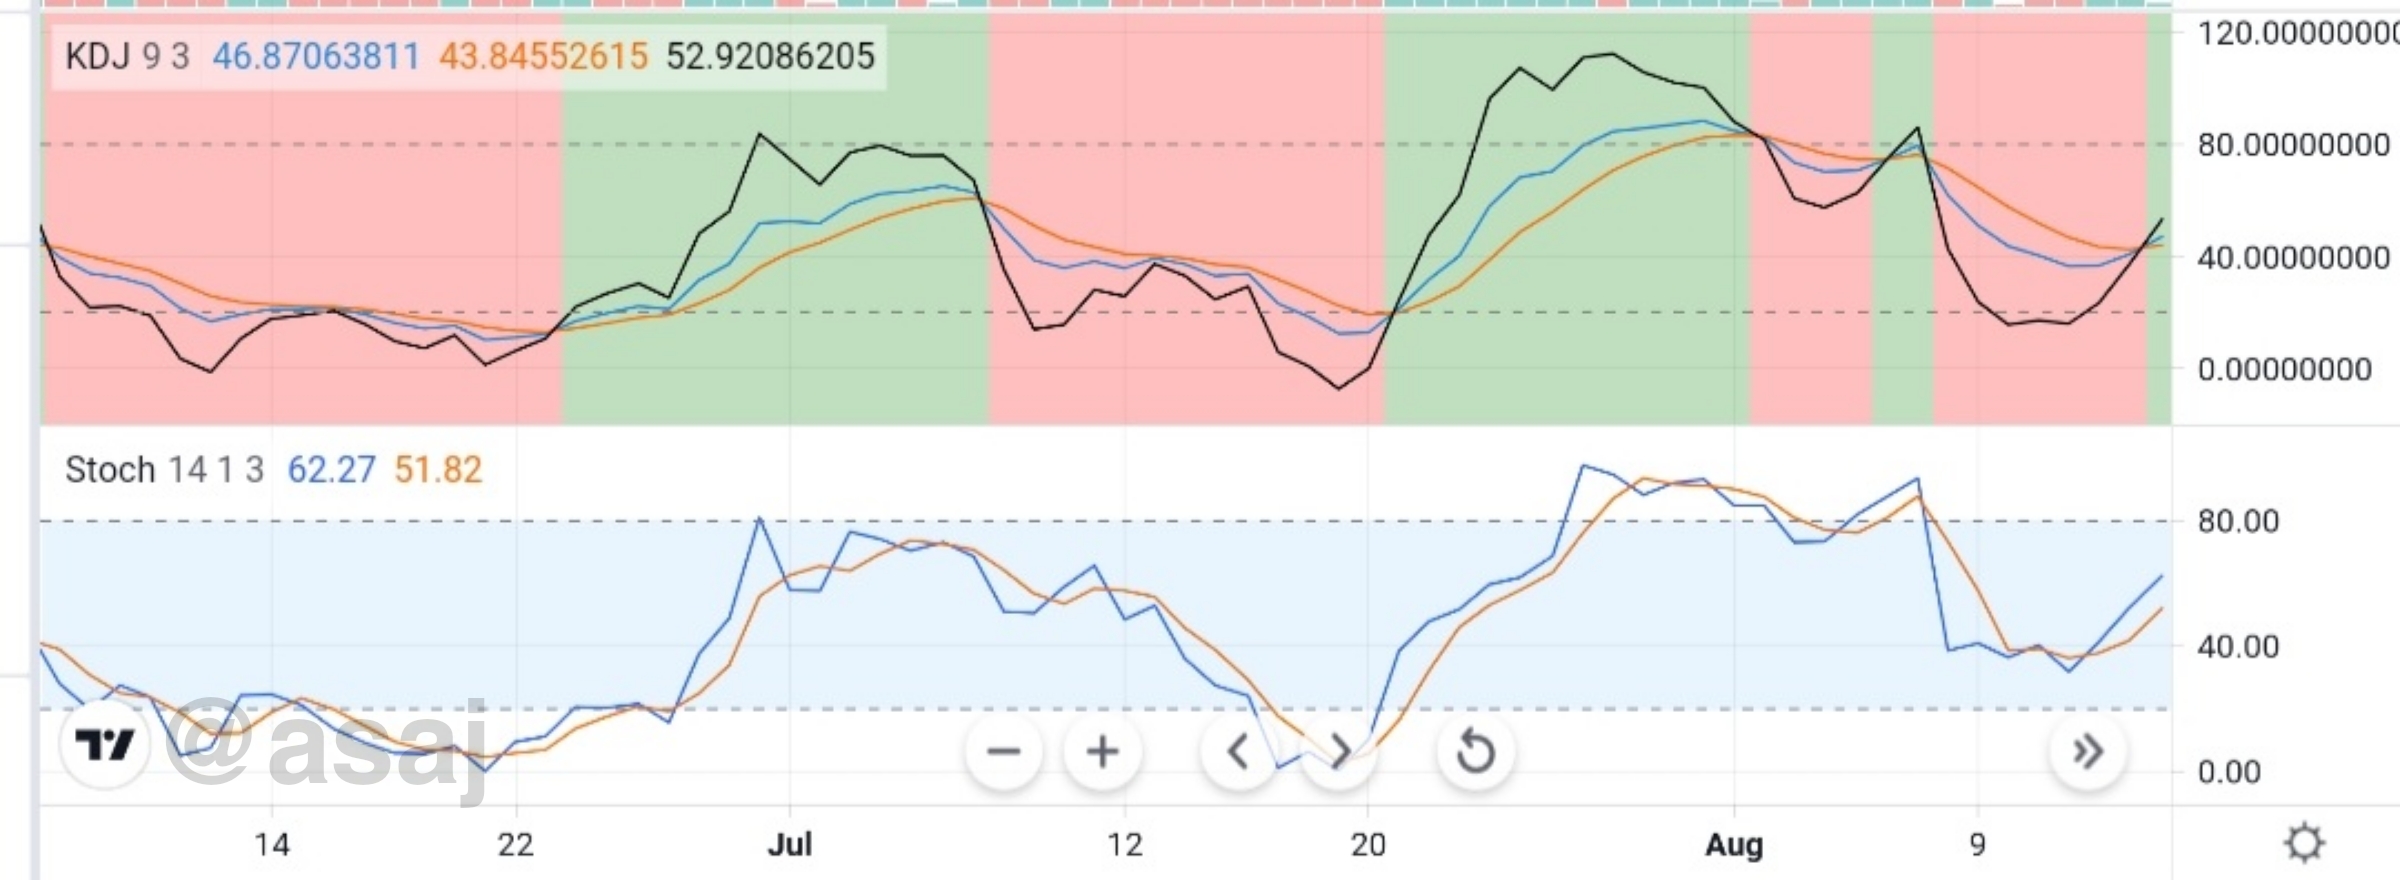
Fig. 2: The KDJ indicator and the stochastic oscillator | tradingview.com
Additionally, the KDJ indicator bears some resemblance with the alligator indicator. Like the commodity channel index, vortex indicator, stochastic oscillator, and alligator, the random index gives false signals in ranging markets as well as when the market is flat. These indicators are also not reliable in short timeframes chart analysis.
However, the strength of the random index is most conspicuous in trending markets.
How the Random Index Works
The random index got its alias, KDJ indicator, from the three lines present in the indicator. Whenever these three lines converge, in other words, when the three lines intercept or crossover it is often seen as a signal.
Like the CCI, RSI, and Stochastic Oscillator, the random index tells us when an asset is overbought or oversold by setting the levels at 70% and 30%. You can also set these extreme levels at 80% and 20%. So, when the lines are above 80% it means the crypto asset is overbought. Conversely, when the KDJ lines fall below 20% it represents an oversold asset.
Interestingly, the KDJ indicator goes beyond telling us when an asset is overbought or oversold. It also tells us the current trend of the market. When the market is experiencing an uptrend, the J-line often rallies above the K and D lines. However, when the market is trending downwards, the J-line rallies below the K and D lines.
And as mentioned earlier, the interception of these lines constitutes a signal for most traders.
How to Set Up the KDJ Indicator
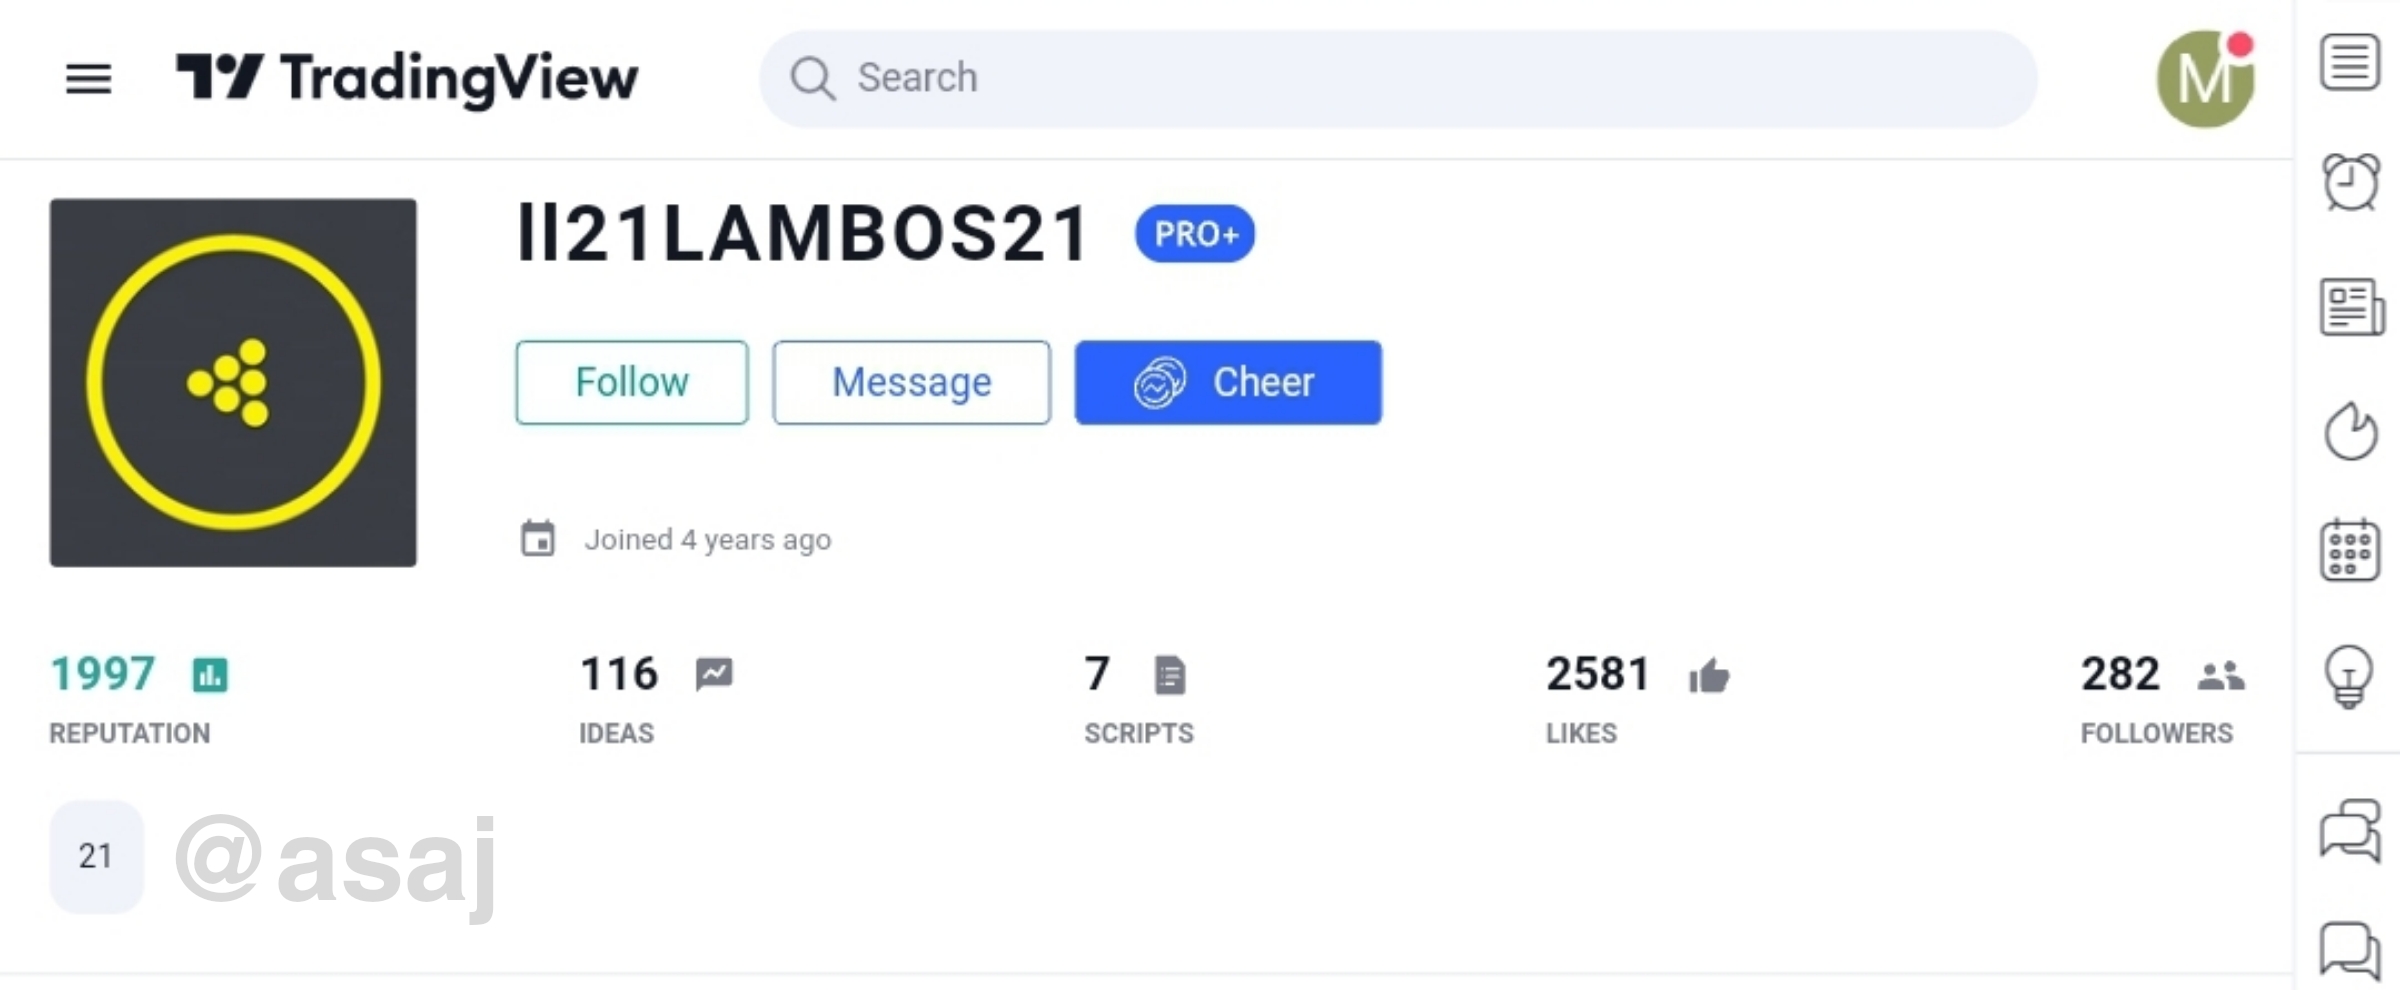
The KDJ indicator used in this article was configured by ll21LAMBOS21, a pro user on tradingview.com with almost two thousand reputation scores. This KDJ indicator has additional features that include the background colours which indicate the current trend of the market.
- Green background represents an uptrend
- Red background represents a downtrend
Follow the step below to add the modified KDJ indicator to a crypto chart on tradingview.com.
Go to tradingview.com
Launch a chart on the website
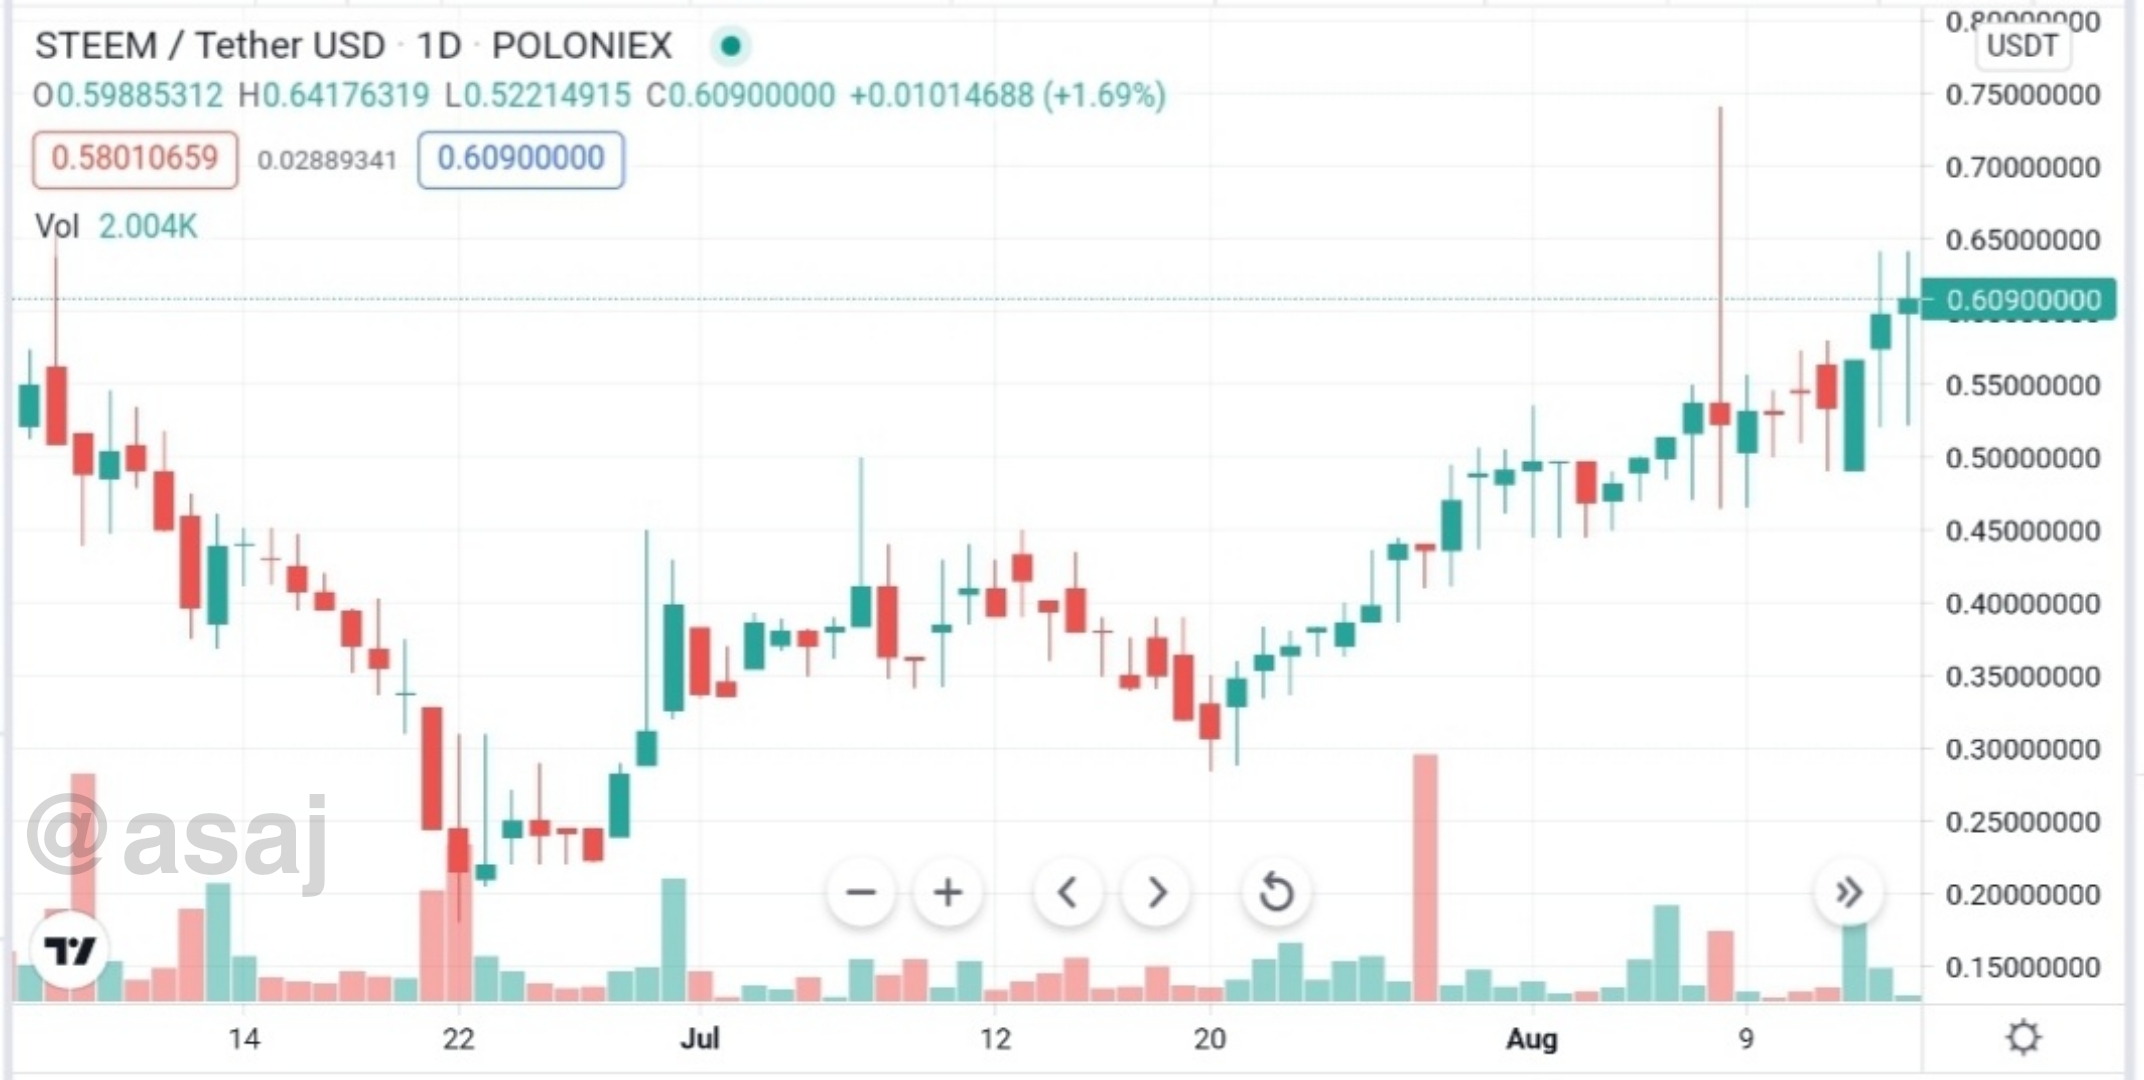
Fig. 3: STEEMUSDT pair | tradingview.com
- Click on [indicators] on the top menu
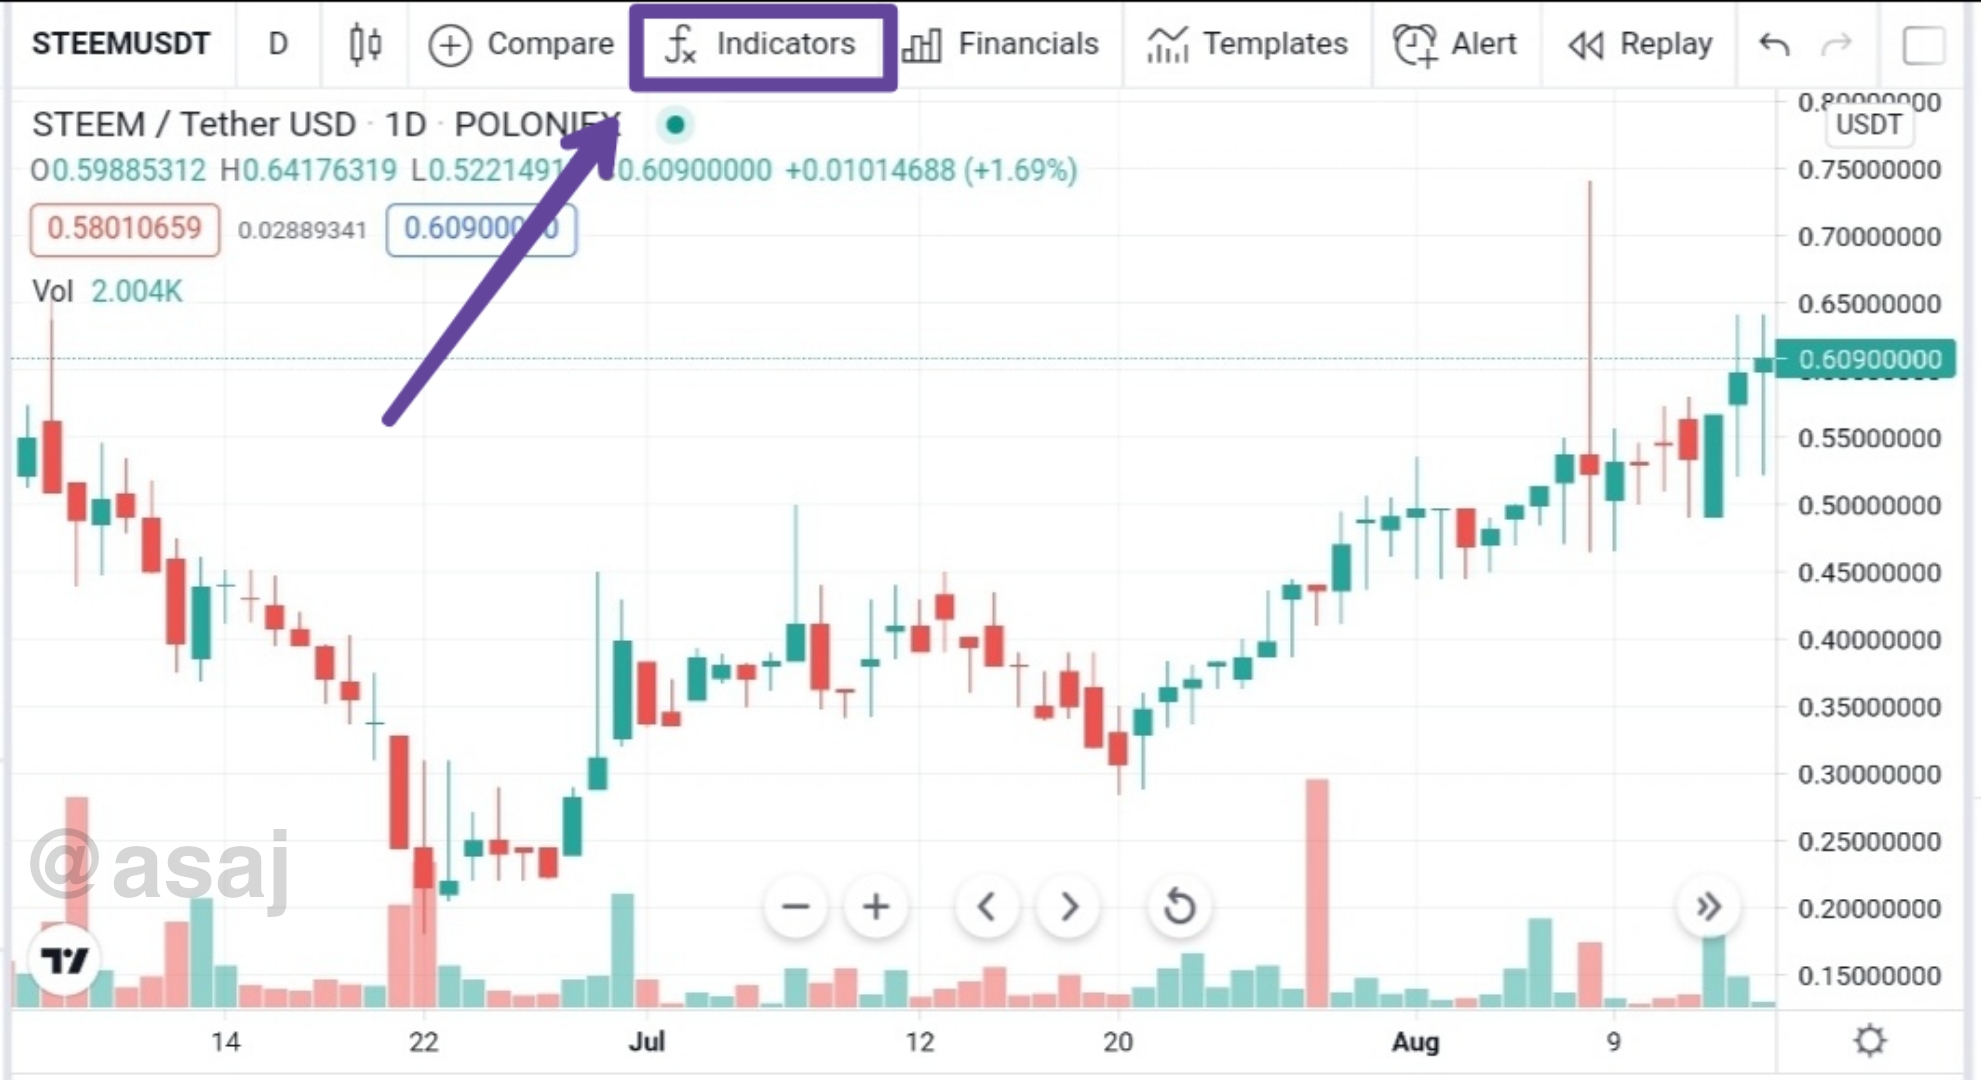
Fig. 4: STEEMUSDT pair | tradingview.com
Upon clicking on the indicators menu, there would be a pop-up notification on your screen.
- Type
KDJin the search box provided and select the [KDJ] by ll21LAMBOS21 from the public library
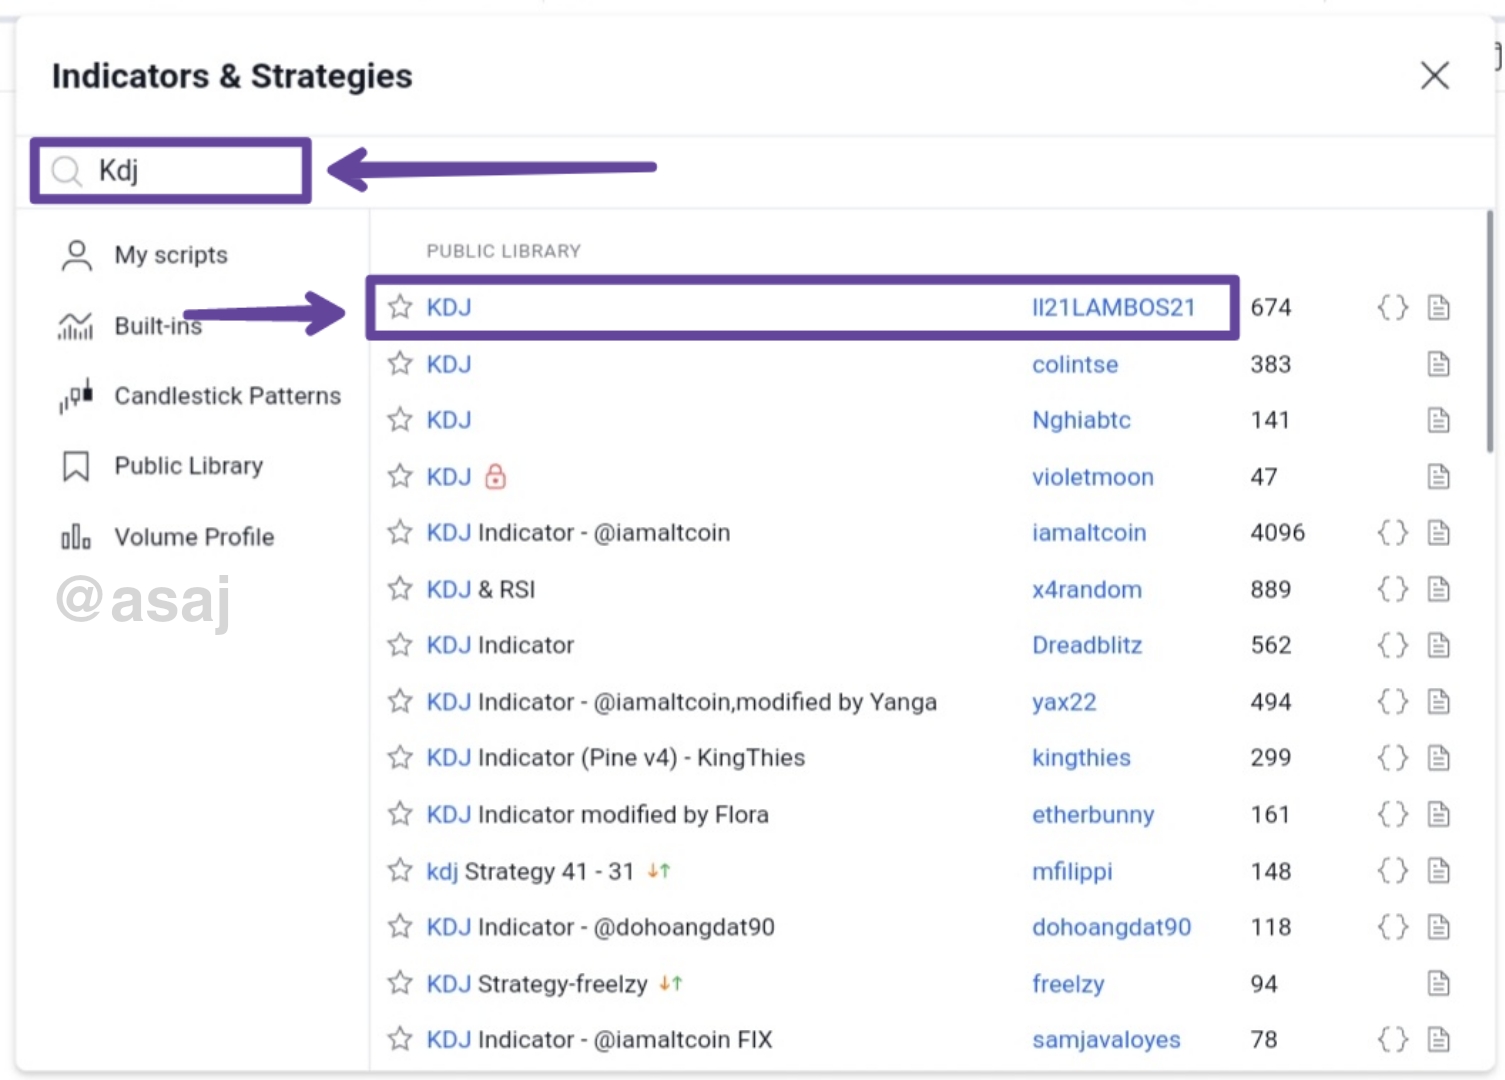
Fig. 5: Pop-up notification of indicators | tradingview.com
Now you have successfully added the KDJ indicator to the crypto chart as seen below.
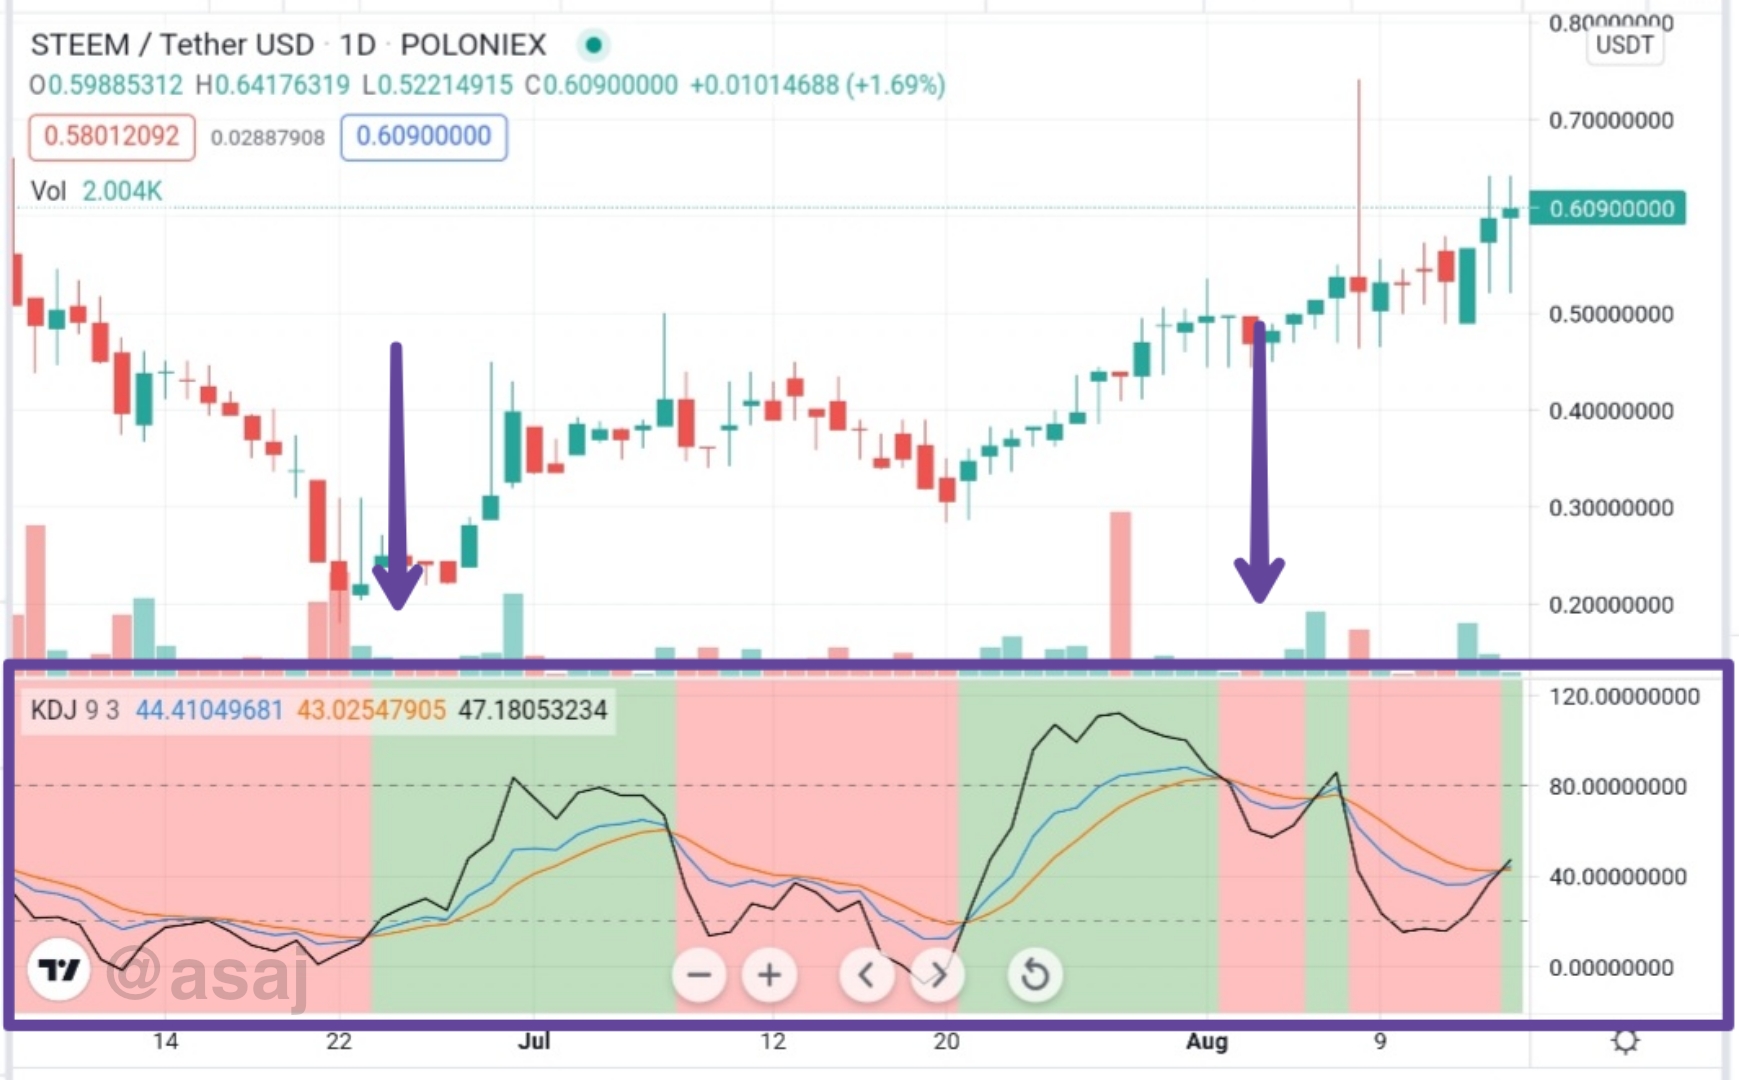
Fig. 6: The random index added to STEEMUSDT pair | tradingview.com
Signals of the Random Index
The random index can give buy and sell signals with the crossing of the KDJ lines.
Buy Signals
It is quite easy to spot buy signals when using the modified KDJ indicator on tradingview.com. One way to spot buy signals is by observing if the J-line (black line) crosses and rallies above the K and D lines.
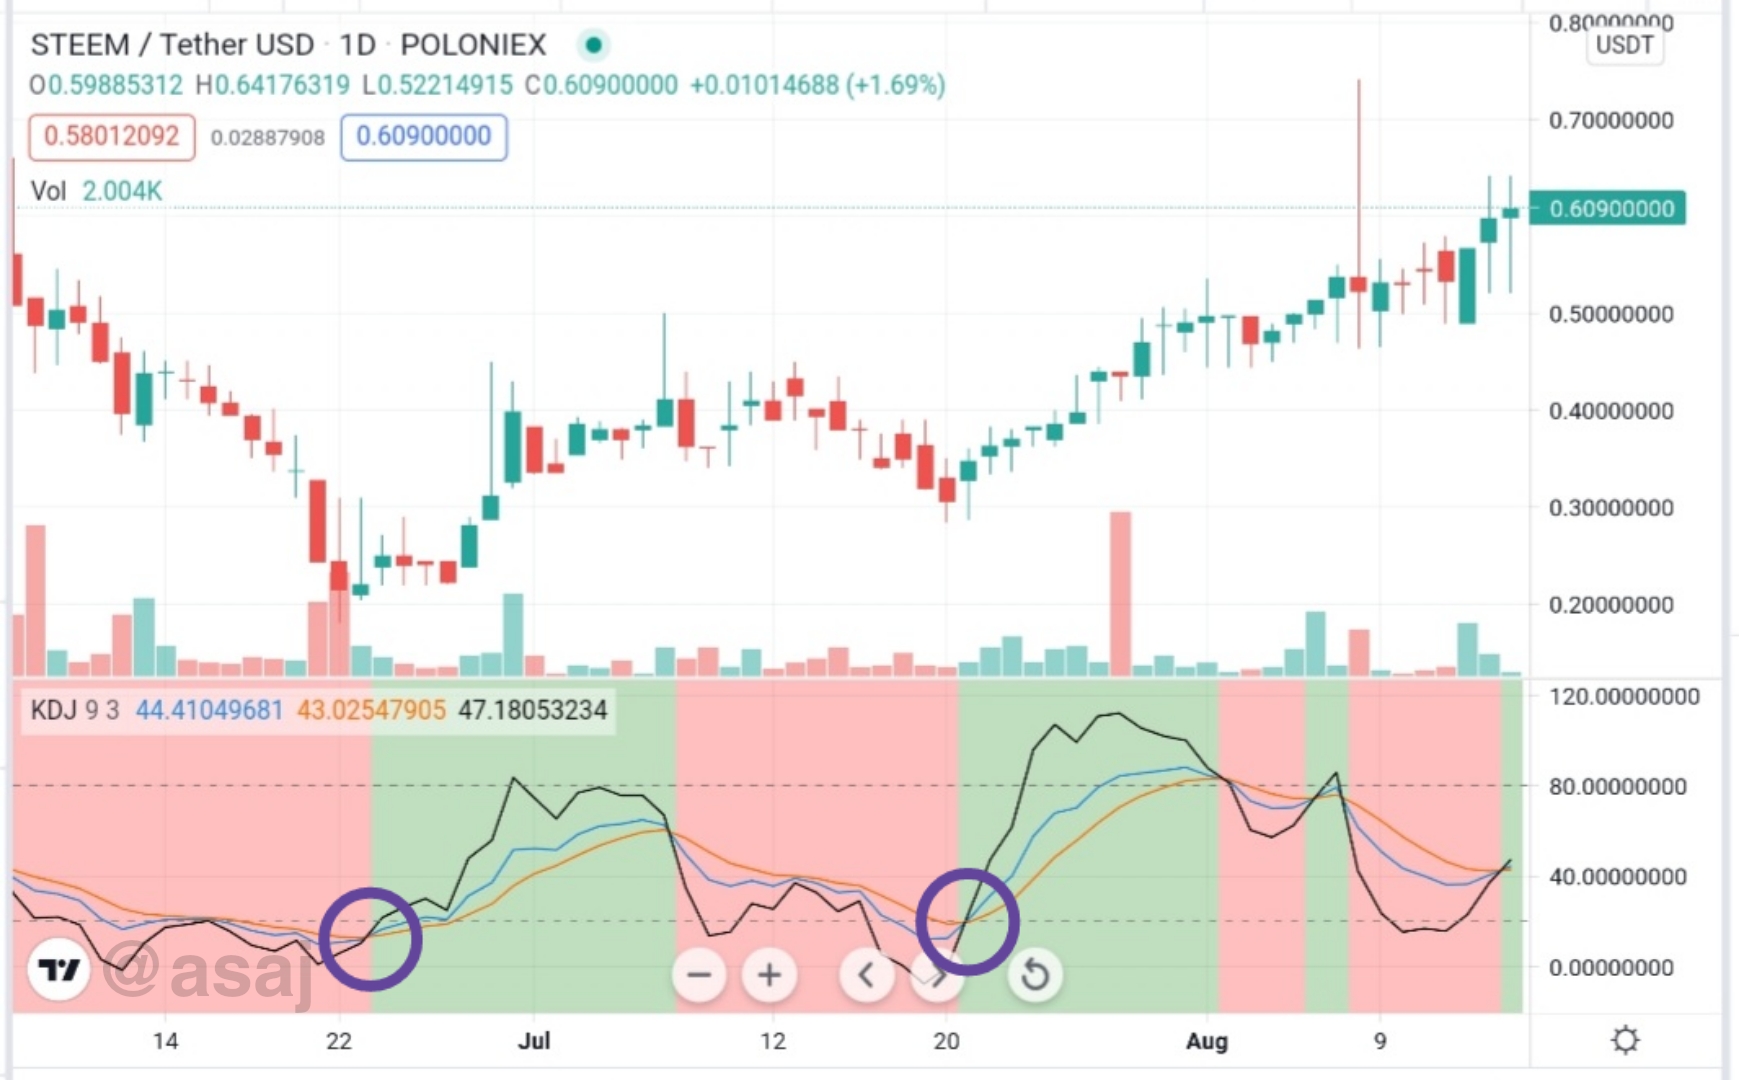
Fig. 7: Buy signals of the random index using KDJ lines crossovers | tradingview.com
Notice how the background of the KDJ indicator changes to green as soon as the J line crosses and rallies above the K and D lines. That is another way to spot a buy signal. Please note that this method of spotting a buy signal works only on the modified KDJ indicator. Ordinarily, you wouldn't find such changes in the background when the KDJ lines intercept.
A third way to identify a buy signal is when the J line (black line) falls below the 20% level and also below the K and D lines. This method, however, gives the most false signals. But the logic behind it is that the asset has been oversold, hence, leading to the asset being underpriced. So you could potentially get the crypto asset for cheap prices and sell once the price bounces.
Sell Signals
The sell signals of the random index is an application of the buy signals in reverse. First, when the J line falls and crosses the K and D lines, that is a sell signal. This is an indication of an imminent trend reversal.
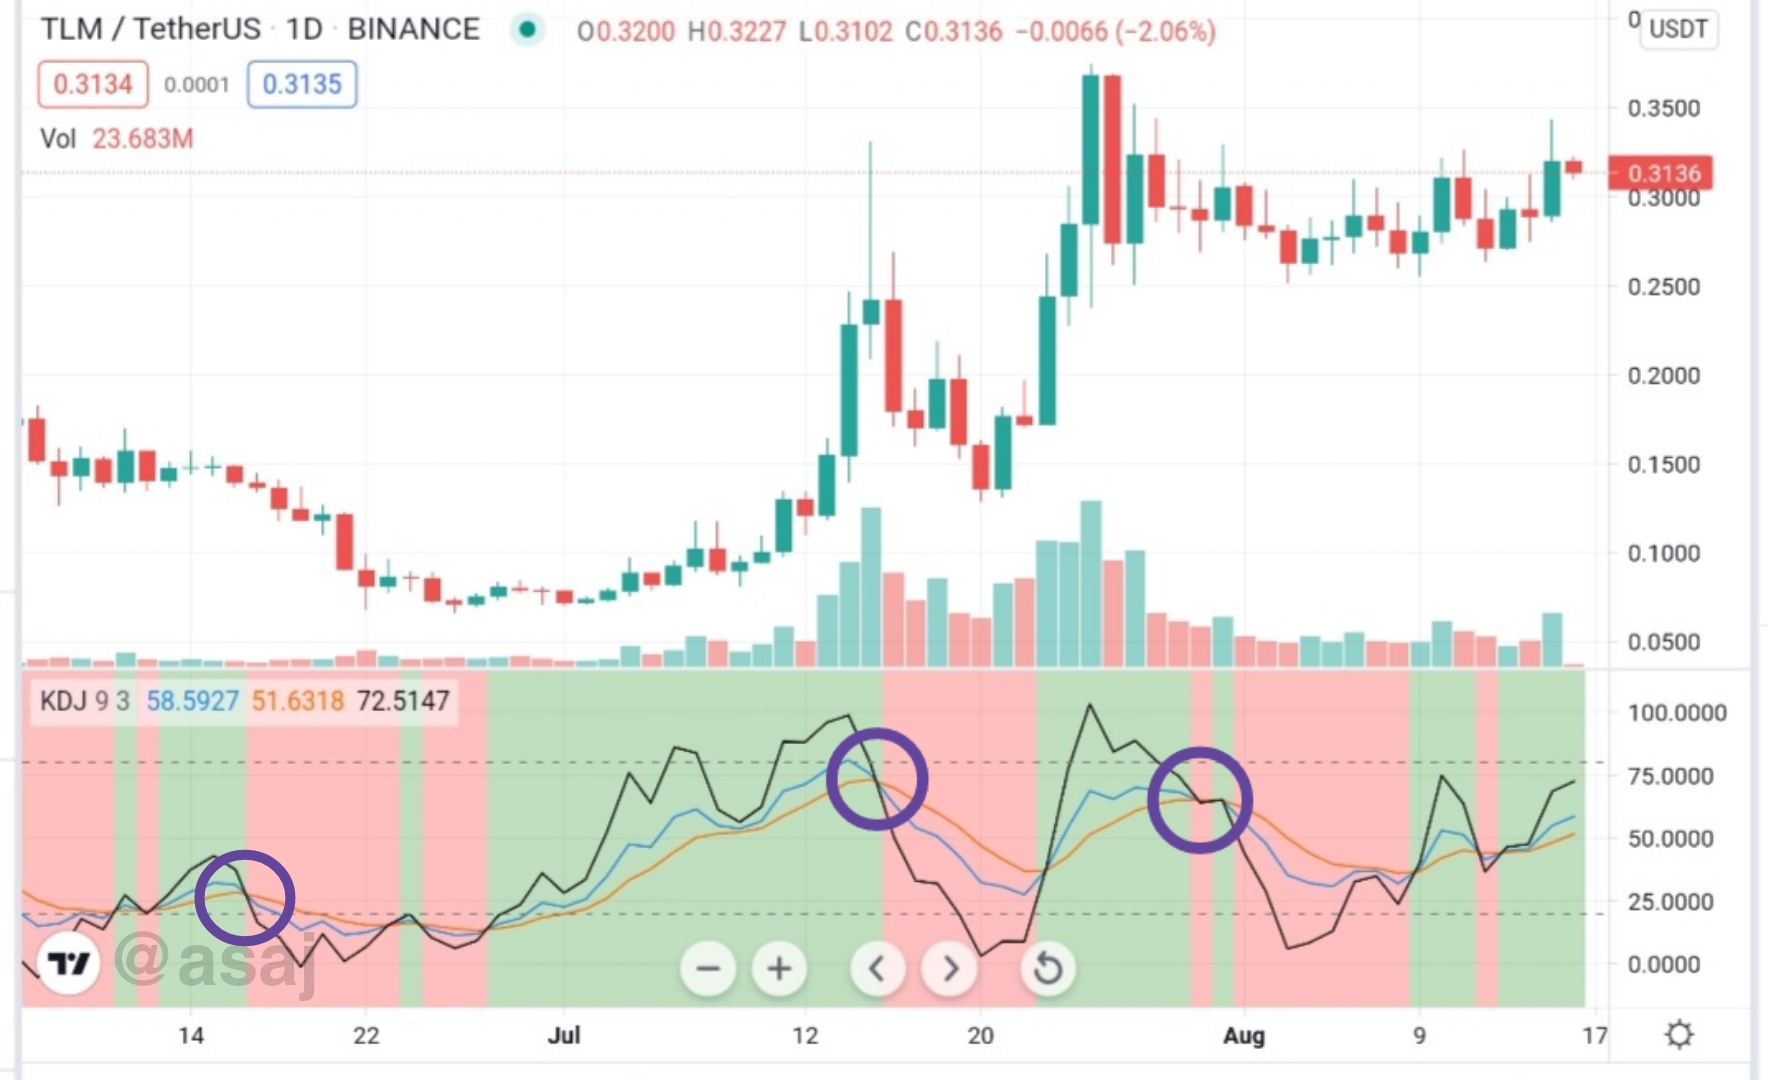
Fig. 8: Sell signals of random index using KDJ lines crossovers | tradingview.com
It can be observed in the chart above that adherence to the first two signals would save you a lot of money. However, the third signal came a bit late. This can be avoided if we add a second method to our sell signals.
This method involves observing when the J line (black line) rallies above the 80% levels. The moment the J line was gearing to leave the overbought territory, that was a sell signal. The overbought territory indicates buying pressure has made that asset to be overpriced. Selling within the overbought territory isn't a bad idea.
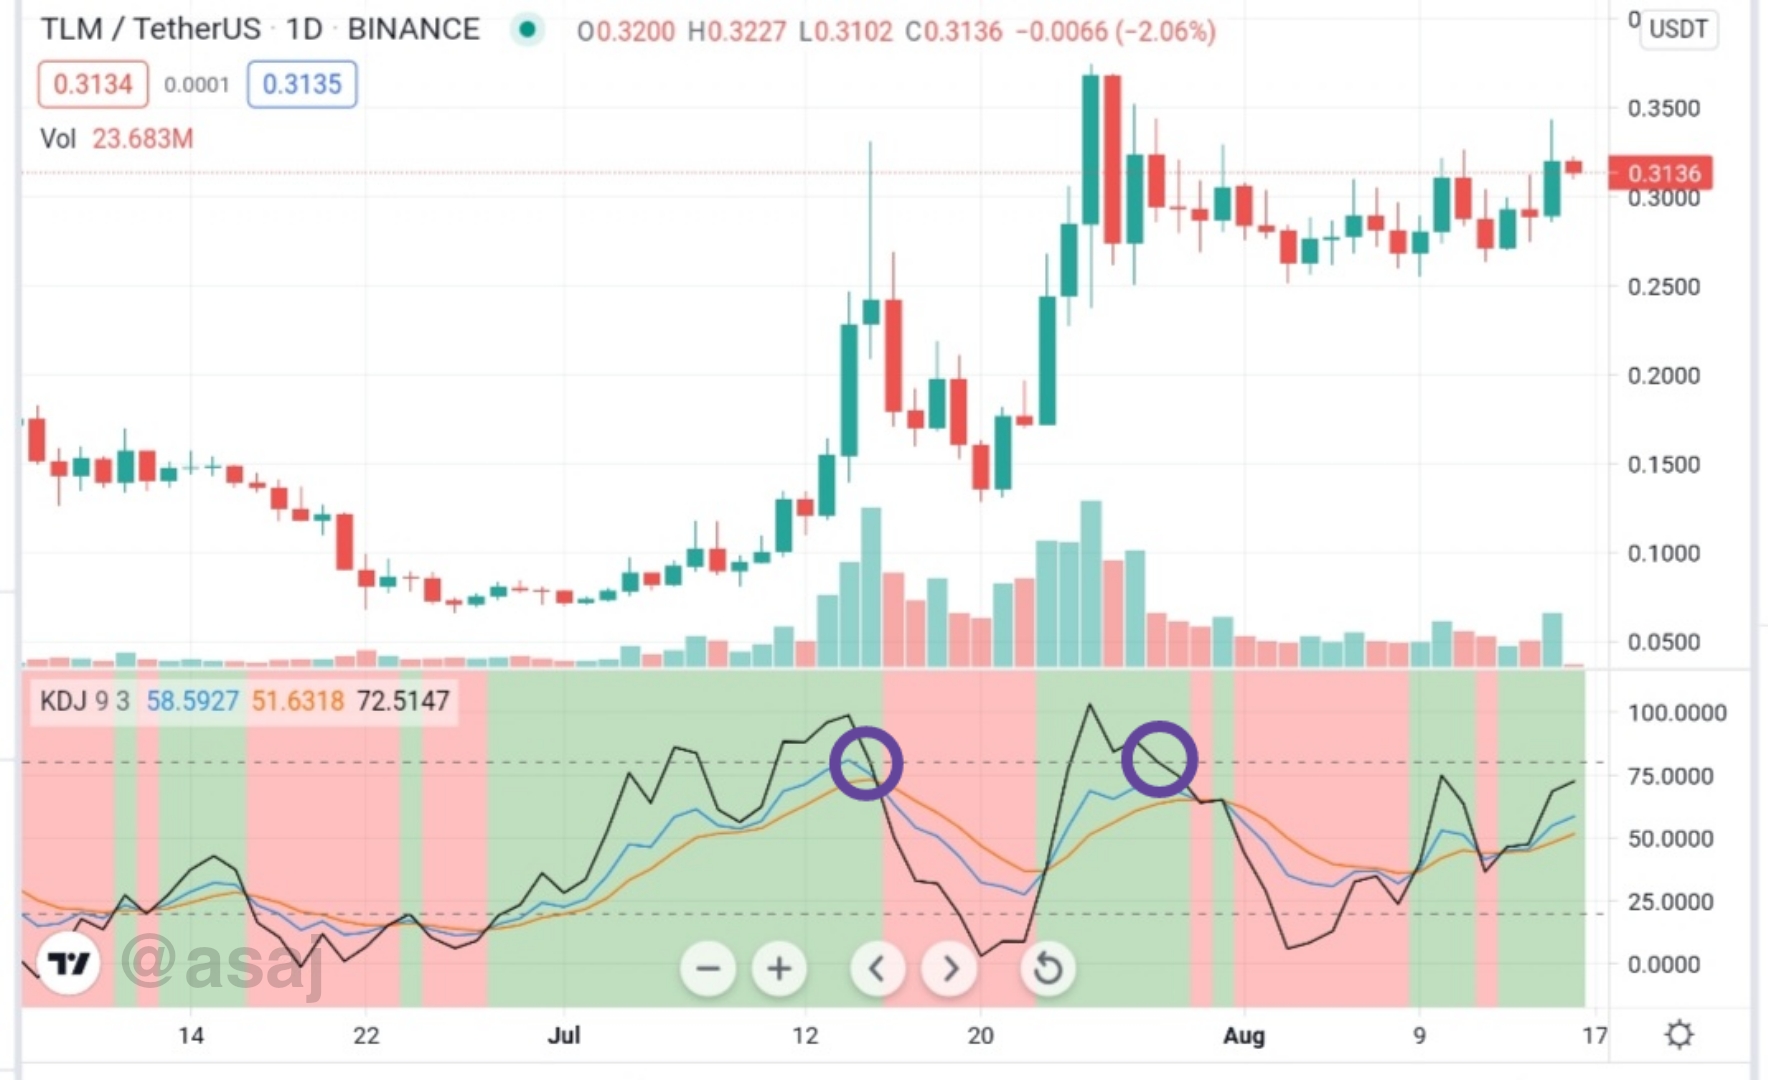
Fig. 9: Sell signals of KDJ indicator using the overbought territory | tradingview.com
Notice in Fig. 9 that the sell signals using the overbought territory are a bit quicker than the other method. Sometimes, a signal coming just a few seconds late could mean losing a big amount of your investment. Fast signals like these could make the difference.
Final Words
The KDJ indicator, also known as the random index, has a lot of tricks under its sleeve. It is a progeny of the stochastic oscillator, and as result, inherits some of its flaws. It tells us when an asset is overbought or oversold, indicates a trend reversal, and gives good market entry and exit signals.
Homework (S03 • W08)
In your own words define the random index and explain how it is calculated
Is the random index reliable? Explain
How is the random index added to a chart and what are the recommended parameters? (Screenshot required)
Differences between KDJ, ADX, and ATR
Use the signals of the random index to buy and sell any two cryptocurrencies. (Screenshot required)
Guidelines
Please take note of the following requirements:
Ensure to post your work in the Steemit Crypto Academy community.
Avoid the use of fluffs, filler words, or unnecessary information. The recommended word count is 500 words or above.
Focus on the quality & clarity of your charts and explanations instead of the length of your work.
Plagiarism, content spinning and content farming are prohibited. This task requires screenshot(s) of your own experience. Use images from copyright-free sources and indicate the source, if any.
Use a demo account to perform the above exercises
Homework task submission will start from 00:00 UTC August 16th to 23:59 UTC August 21st.
Eligible participants must have a reputation of 55 or above, and a minimum SP of 250 (excluding delegated SP). [Must not be powering down]
The title of work should be in this format, Crypto Academy / Season 3 / Week 8 - Intermediate: Crypto Assets and the Random Index (KDJ)
The first tag must be #asaj-s3week8 while the second and third tag should be #cryptoacademy and #randomindex. Feel free to use other relevant tags such as your country tag.
Homework can be written in Ukrainian (for native speakers only).
Attempt all questions to get maximum points. Note that a unique presentation of answers will earn you more points.
If you do not understand any part of the homework, please leave a comment below.
Buenas noches profesor @asaj aquí le dejo mi tarea https://steemit.com/hive-108451/@mayrelisvasquez/temporada-3-de-crypto-academy-or-curso-intermedio-criptoactivos-y-el-indice-aleatorio-kdj-asaj
Saludos profesor, me parece interesante su conferencia de esta semana, en la pregunta numero 5 es necesario realizar una compra y venta real o solo la simulacion? de ser necesaria la compra real de cuanto debe ser la inversion?
It is suggested that you perform the exercise using a demo account. Some trading brokers that offer demo accounts are FXCM, Paper Trading, FTX, MetaTrader 4, and MetaTrader 5.
Gracias profesor.
This looks good, perhaps you could start with a demo account first and see how it goes. I need more trading skills to maximise my crypto portfolio on the decentralized multi-coin wallet application from https://atomicwallet.io where my assets are always exclusive to me and secured.
Hello Professor @asaj,
Here is My Entry to the homework post.
Thank you.
Hi professor@asaj,
Here is my link for my post https://steemit.com/hive-108451/@asaj/crypto-academy-season-3-or-intermediate-course-crypto-assets-and-the-random-index-kdj
Here is my entry
https://steemit.com/hive-108451/@jasminemary/crypto-academy-season-3-or-intermediate-course-crypto-assets-and-the-random-index-kdj
Hello Prof @asaj below is my homework task for this week :
Crypto Academy / Season 3 / Week 8 - Homework Post for [@asaj] //Random Index (KDJ) INDICATOR
Dear Prof @asaj,
Below is the link to my homework Post
https://steemit.com/hive-108451/@msquaretwins/cryptoacademy-season-3-week-8-homework-post-for-professor-asaj-crypto-assets-and-the-random-index-kdj
Thank you.
Sir my homework post
Crypto Academy / Season 3 / Week 8 : Crypto Assets and the Random Index (KDJ) Homework post for Professor @asaj by@ebuahsang1
Hello Prof. @asaj, here is the link to my homework task
https://steemit.com/hive-108451/@preye2/crypto-academy-season-3-week-8-homework-post-for-asaj-crypto-assets-and-the-random-index-kdj-by-preye2
Hello professor @asaj, here is the entry link to my Homework post.