Crypto Academy Season 3 | Intermediate Course: Spotting Market Reversals With CCI
The study of Trading and Market Psychology has shown us the negative consequences of allowing emotions to influence our investment decisions. We also established the importance of conducting adequate fundamental analysis and/or technical analysis before making a trade.
While fundamental analysis involves the study of general information about an asset, technical analysis deals with the study of price patterns to enable traders to forecast future prices. This week's lesson focuses on a technical indicator that can be used to monitor price patterns and predict market reversals. First and foremost, what are market reversals?
Market Reversals
Market reversal can be defined in so many ways, and these definitions mean the same. It is also known as trend reversal. It occurs when there is a sudden change in the movement of the price of a crypto asset. Or when there is a change in the trend direction of a crypto asset.
Technically speaking, market reversal is a point of interception between an uptrend and a downtrend line. Trend reversals are broadly categorised into two groups based on the direction of the change. They are:
- Upward trend reversal, and
- Downward trend reversal
It is fitting to call such change in price movement a point of reversal because the word 'reverse' means to move in the opposite direction.
1. Upward Trend Reversal
Upward trend reversal occurs when there is a rise in the price of a crypto asset after experiencing a continuous fall in price for a certain period of time.
To make it easy to remember, in an upward trend reversal, an uptrend occurs after a downtrend.
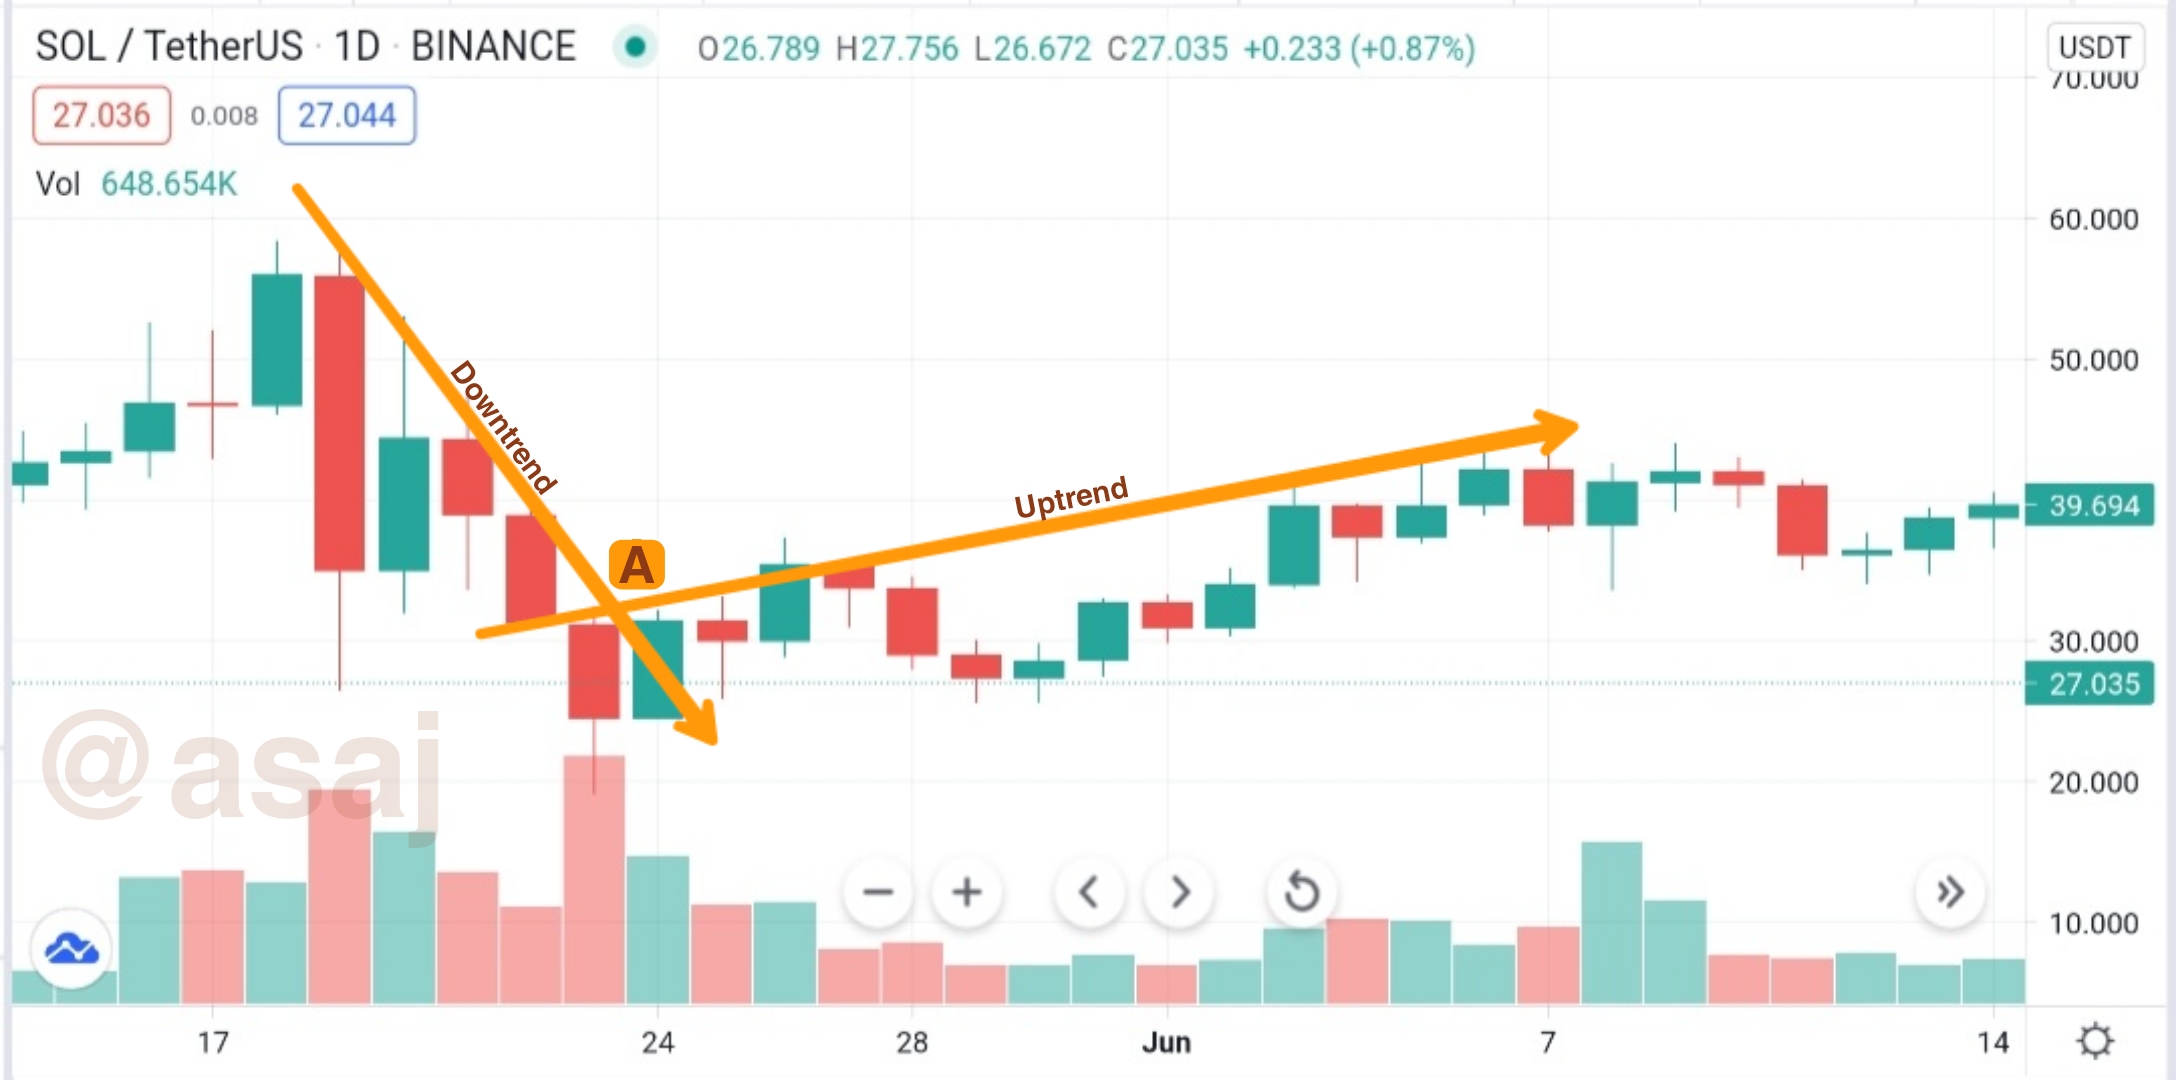
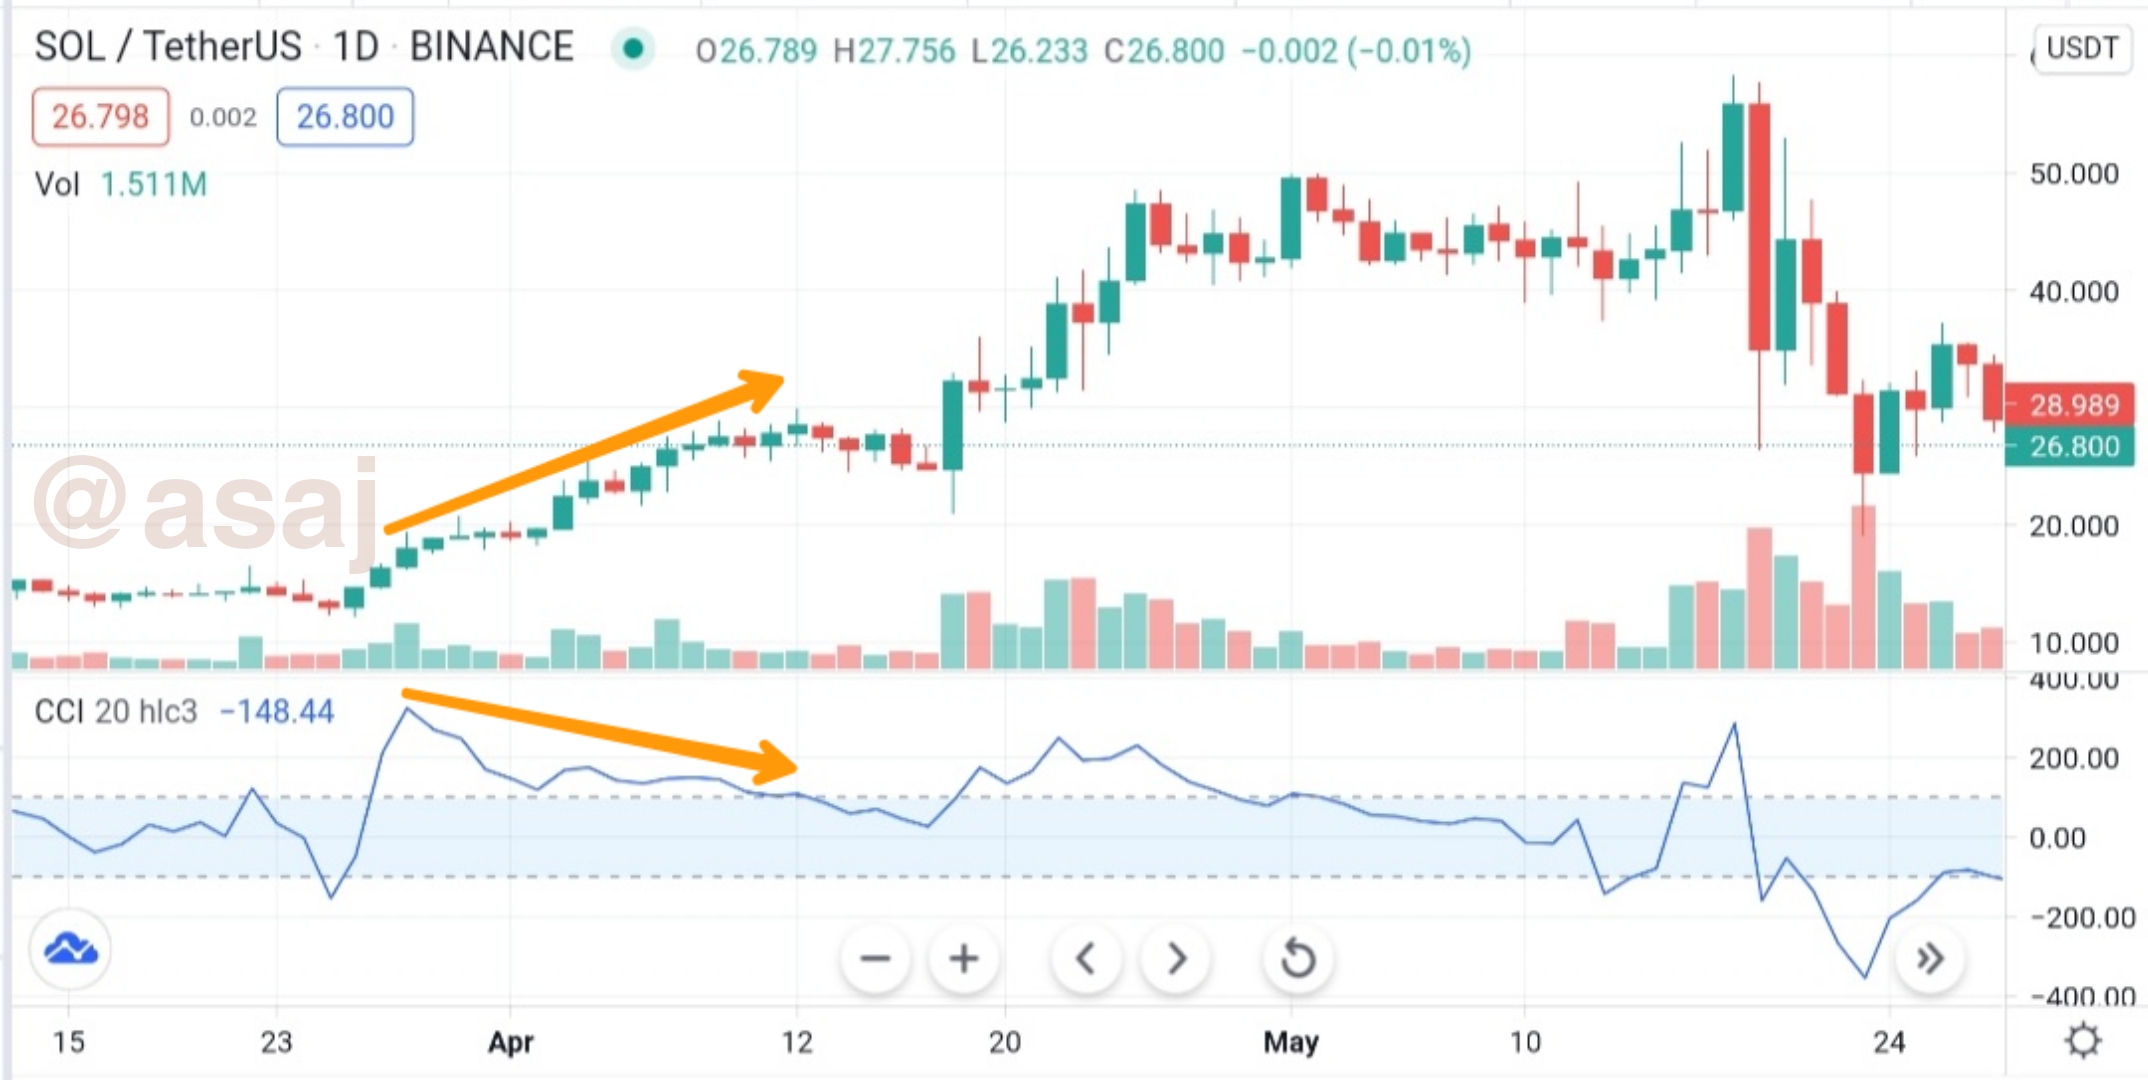
From the above chart, the rise in Solona prices after a continuous fall in price can be observed. The point at which the price movement changed its direction is known as the trend reversal point. Let us label that interception Point A, as seen in the graph. This type of market reversal is what we call upward trend reversal.
The goal of every trader is to capture upward trend reversal before it occurs. This gives us the opportunity to buy crypto assets at lower prices and then sell them when the prices rise.
This is contrary to a downward trend reversal.
2. Downward Trend Reversal
We say there is a downward trend reversal when there is a fall in the price of a crypto asset after experiencing a continuous rise in price for a certain period of time.
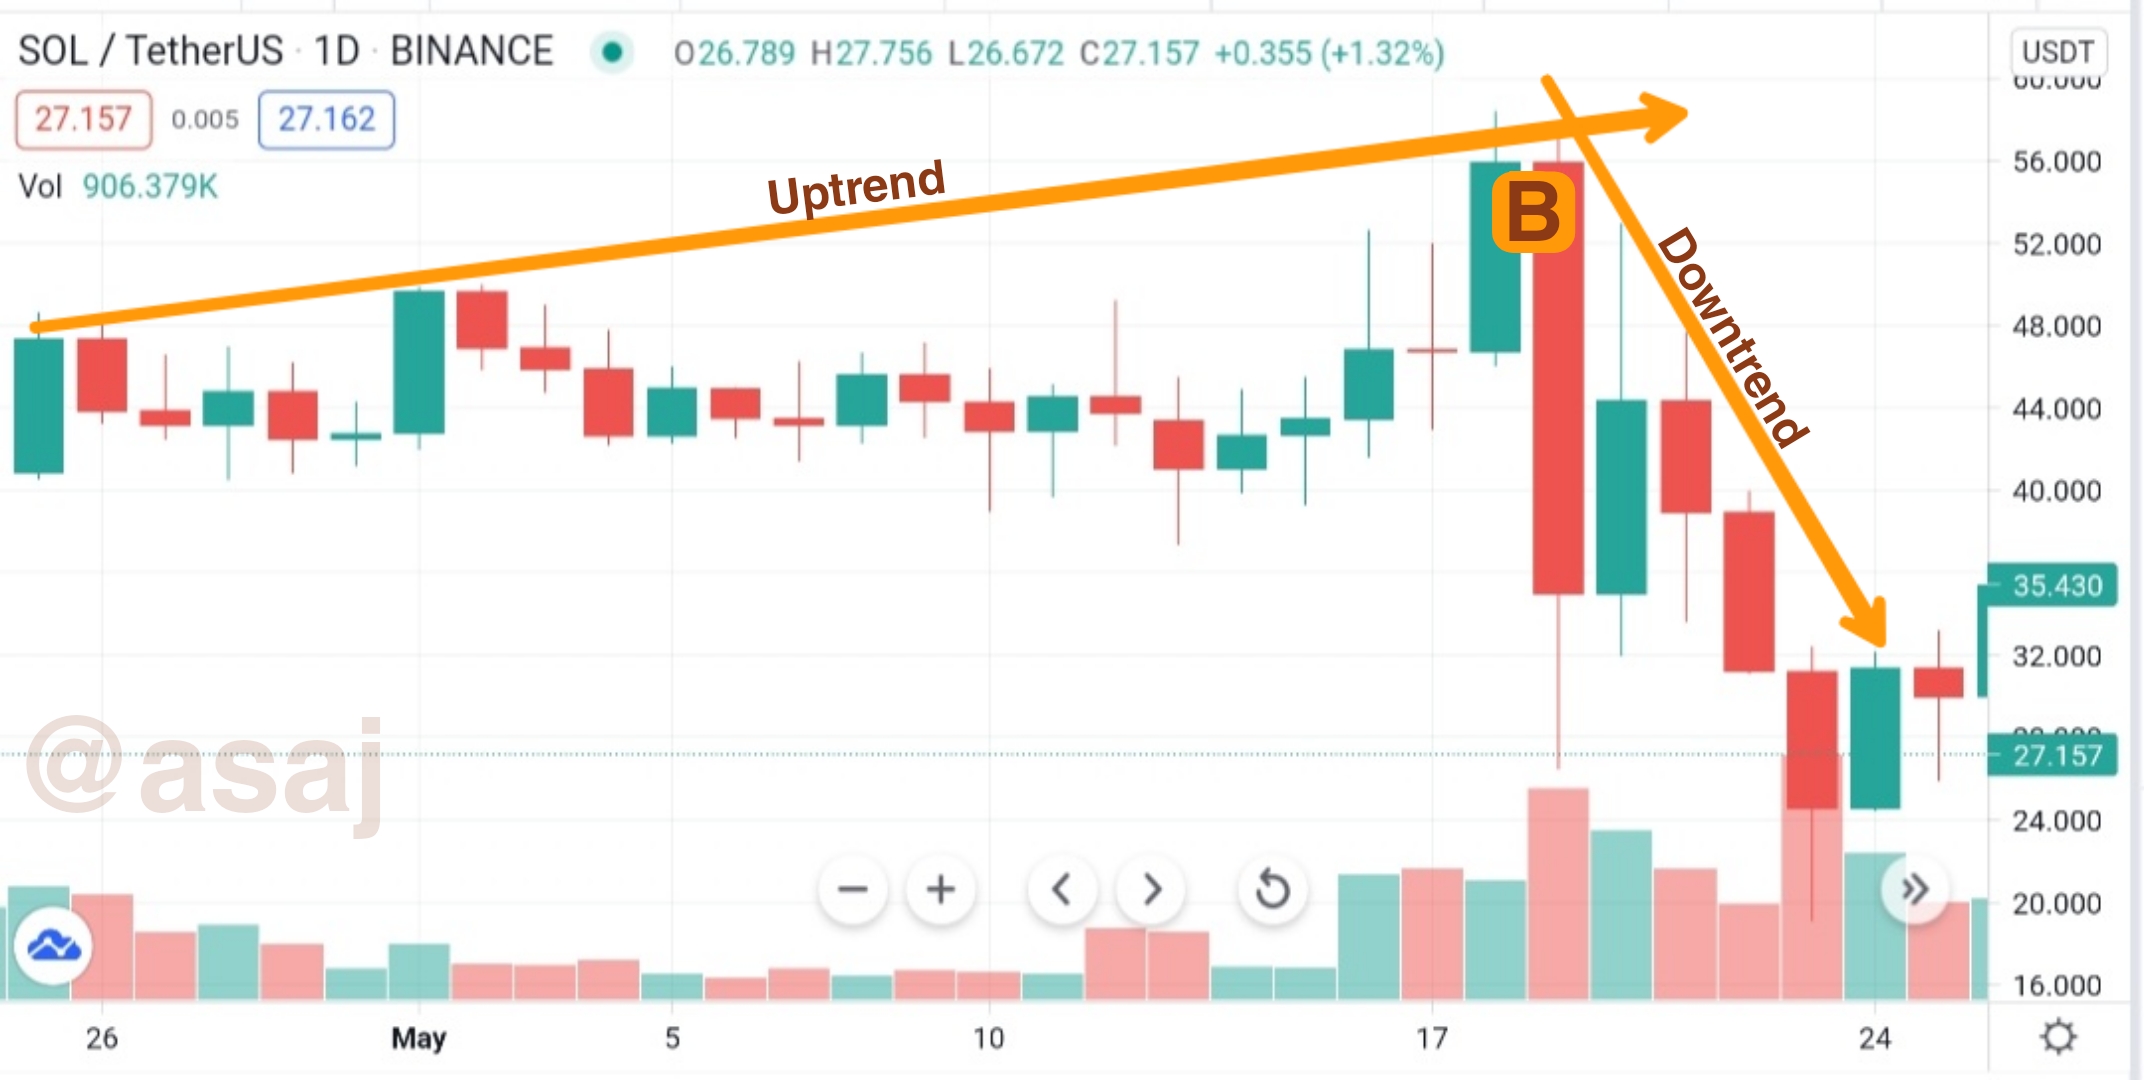
This is the exact opposite of what happens when there is an upward trend reversal. In a downward trend reversal, a downtrend occurs after an uptrend as seen at Point B in the chart above.
As crypto traders, we try to avoid being caught in a downward trend reversal because of how dangerous it can be. We could lose more than half the value of our investment.
Now, we have established the importance of market reversals and how they can make or break one's wallet. How then can we predict market reversals? Let us consider what Donald Lambert has to say.
In the 1980s, Donald Lambert invented a technical indicator that would someday become an essential part of making trade decisions. This technical indicator tells us when to acquire a position, when to sell our positions, and when to avoid trading. That technical indicator is the Commodity Channel Index (CCI).
What Is Commodity Channel Index (CCI)?
The Commodity Channel Index (CCI) measures the price movement of a crypto asset and the rate at which the price changes. CCI falls under the category of technical indicators called oscillators.
It tells us whether a coin is being oversold or overbought. It does this by calculating the deviation of the current price of an asset from the average price.
The larger the value of the CCI, the larger the difference between the current price of the crypto asset and the average price.
How the Commodity Channel Index (CCI) Works
Unlike the relative strength index (RSI) which records between bounded points of 0 to 100, the commodity channel index (CCI) gives unbounded readings. This means that CCI can give us high or low readings without reaching any limit. The readings can be positive or negative percentages.
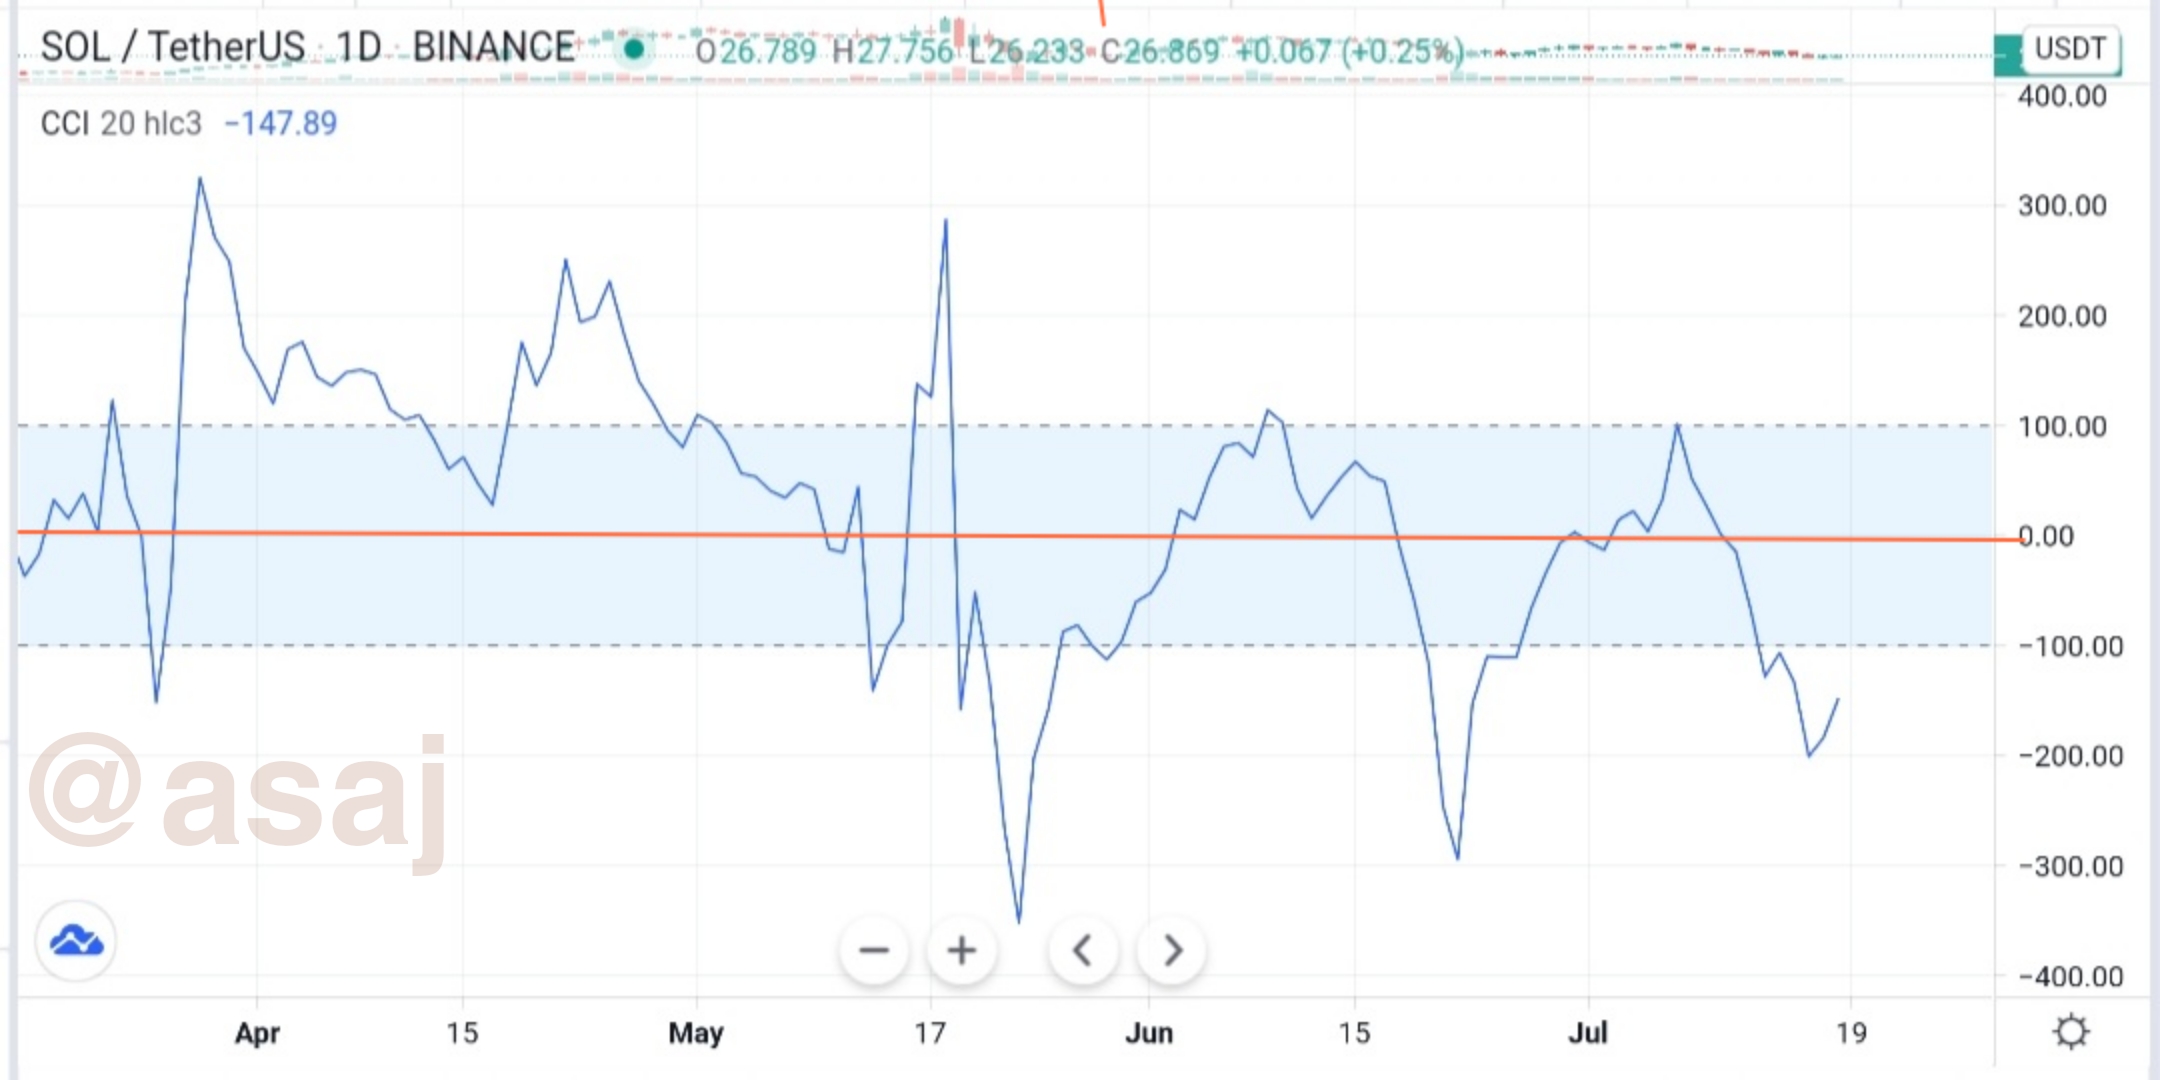
The shaded area in the chart above highlights the three important CCI levels that can be used to determine the condition of the market. They are:
- The high level (above +100%),
- The central level (point zero), and
- The low level (below -100%)
Let's examine the three various levels of CCI readings.
The High Level (Above +100%)
When the current price of an asset is greater than the historical average, the commodity channel index (CCI) crosses above the +100% point. This means that buying has pushed the price of a crypto asset so high that it has led the asset to be overbought.
In other words, traders have shown their overconfidence or greed in the crypto asset by acquiring too many positions. This also means that there are more buyers than sellers in that particular trade. The CCI line can get to as high as +400% point or even higher. The higher it gets the higher the possibility of a price pullback.
A price pullback occurs when there is a fall in the value or price of a crypto asset after an uptrend. This marks a point of market reversal. The maximum point for which CCI will get to before a market reversal occurs varies from one asset to another.
Some assets may experience market reversals after CCI hits the +200% or -200% marks. Meanwhile, for another crypto asset, trend reversal may form when the CCI hits +300% or -300% marks.
To increase the accuracy of predicting market reversals, you have to study past trend reversals of that particular asset.
The Central Level (0%)
The central level is depicted with an orange horizontal line in Fig. 3. That line marks the neutral zone.
When the current price of an asset is equal to the historical average, CCI gives a zero reading. Therefore, the shaded portion of the graph is known as the neutral territory or near-zero territory. Put differently, CCI rests on the zero line when the buying power in a trade cancels out the selling power.
This implies that the market is currently having mixed sentiments. It can also be said that the number of buyers is equal to the number of sellers in that particular trade.
The Low Level (Below -100%)
From -100% mark and below indicates that a crypto asset is currently being oversold. This occurs when the current price of an asset is lesser than the historical average. It is a signal that shows that the aggregate trading behaviour of people in the market is motivated by negative emotions.
Imagine negative news emerge on the media regarding a crypto asset. Holders of that asset would most likely panic-sell their positions due to fear, which could make the prices of the asset fall continuously because the asset is being oversold.
The CCI line can get to as low as -400% point. After which, a price bounce may occur. A price bounce occurs when the value of a crypto asset goes up after a downtrend. The price bounce indicates a point of market reversal.
Spotting Market Reversals With CCI
The most common use of the commodity channel index (CCI) is to spot market reversals. How then do we spot market reversals?
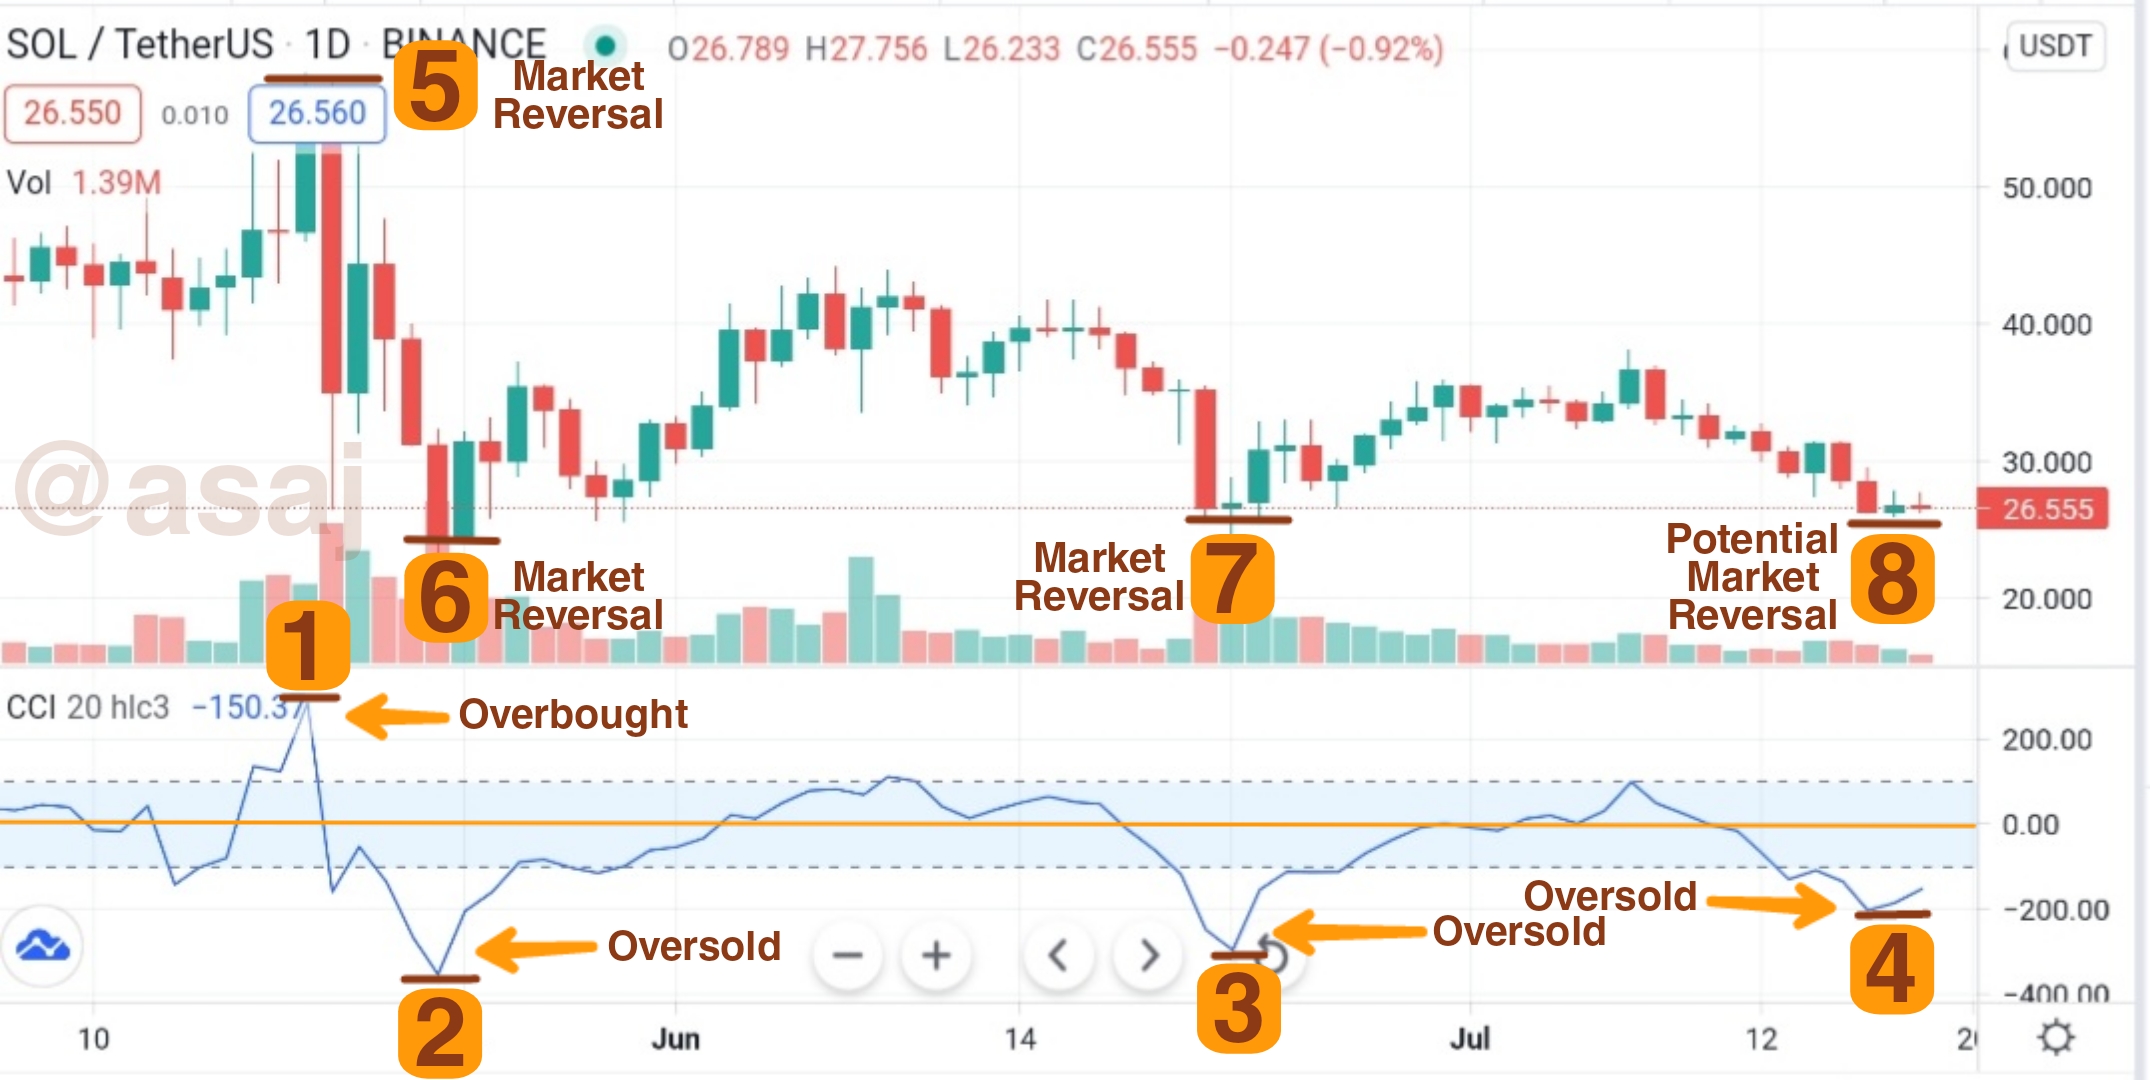
I have loaded the SOL/USDT pair in the chart above and have added the CCI oscillator.
Sell Signal
In Fig. 4, the CCI tells us that Solona coin has been overbought in Point 1, this leads to a market reversal at Point 5. When CCI gives an overbought reading by crossing above the +100% mark, it is a signal to sell your position because a market reversal will soon occur.
Note: The CCI line doesn't always have to cross the +100% to send a sell signal. In some cases, the moment it touches the +100% mark it signals a trader to sell his positions at different price levels.
Buy Signal
In the chart above, three glaring buy signals given by CCI have been indicated at Points 2, 3, and 4. We thereafter see the corresponding market reversals at Points 6, 7, and 8.
When the CCI line reaches the oversold territory by crossing below the -100% mark, it is sending a buy signal because a market reversal is imminent. Thus, you can make a profit from buying at lower prices and selling when the price increases.
Also, note that sometimes when the CCI line touches the -100% mark, it signifies a buy signal. In such cases, the CCI line may not cross the -100% mark but touch it slightly then bounce upward.
Merits and Demerits of CCI
The commodity channel index (CCI) helps traders to know when a crypto asset is underpriced or overpriced as the CCI line reaches the oversold and overbought territories. While this creates a good opportunity to make a profit in the market, it has its drawbacks.
One major disadvantage is that the interpretation of CCI readings is highly subjective. This means that traders may interpret it differently.
Another drawback is, CCI gives unbounded readings. Unlike the RSI which gives a bounded reading between 0 to 100, CCI values have no limit. This can make it difficult to identify the exact time a market correction will occur.
Divergence of CCI and Price Movement
Sometimes, CCI gives a reading that doesn't correspond with the candlestick price movements. Such disagreements between CCI and price chart are known as divergence.
There are two types of divergence. They are:
- Bearish Divergence (sell signal), and
- Bullish Divergence (buy signal)
A Bearish Divergence forms when the CCI line experiences a lower high while the candlestick price movement reaches a higher high. An example of a bearish divergence is seen in Fig. 5. Bearish divergence is often a signal to sell your position because a fall in price will occur thereafter.
On the other hand, a Bullish Divergence forms when the CCI line experiences a higher high while the candlestick price movement reaches a lower high. Bullish divergence is often a signal to buy because a rise in price level usually happens later on.
How to Filter the CCI Signals
You can confirm or reject the signal of CCI using other technical indicators like the Accumulation and Distribution Index (A/D), Moving Average Convergence Divergence (MACD), and other non-oscillators.
A trader must not use an oscillator to confirm or reject the signal of another oscillator in order to avoid the error of multicollinearity. Since oscillators measure similar content, they may give similar readings.
For this reason, it is best to use a combination of volume, trend, and momentum-based (oscillators) indicators when trading.
Homework (S03 • W04)
In this week's task, you will be using a demo account on any trading broker (e.g. FXCM, Paper Trading, FTX, MetaTrader 4, or MetaTrader 5).
Demonstrate your understanding of the topic by attempting the questions below:
Open a demo account on any trading broker and select five cryptocurrency pairs
Create a market entry and exit strategy
Use the signals of the Commodity Channel Index (CCI) to buy and sell the coins you have selected
Declare your profit or loss
Explain your trade management technique
Note: Please ensure to read this homework post thoroughly in order to understand the terms and answer the questions correctly. Also, do your research on the suggested topics for further reading.
Meanwhile, attach a screenshot of whatever you have done to all questions. Add a watermark of your username to the screenshots.
Additionally, trade management techniques can include the use of stop-loss, trailing stop, take profit orders as well as the use of a volume or trend indicator to confirm or reject the CCI signals.
Guidelines
Ensure to post your work in the Steemit Crypto Academy community.
Avoid the use of fluffs, filler words, or unnecessary information. The recommended word count is 500 words or above.
Focus on the quality & clarity of your charts and explanations instead of the length of your work.
Plagiarism, content spinning and content farming are prohibited. This task requires screenshot(s) of your own experience. Use images from copyright-free sources and indicate the source, if any.
Homework task submission will start from 00:00 UTC July 19th to 23:59 UTC July 24th.
Eligible participants must have a reputation of 55 or above, and a minimum SP of 250 (excluding delegated SP). [Must not be powering down]
The first tag must be #asaj-s3week4 while the second and third tag should be #cryptoacademy and #tradingwithcci. Feel free to use other relevant tags such as your country tag.
Homework can be written in Ukrainian (for native speakers only).
Attempt all questions to get maximum points. Note that a unique presentation of answers will earn you more points.
If you do not understand any part of the homework, please leave a comment below.
hey prof, this is my homework
https://steemit.com/hive-108451/@robbee/steemit-crypto-academy-intermediate-level-courses-season-3-week-4-homework-by-asaj-spotting-market-reversals-with-cci
Excelente conferencia.
Professor I bit confused for, when the trend line in oscillator breaks the shaded area so that would be a overbought or oversold position? Or just hit the shaded area high or low?
And one more thing how can we as a beginner can evaluate the overbought maximum point of any asset or minimum point as you said different crypto assets having different points of high lows(100%+ or 100%-) my means is that how can new individual can interpret this thing or experience can evaluate us or any trick or strategy is required for this??
The overbought and oversold territory is constant for all crypto assets
When CCI breaks the +100% line, that asset is said to be overbought. On the contrary, when CCI breaks the -100% line, that is the oversold territory. It doesn't matter the type of crypto asset. This interpretation stands for all assets.
Buy and sell signals varies across crypto assets
CCI signal is simply saying that there will be a market reversal very soon. Sell signal can occur when CCI touches or breaks the +100% line. Whereas when CCI touches or breaks the -100% line that is a buy signal.
Ok professor
Professor in the second question which is "Create a market entry and exit strategy" will this startegy is based on our technical analysis or wether using CCI oscillator that you have been discussed for your entry and buy positions?
Market entry and exit strategies vary among traders. Do some research on it and use the strategy that suits your personal style 😉
ok sir
Good work as always. I must commend you for clarity. Please keep this up.
Can we use live accounts if we desire?
You can, if you want to. Meanwhile, if you are not familiar with the oscillator it is best to use a demo account.
Good morning teacher, does this indicator also work with smaller time frames such as 1h or 4h?
Using CCI on shorter time frames is more complicated. Make sure to confirm or reject CCI signals using other indicators.
In question 2, I understand the market entry of a crytpo contract, which are buy and sell,,, predicting the price movement either upward or downward, but I don't understand the exit strategy you meant, how do we determine the buy and sell at the exit point?.. could you explain this as it has been a confusion for me. @asaj
Do your research on market entry and exit strategies. As a point of reminder, market entry means to acquire a position and exit means to sell a position.
hi prof, in question number 3, do we sell and buy only one coin or do we have to buy five coins?
Buy and sell all coins. You can buy and sell the coins multiple times.
Hello sir @asaj, can we use trading view website for this assignment?
Yes, you can.