[Crypto Trading With Chaikin Money Flow Indicator]- Crypto Academy S4W6 - Homework Post for professor @kouba01

Question 1
In your own words, give a simplified explanation of the CMF indicator with an example of how to calculate its value?
The Chaikin Money Flow (CMF) Indicator
Chaikin Money Flow (CMF) indicator is an average-volume based indicator that indicates the buying and selling pressure of a traded market through cash inflow and outflow, which is expressed as accumulation and distribution of the traded asset at any given period, and also indicating possible areas of buying and selling opportunities in line with the accumulation and distribution of the asset. This indicator was developed by Marc Chaikin, a famous stock market analyst.
The CMF indicator line moves between values of 1 to -1, where the range value 0 is considered as the midpoint. Ideally, when there is an increasing volume, and the CMF line is moving closer to 1, it is assumed that buying pressure is higher, with price closing near the high of the daily range.
But when the CMF line is moving closer to -1, it is assumed that selling pressure is higher, this is because of the direct correlation between money inflow and outflow volume and price of the asset.
The CMF does not require price to fulfill the condition of trading along with the trend, because of how money flow is represented, as accumulation pushes prices up either (short term or long term) and distribution push prices down (either short term or long term).
CMF Indicator Calculation
Marc Chiakin created a mathematical expression to represent this concept to volume-based indicator (CMF). And the formula is as follows:
Chaikin Money Flow = observation period [(((Cprice - Lprice) - (Hprice - Cprice)) / (Hprice - Lprice) × current Volume)] / (Total observation period volume)
Where:
Cprice = Close price for the day.
Lprice = Low price for the day.
Hprice = High Price for the day.
Alternatively, the CMF indicator can be calculated with another method (Money flow formula), where Money Flow Multiplier (MFM) and Money Flow Volume MFV) are introduced. To use this method:
Chaikin Money Flow = Observation period Money Flow Volume / Total period volume
The Money Flow Volume (MFV) is the product of multiplying Money Flow Multiplier with the Volume Period. Which is expressed mathematically as:
MFV = MFM × Volume Period (VP)
From the above formula, the Money Flow Multiplier (MFM) is expressed mathematically as:
MFM = [(Cprice - Lprice) - (Hprice - Cprice)] / (Hprice - Lprice)
Consider the example below
If the specified observation period is 21 days, and an ETHUSDT chart has the following price readings:
Closeprice = $3,567.09
Highprice = $3,580.95
Lowprice = $3,537.08
Period Volume (VP) = $10,581
Total period volume = $17.488 Million
To get the CMF indicator value, first, calculate the money flow Multiplier.
Using the MFM formula:
MFM = [($3,567.09 - $3,537.08) - ($3,580.95 - $3,567.09)] / ($3,580.95 - $3,537.08)
MFM = [($30.01) - ($13.86)] / ($43.87)
MFM = ($16.15) / ($43.87)
MFM = 0.368133120583542 which is equivalent to 0.37 to 2sf.
Next, calculate the MVF:
Using the MFV formula:
MFV = 0.37 × $10,581
MFV = 3,914.97
The CMF indicator value will be
Using the CMF indicator formula:
CMF indicator = 3,914.97 / $17,488,000
CMF indicator = 0.00
The CMF indicator value is 0.00
Ideally, the CMF makes it possible for traders to easily identify buying and selling opportunities based on volume. If the CMF line is moving close to 1, it implies that the buyers are in control within the specified period, while a move close to -1, implies the dominance of sellers in the market within the specified period.

Question 2
Demonstrate how to add the indicator to the chart on a platform other than the tradingview, highlighting how to modify the settings of the period(best setting).(screenshot required)
Adding CMF Indicator to charts
To add a CMF indicator to a chart, visit any trading platform that supports the use of indicators. For this demonstration, I will use the Good crypto platform.
First, visit Good crypto's official website on the homepage click on web app, and follow through with the login processes.

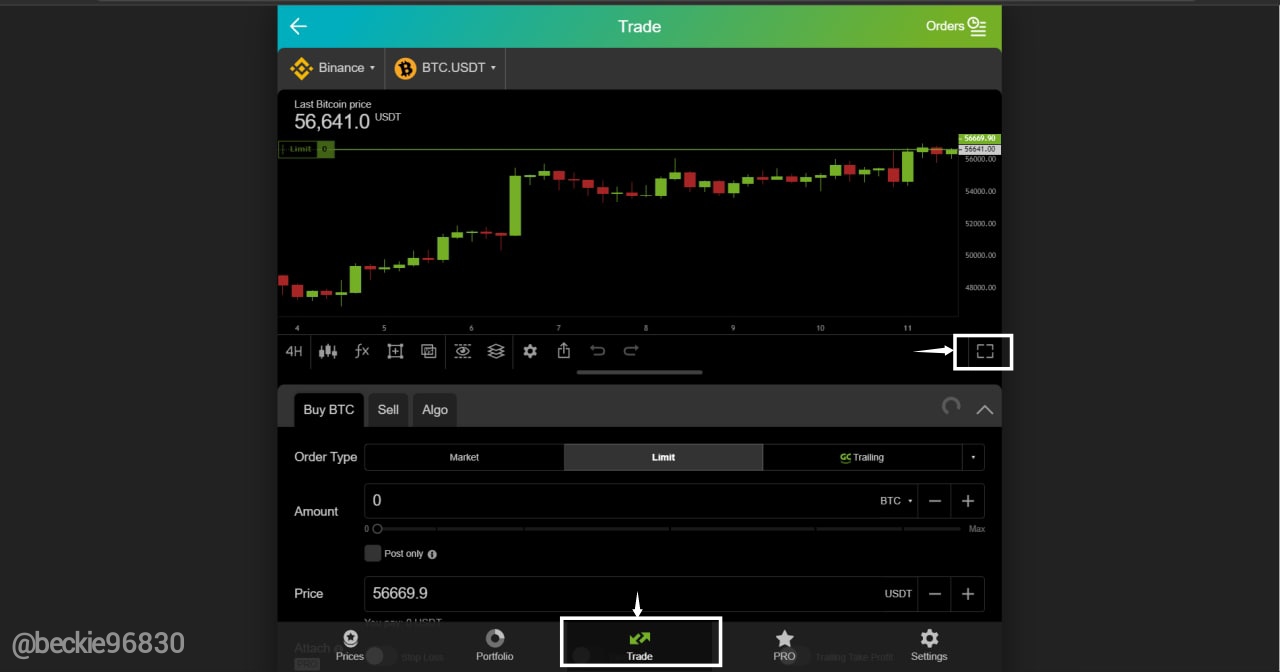
Click on Trade to access the chart section of the platform, and expand the chart window.
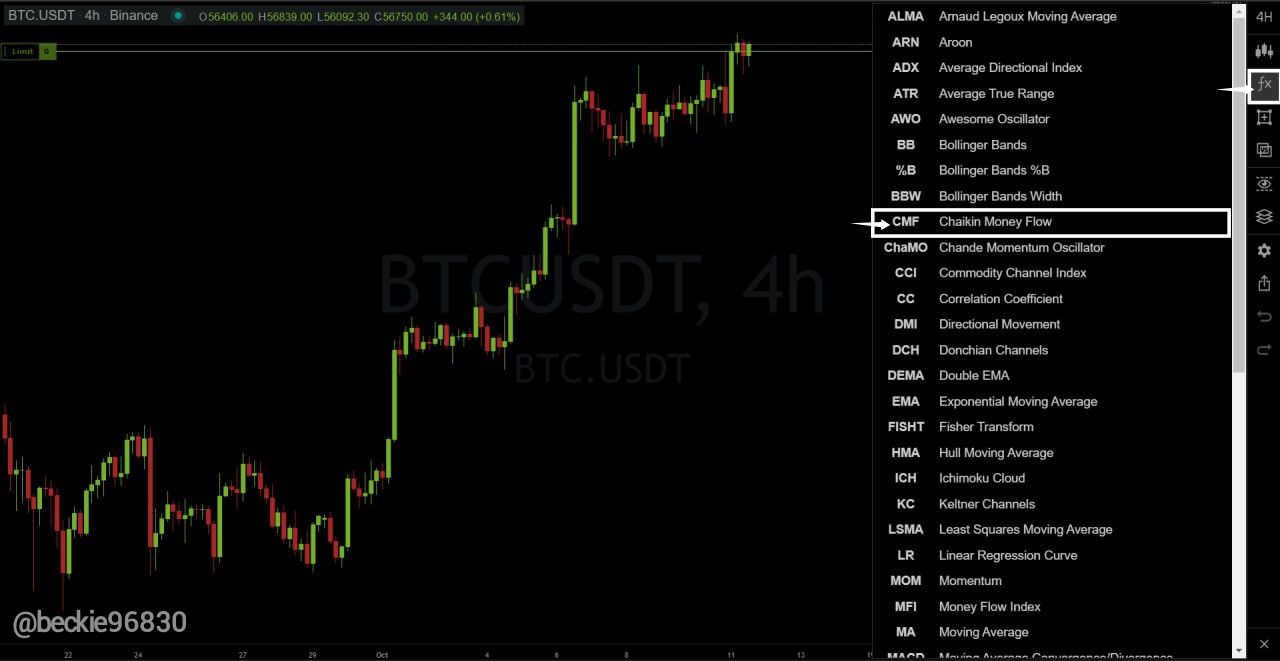
Click on the indicator menu marked Fx on the right vertical menu. Then select the Chaikin Money Flow
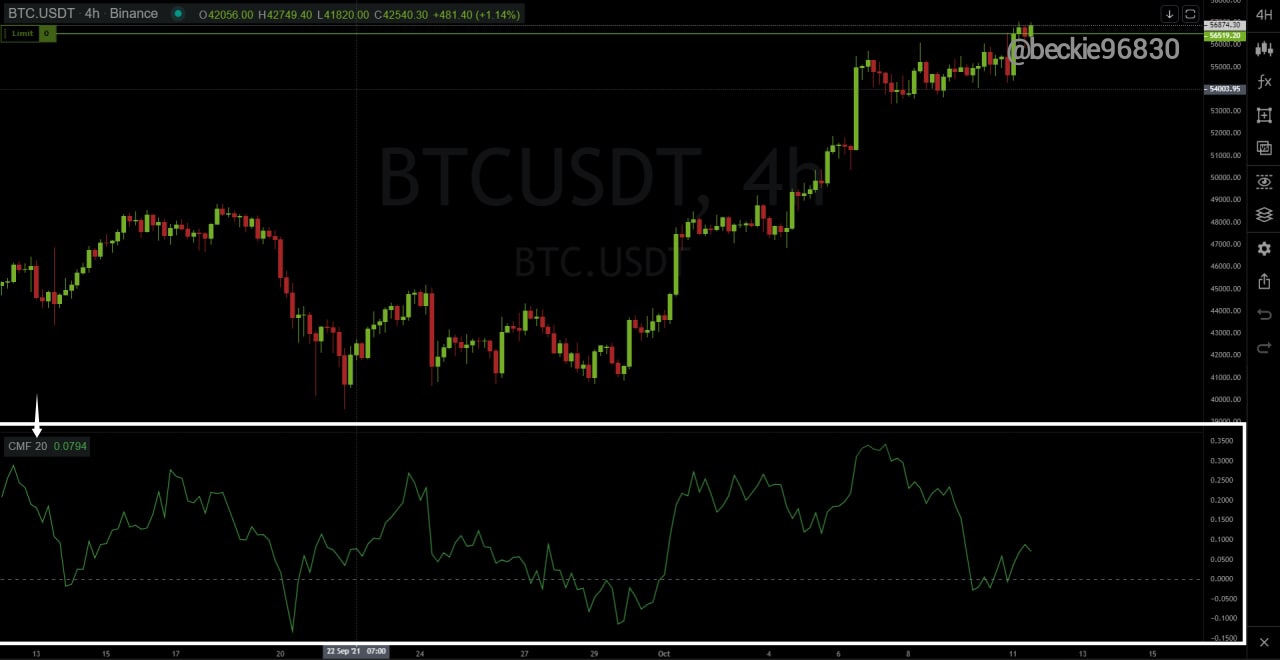
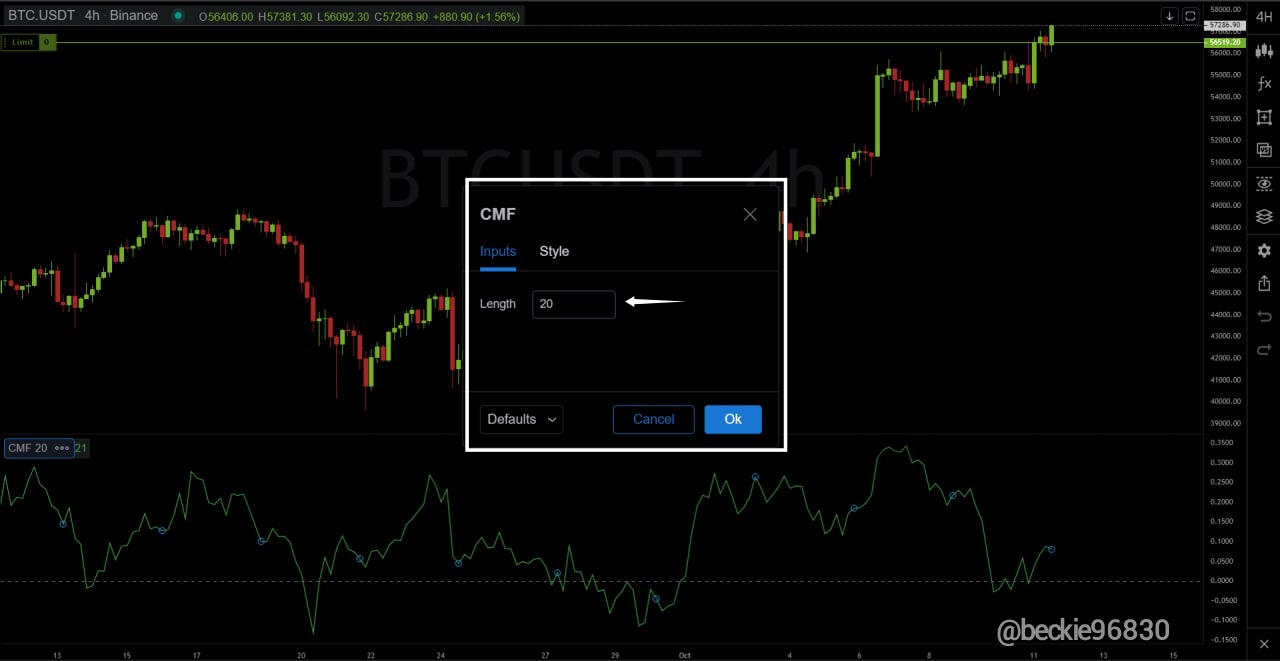
Next, the CMF indicator will be added to the chart with a default period of 20, which I the period of observation chosen by Marc Chaikin
Configuring CMF on Goodcrypto
To configure the click on the indicator name and select settings
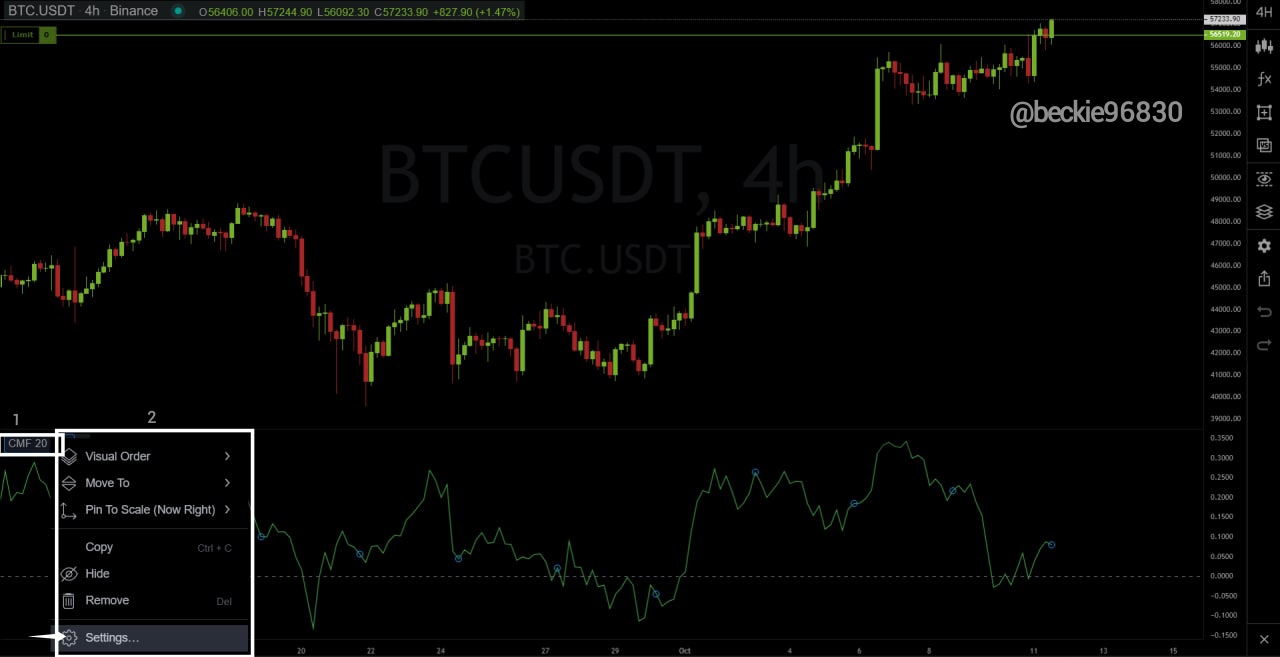
Next, the period can be configured to suit the trader's trading strategy or system.
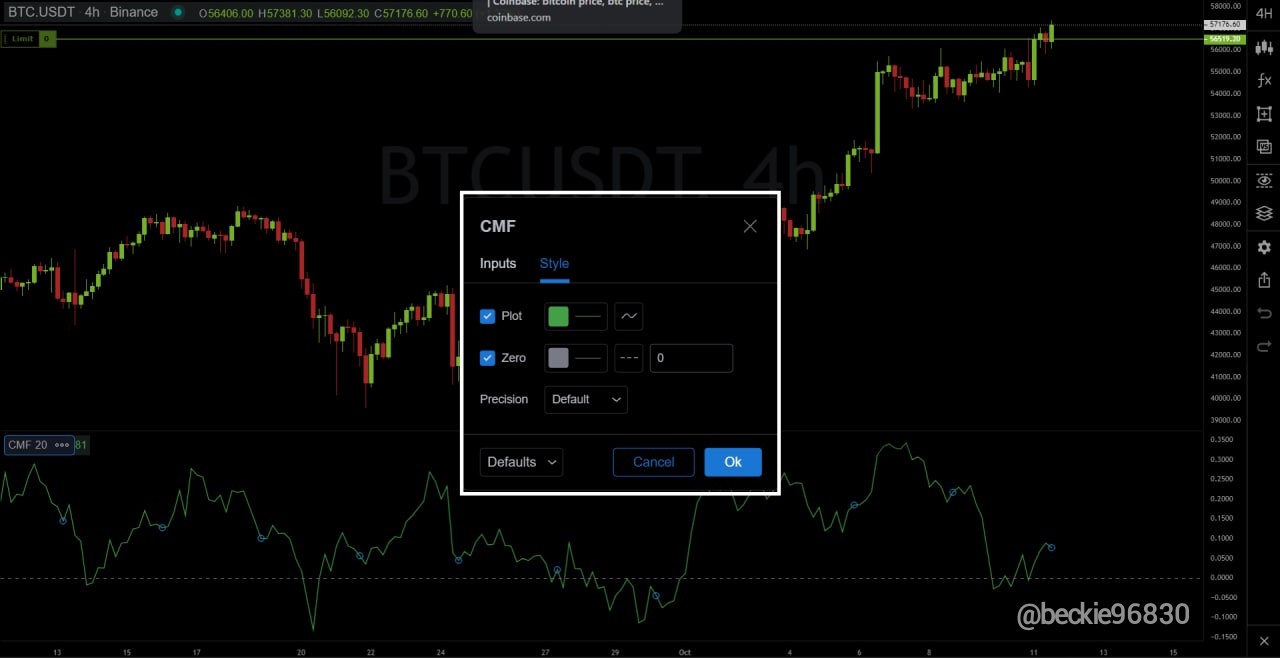
The color scheme of the CMF indicator can be configured by switching to the style tab.
CMF Indicator Settings
The CMF indicator usually has a default period observation of 20 or 21, this was the period chosen by the indicator developed by Marc Chaikin. But the best setting depends on the trading system used and the type of asset traded. A short-term trader will use shorter indicator periods, while a long-term trader will use higher indicator settings.
The best setting can be determined through backtesting of the indicator strategy, and also to determine the CMF indicator behavior when combined with other technical indicators like exponential moving average EMA, and price action.
Question 3
What is the indicator’s role in confirming the direction of the trend and determining entry and exit points (buy/sell)؟(screenshot required)
CMF and Trends
The CMF indicator indicates the buying and selling pressure based on money flow volume within a given period, through its oscillation between the absolute values 1 and -1. The CMF indicator confirms a trend closer to the absolute values since positive values indicate increasing volume to the upside (bullish move) and negative values indicate increasing volume to the downside (bearish move).
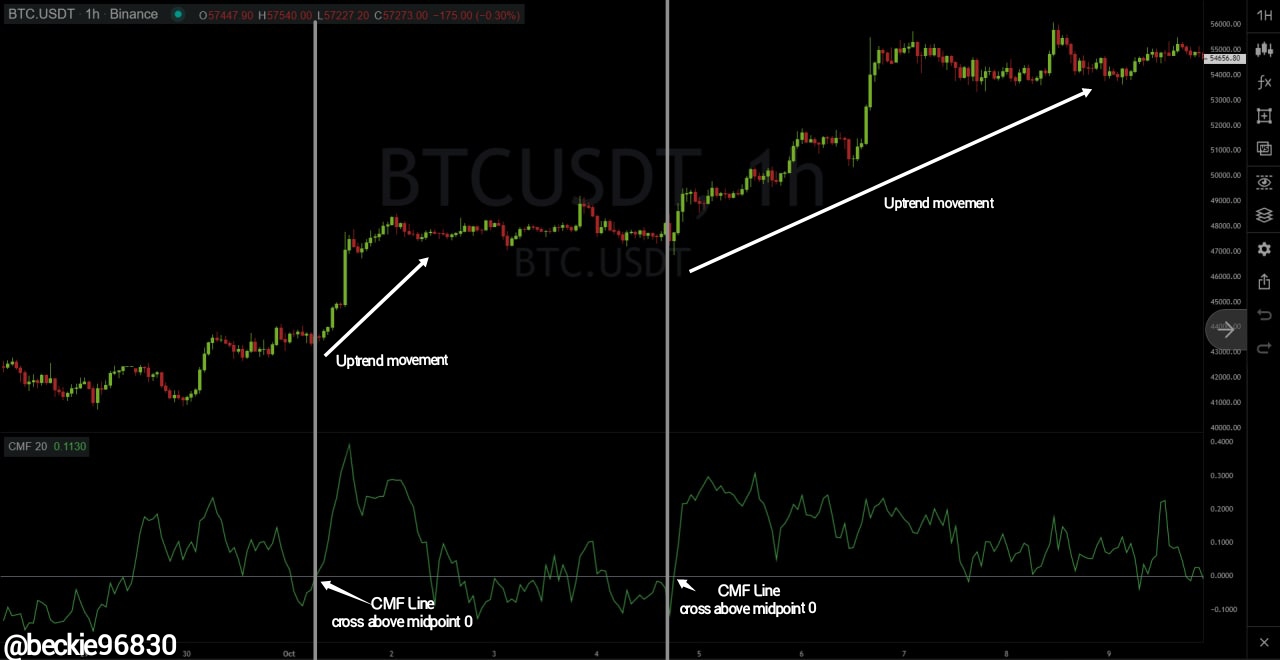
In an uptrend, the CMF indicator confirms the trend by moving above the midpoint value 0, and moving towards increasing positive values, this indicates the continuous increase in volume and price (accumulation) taking place in the market.
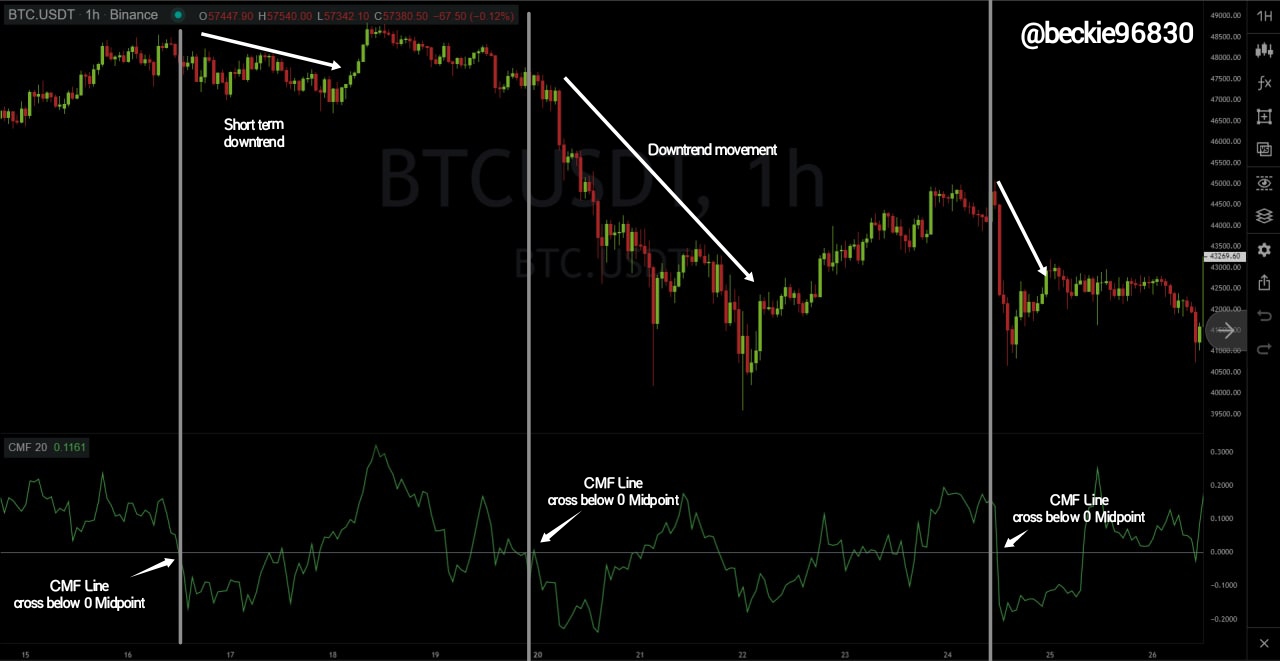
In a downtrend, the CMF indicator confirms by moving below the midpoint 0, and moving towards the increasing negative values, this indicates the continuous increase in volume and decrease in price (distribution) of the asset in the market.
Entry and Exit points using CMF indicator
Ideally, CMF indicator signal is generated with the cross of the indicator line above or below the midpoint 0, where a movement upwards shows an increasing buying pressure, which yields positive indicator values, indicating an increasing accumulation of the asset, and a movement downward which shows an increasing selling pressure, which yields negative indicator values, indicating an increasing distribution of the assets.
1- Buy Entry and Exit Points
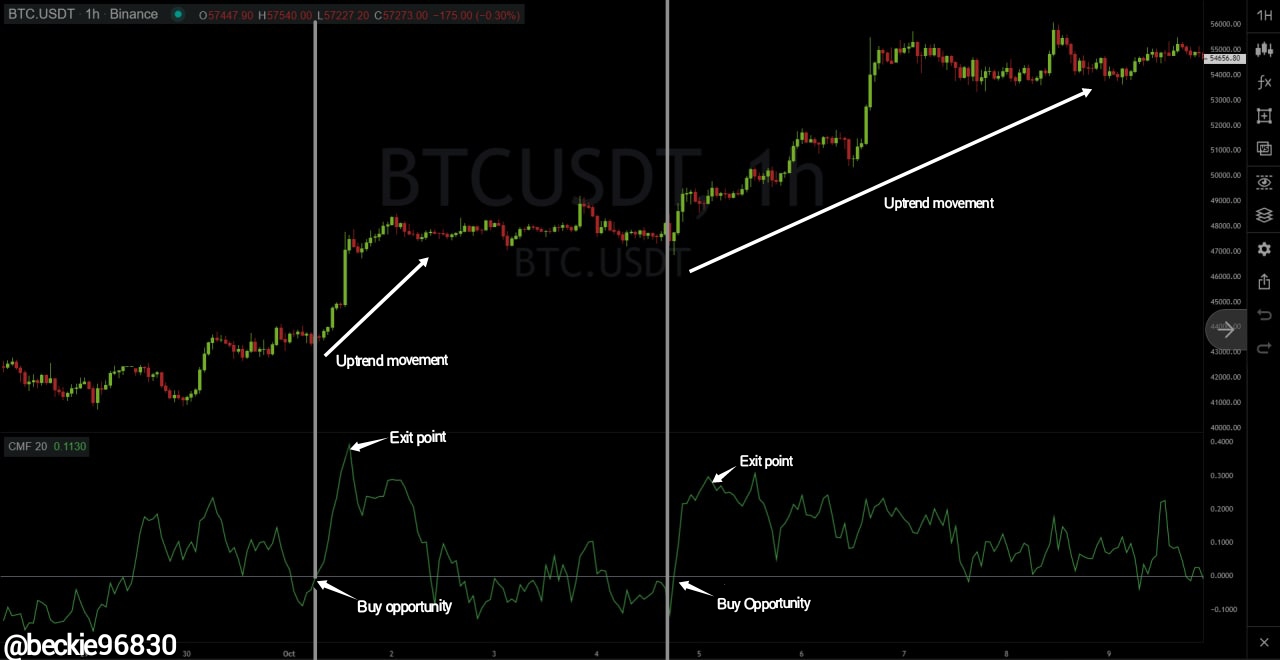
From the BTCUSDT chart, the buy entry points are marked with Buy Opportunity, as the CMF indicator line cross above the midpoint 0, this results in positive CMF indicator values followed by bullish movement of price. The exit should be once the CMF indicator line starts moving in the opposite direction.
2- Sell Entry and Exit Points
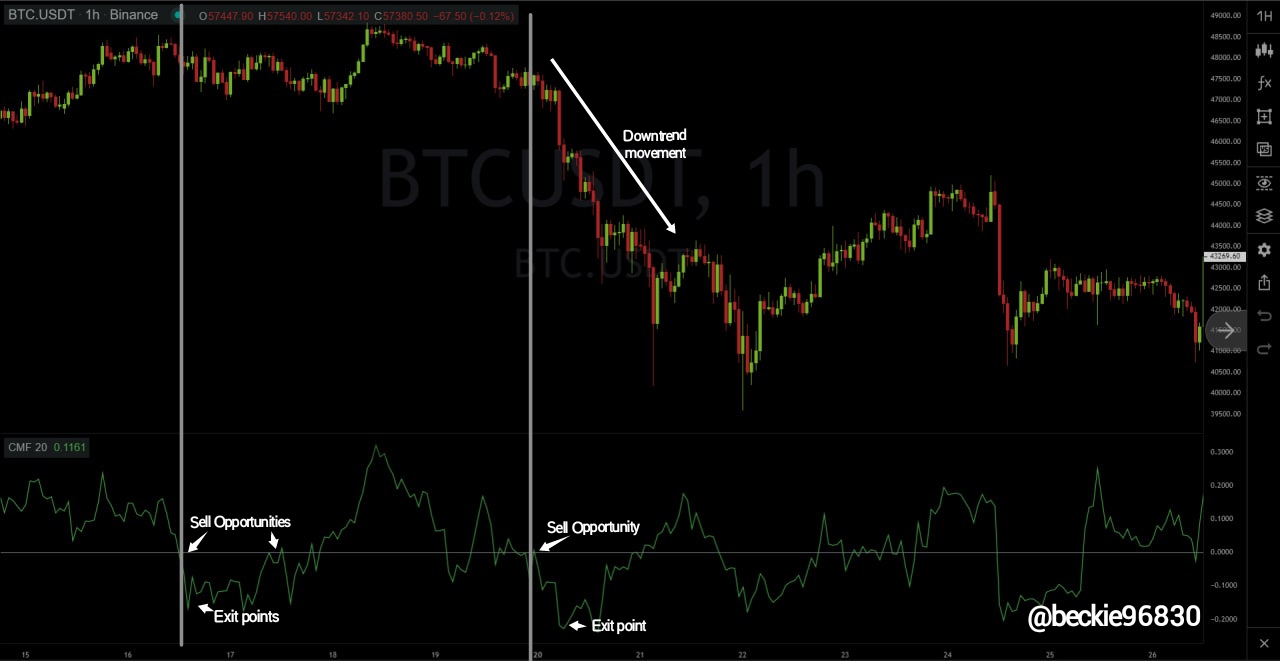
From the BTCUSDT chart, the buy entry points are marked with Sell Opportunity, as the CMF indicator line cross below the midpoint 0, this results in negative CMF indicator values followed by bearish movement of price. The exit should be once the CMF indicator line starts moving in the opposite direction.
Question 4
Trade with a crossover signal between the CMF and wider lines such as +/- 0.1 or +/- 0.15 or it can also be +/- 0.2, identify the most important signals that can be extracted using several examples. (screenshot required)
CMF Crossover Strategy
The CMF Crossover indicator strategy involves the crossing of predetermined values that corresponds on the negative or positive (+/-) side. The corresponding values can be from +/-0.1, +/- 0.15, or +/- 0.2
Ideally, a crossover buy signal is when the CMF line cross above the 0.1 from below following a corresponding move from below the -0.1, while a sell signal is when the CMF line cross below the -0.1 from above, following a corresponding move from below the 0.1 level.
consider the illustration below, using the +/-0.1 and +/-0.15 levels
Scenario 1- BTCUSDT (+/-0.1)
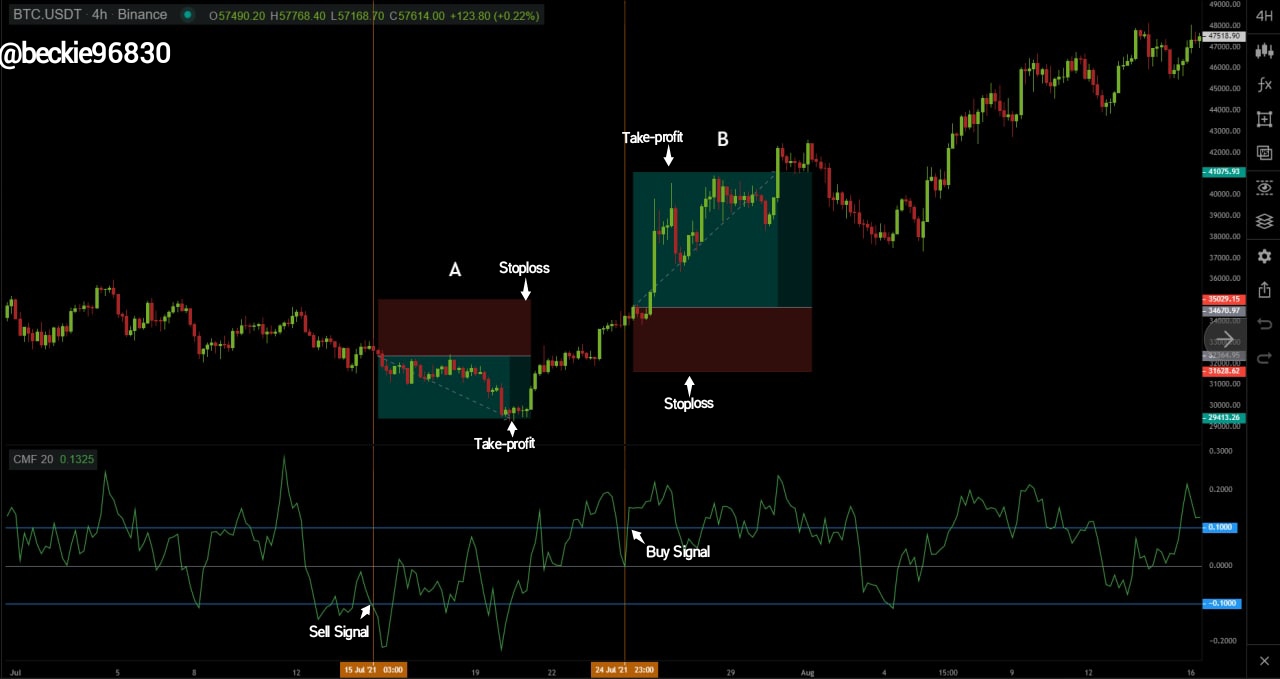
From the above BTCUSDT chart, a buy and sell signal trade was take based on the CMF indicator crossover strategy. The part Labelled A and B.
Part A
The CMF indicator line crossed below the -0.1 level, moving from above the 0.1 level. The cross is a sell signal, a sell trade can be executed once the cross happens, but a conservative trader will wait for the close of the current candle before executing.
Stoploss is placed just above the previous high point and the take-profit can be placed in a ratio of 1:1 or close the order once the CMF line cross above the 0.1 level.
Part B
The CMF indicator line crossed above the 0.1 level, moving from below the -0.1 level. The cross is a Buy signal, a buy trade can be executed once the cross happens, but a conservative trader will wait for the close of the current candle before executing.
Stoploss is placed just below the previous low point and the take-profit can be placed in a ratio of 1:1 or close the order once the CMF line cross below the -0.1 level
Scenario 2- ETHUSDT (+/-0.15)
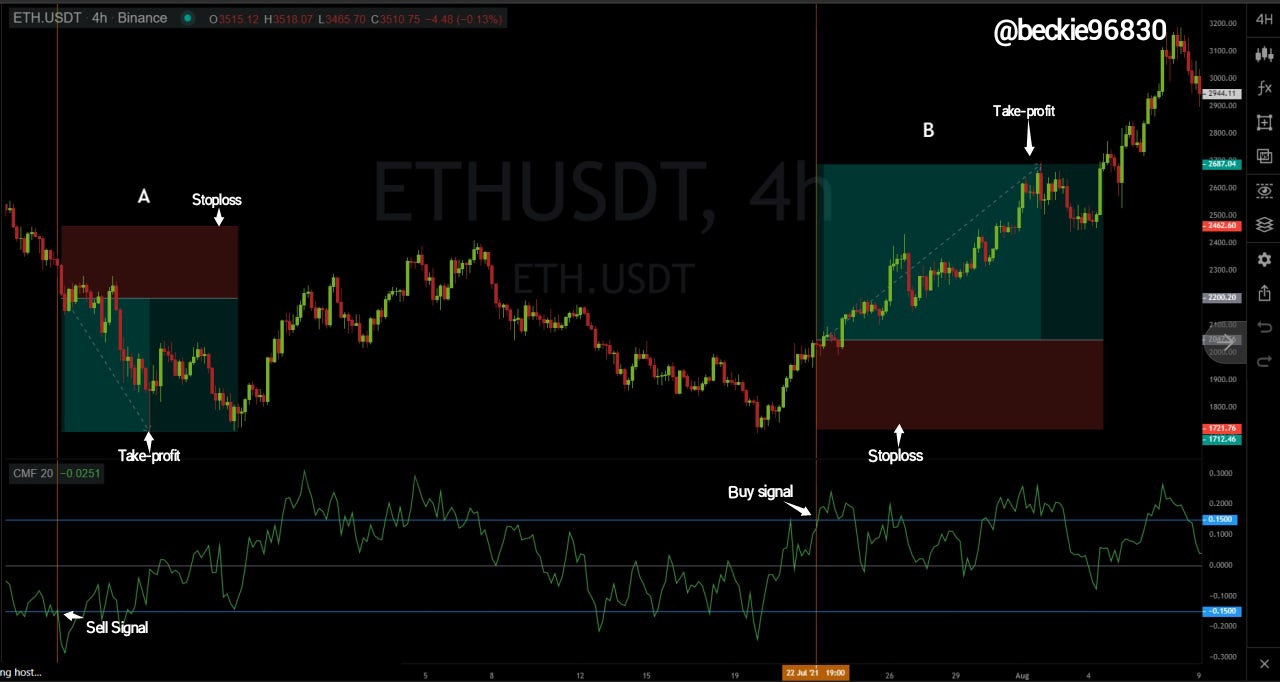
From the above ETHUSDT chart, a buy and sell signal trade was take based on the CMF indicator crossover strategy. The part Labelled A and B
Part A
The CMF indicator line crossed below the -0.15 level, moving from above the 0.15 level. The cross is a sell signal, a sell trade can be executed once the cross happens, but a conservative trader will wait for the close of the current candle before executing.
Stoploss is placed just above the previous high point and the take-profit can be placed in a ratio of 1:1 or close the order once the CMF line cross above the 0.15 level.
Part B
The CMF indicator line crossed above the 0.15 level, moving from below the -0.15 level. The cross is a Buy signal, a buy trade can be executed once the cross happens, but a conservative trader will wait for the close of the current candle before executing.
Stoploss is placed just below the previous low point and the take-profit can be placed in a ratio of 1:1 or close the order once the CMF line cross below the -0.15 level
Observation
The +/-0.1 crossover line generates distorted signals sometimes, as minor volume pumps can be represented as valid trade signals. But the +/-0.15 generates more reliable trade signals which are not frequent compared to that of the +/-0.1 crossover line.
Question 5
How to trade with divergence between the CMF and the price line? Does this trading strategy produce false signals?(screenshot required)
CMF Indicator and Trend Divergence
Divergence occurs when there is a difference in direction between the CMF indicator line and the movement of price. Divergence in most cases signals early trend reversal before price movement will follow.
1- CMF Bullish Divergence
A bullish divergence occurs when the CMF indicator line signals a bullish move, where the current indicator high is higher than the previous, while the movement of price is bearish. This divergence often precedes a bullish trend reversal since the CMF indicator shows the money flow between the buyers and the sellers in a market.
High-risk-based traders take advantage of the divergence in anticipation of price movement based on volume, while conservative traders wait for the bullish movement indication of price to start.
Consider the illustration below
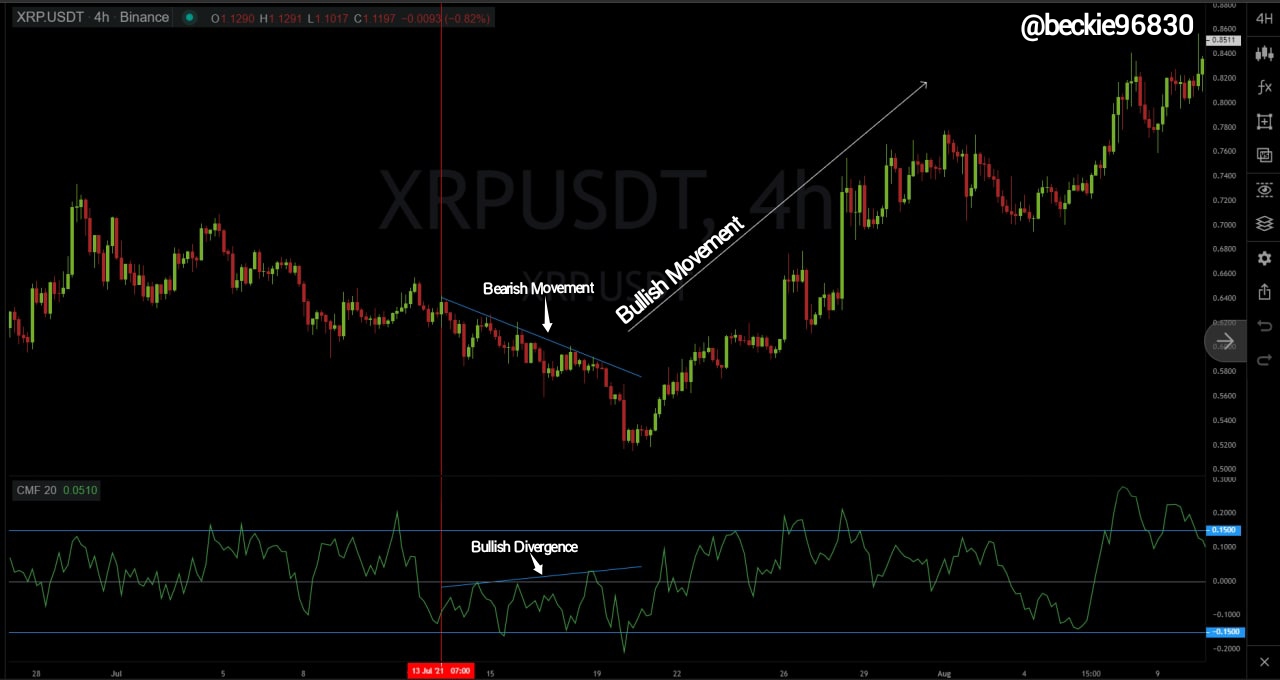
Observing the XRPUSDT chart above, a bullish divergence was formed, where the CMF indicator line printed a sequence of higher highs, while the movement of price formed a sequence of lower highs. As observed, the bullish divergence was followed by a bullish movement of price, which validates the trend increasing buying pressure (accumulation) signal of the bullish divergence.
2- CMF Bearish Divergence
A bearish divergence occurs when the CMF indicator line signals a bearish move, where the current indicator line high is lower than the previous, while the movement of price is bullish. The divergence is followed by a bearish trend reversal since the CMF indicator shows the money flow between the buyers and the sellers in a market.
High-risk-based traders take advantage of the divergence in anticipation of a trend reversal, while conservative traders wait for the bearish movement of price to start.
Consider the illustration below
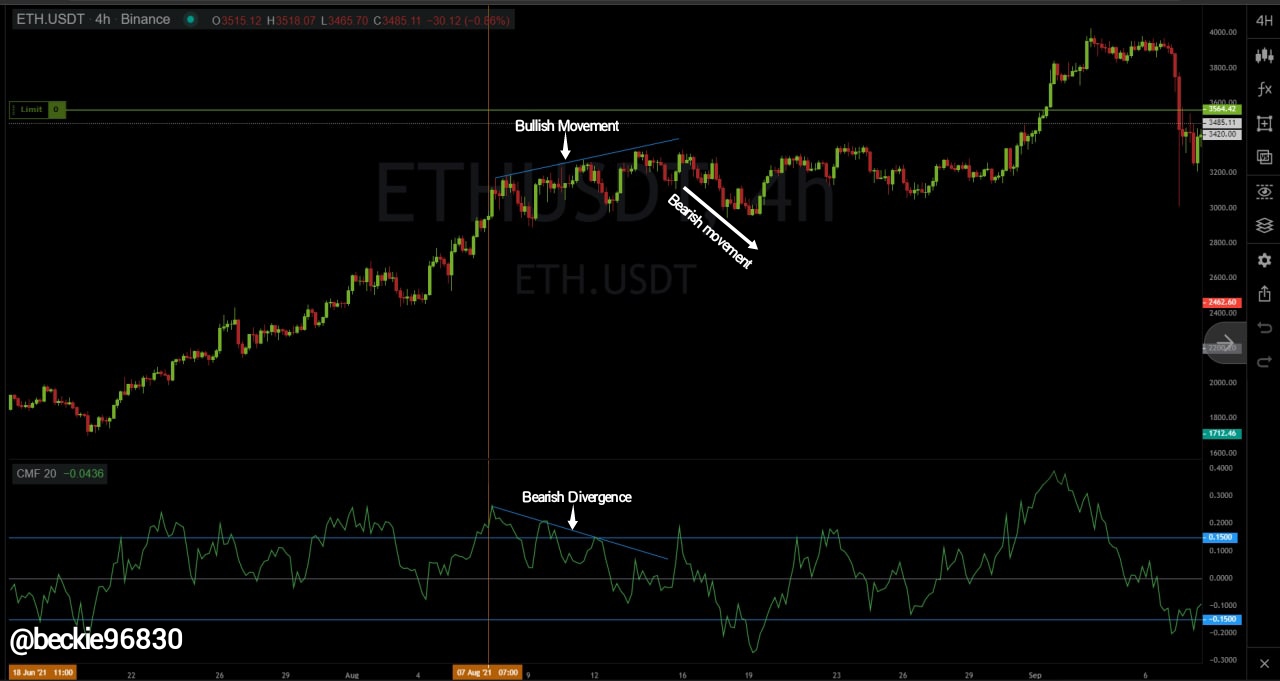
Observing the ETHUSDT chart above, the bearish divergence was formed, where the CMF indicator line formed a sequence of lower highs, while price formed a sequence of higher highs. A short-term bearish move of price preceded the bearish divergence. Indicating a short-term bearish trend increasing selling pressure (distribution) signal of the bearish divergence.
False CMF Indicator Signals
The CMF indicator can generate false signals as no indicator is 100% efficient. The bullish or bearish divergence can form on the CMF with the movement of price continuing in the unintended direction. The best approach is to combine the CMF indicator with other technical indicators to maximize the quality of investment opportunities and also filter out false signals.
Conclusion
The CMF is a good volume-based indicator, which offers the state of the market in terms of price accumulation and distribution, which helps investors identify areas of price buying and selling pressure. This provides investors with technical insights into which side of the market participants is in control of price at a specified interval.
The CMF indicator should be combined with other technical indicators to Maximize the quality of trade setup and to reduce false signals generated.
Thank you professor @kouba01 for this educative and insightful lesson.
Hello, Sorry for disturbing but I wanted to understand how you got the Period Volume (VP) and the Total Period Volume
Please can you explain to me.
You can use the volume indicator to determine both.
Hello @beckie96830,
Thank you for participating in the 6th Week Crypto Course in its 4th season and for your efforts to complete the suggested tasks, you deserve a Total|9/10 rating, according to the following scale:
My review :
Work with excellent content, because you take every question seriously, allowing you to get answers that are accurate, in-depth in its analysis and clear in its methodology. Here are some notes:
Exactly, Chaikins suggests 21 days as the default setting. That corresponds approximately to a trading month. If the number of periods is larger, the indicator is less volatile and less prone to sideways movements. In a weekly or monthly chart, the number of periods should be reduced.
Most of your answers were successful, with just what is required. Only the last question could have been expanded further in its second part.
Thanks again for your effort, and we look forward to reading your next work.
Sincerely,@kouba01