[On-chain Metrics(Part-3)]- Steemit Crypto Academy- S4W5- Homework Post for professor @sapwood

Question 1
How do you calculate Relative Unrealized Profit/Loss & SOPR? Examples? How are they different from MVRV Ratio(For MVRV, please refer to this POST)?
1- Relative Unrealized Profit/Loss
The Relative unrealized profit/loss (RUPL) is a type of on-chain metrics that account for an assets unrealized value in either profit or loss by evaluating the difference between market capitalization and the realized cap while considering the total supply of the asset at any given interval.
Ideally, the market cap sorts for the overall value of the network, while the realized cap sorts for the actual value of the network considering the individual differences in price of each UTXO balance at the last transacted (moved) time. The observable difference between these two on-chain metrics (market and realized caps) gives an unrealized estimation value of the network in profit or loss.
Relative Unrealized Profit/Loss Calculation
To ascertain the unrealized profit or loss value of an asset's UTXO balances with respect to the circulating supply requires subtraction of the realized price (actual value) from the current price (overall estimation), such that:
A Positive value from (current price - realized price) gives the unrealized profit.
While;
A Negative value from (current price - realized price) gives the unrealized loss.
To quantify the relative unrealized profit or loss with respect to the market cap and considering time, the unrealized profit or loss obtained is divided by the market cap, such that:
Relative unrealized profit/loss = (Market cap - realized cap) / Market cap.
Let's consider an example:
Assuming an asset Crypto X has a market cap of $45,300,000 and a realized cap of $20,100,000. The unrealized profit/loss and relative unrealized profit/loss is calculated thus:
1- The unrealized profit/ loss
Unrealized profit/loss = $45,300,000 - $20,100,000
Unrealized profit = $25,200,000
Since it's a positive value, Crypto X network unrealized profit is $25,200,000.
2- Relative unrealized profit/loss
To calculate Crypto X relative unrealized profit:
Relative unrealized profit/loss = ($45,300,000 - $20,100,000) / 45,300,000
Relative unrealized profit/loss = 0.5562.. which is equivalent to 0.56 to 2sf.
Observation
With the above relative unrealized profit of 0.56, the crypto X market is observed to be within the greed zone, and if the relative unrealized profit value keeps increasing and approach above the 0.75 (euphoria zone), this indicates a historical cycle top and a dip is anticipated.
2- Spent Output Price Ratio (SOPR)
The Spent output price ratio is a type of on-chain metrics that sorts the ratio of a spent UTXO price to the initial price of the UTXO at creation. This on-chain metrics calculation is used to determine the swing points (tops and bottoms) within a cycle. Ideally, spent output price ratio that is significantly above 1 indicates price is approaching a swing high while a spent output price ratio reading significantly below 1 indicates that price is approaching a swing low
Spent Output Price Ratio Calculation
The spent output price ratio is calculated by diving the spent output price by the initial created price such that:
SOPR = spent output price / Initial created price
Let's consider an example:
Assuming an asset Crypto X has a spent UTXO of 10 X at the current market price of $100. The 10 A was created at the initial price of $65. The SOPR will be calculated thus:
SOPR = Spent output price / Initial created price
where the:
Initial created price = 10 × $65 = $650
Spent output price = 10 × $100 = $1000
The spent output price ratio will be calculated thus:
SOPR = $1000 / $650
SOPR = 1.5384.. which is equivalent to 1.54 to 2sf.
Observation
The spent out price ratio is above 1, it is considered that the investor (owner of crypto X) is in profit. Which is about 53.8462%.
RUPL, SOPR and MVRV Ratio
The Relative unrealized profit/loss (RUPL) ratio focus on the ratio of unrealized profit or loss to the current market value, indicating the overall unrealized profit or loss with respect to the total circulating supply of the asset.
The Spent Output Price Ratio (SOPR) focuses on the net profit or loss ratio of spending a UTXO balance in line with the current market price.
While MVRV ratio focus on the average fair value ratio of an asset indicating the valuation of the network in a profit or loss with respect to market capitalization and the realized capitalization. MVRV ratio also outlines the overall network value in terms of undervalued and overvalued, while signaling potential possible moves.

Question 2
Consider the on-chain metrics-- Relative Unrealized Profit/Loss & SOPR, from any reliable source(Santiment, Glassnode, LookintoBitcoin, Coinmetrics, etc), and create a fundamental analysis model for any UTXO based crypto, e.g. BTC, LTC [create a model to identify the cycle top & bottom and/or local top & bottom] and determine the price trend/predict the market (or correlate the data with the price trend)w.r.t. the on-chain metrics? Examples/Analysis/Screenshot?
please note: the chart analysis used below is for Bitcoin.
Relative Unrealized Profit/Loss
As previously explained, the relative unrealized profit/loss on-chain metrics sort to determine the unrealized with respect to the market cap and time is in profit or loss, where a relative unrealized value between 0 - 0.25 is considered a historical cycle low and a relative unrealized value above 0.75 is considered historical cycle top.
To prove this, a detailed analysis is of the relative unrealized profit/loss was done below
1- Long-term (5 years)
Part A -Historical Cycle Tops
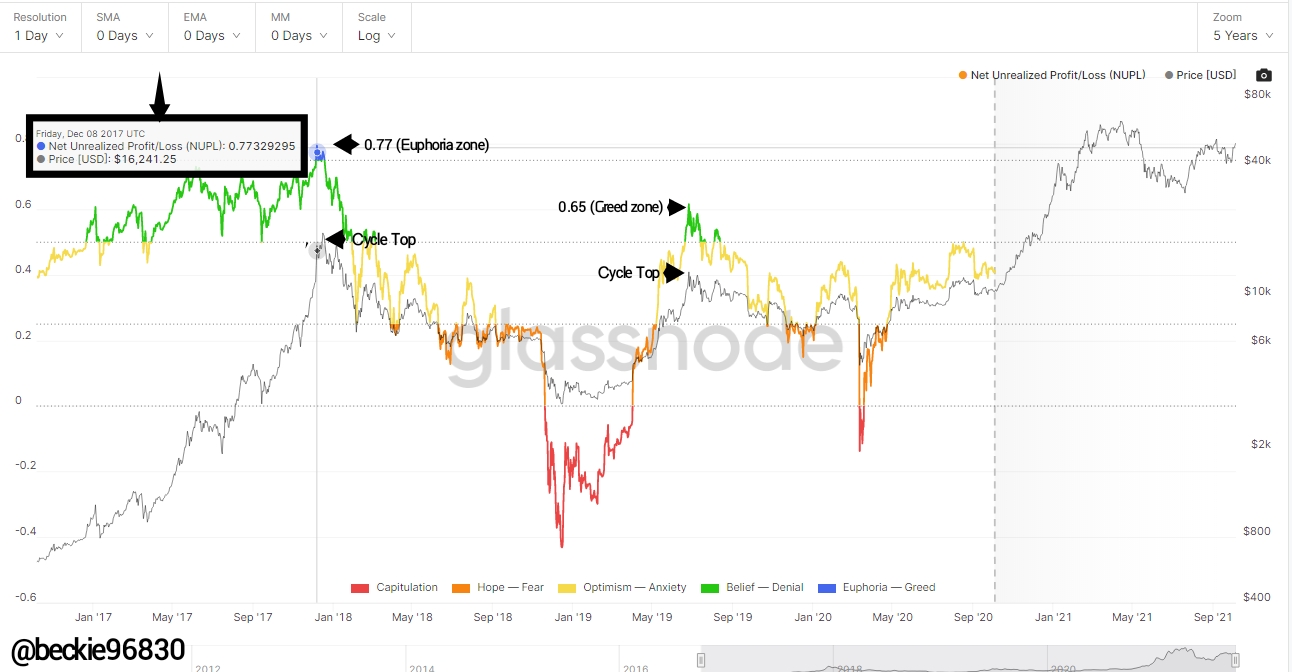
Observing the RUPL Bitcoin image above, on the 08th of Dec 2017, the RUPL reading of BTC was 0.77, where the market psychology cycle is euphoria, while the price of BTC was at $16.2k. As previously observed any RUPL reading above 0.75 is considered within a historical cycle top, where the price tends to meet strong bearish resistance causing a price decline.
Price swung to a historical low which waw drop price to around capitulation zones, before reaching historical cycle top on the 26th of June 2019, which the RUPL reading was 0.61 (Greed Zone), and the price of BTC was $13k.
Part B- Historical Cycle Low
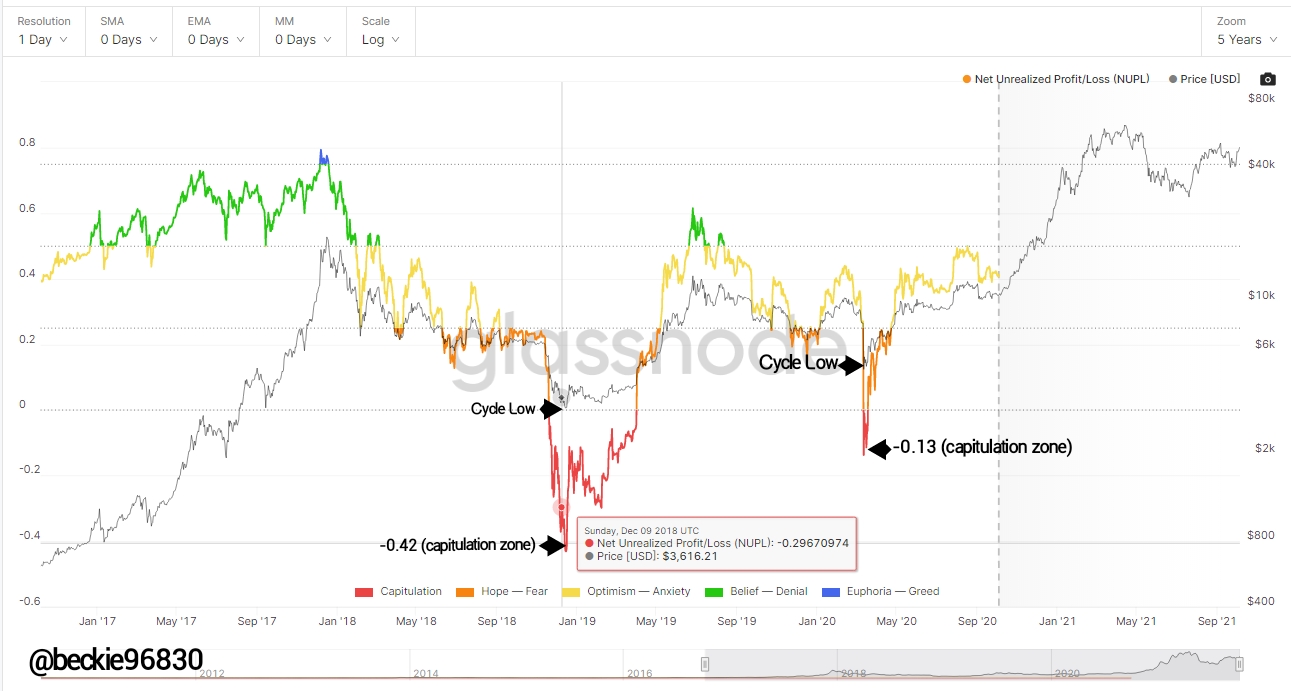
From the RUPL image above, RUPL readings below 0.25 have served as historical cycle lows where the price of BTC meets a strong support, which is followed by price accumulation resulting in a bullish reversal of price.
As observed, on the 09th of Dec 2018 the RUPL reading recorded a -0.29 while the price of BTC was at $3k from the previous historical high of $16.2k with RUPL reading of 0.77.
The historical top at $13k with RUPL reading of 0.61 meet a strong bearish resistance which drove the price to capitulation zones with a RUPL reading of -0.13 while the price of BTC dropped to a low of $4.8k.
Spent Output Price Ratio (SOPR)
As previously explained, the Spent output price ratio sorts the ratio of a spent UTXO price to the initial price of the UTXO at creation. The SOPR metrics calculation is used to determine the swing points (tops and bottoms) within a cycle, where a SOPR reading significantly above 1 indicates price is approaching a swing high while a SOPR reading significantly below 1 indicates that piece is approaching a swing low. I will illustrate below:
1- Long-term (2 years)
Part A- Swing Highs
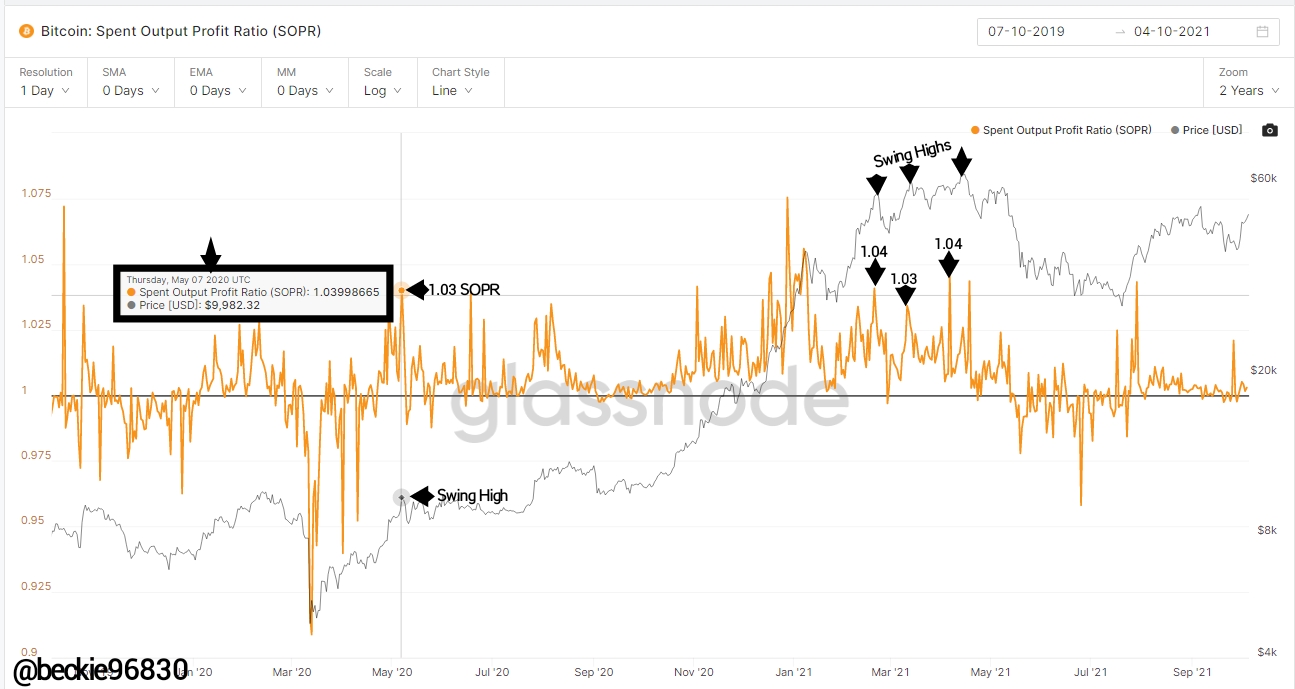
From the SOPR image above, the swing high that formed on the 7th of May 2020, was accompanied by a SOPR reading of 1.03 while the price of BTC was at $9.9k. As previously explained, a SOPR reading above 1 signals a swing high, where the price can possibly encounter bearish pressure, resulting in a decline of price in line with the overall trend.
On the 19th of February 2021, the SOPR reading was 1.04, which signaled a swing high (top), while the price of was $55k, this was followed by a decline in price resulting to the price of price dropping $46k and the SOPR reading 0.99.
Part B- Swing Lows
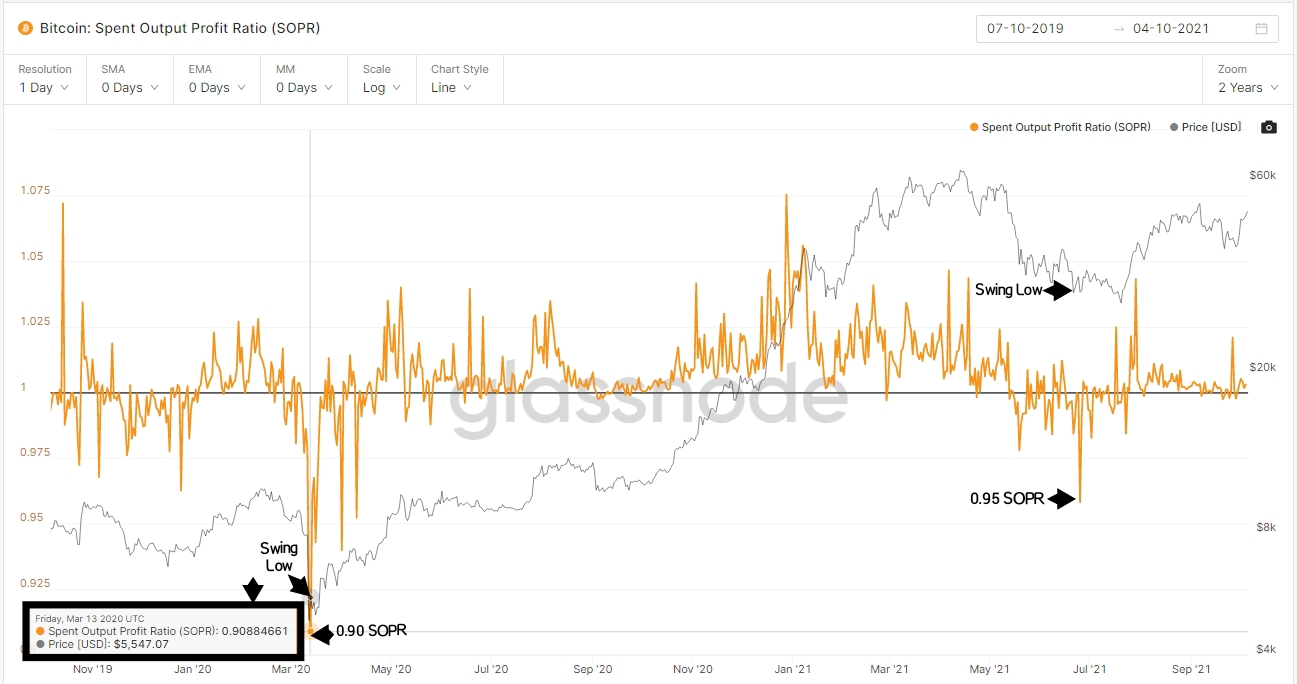
From the SOPR image above, the swing low that formed on the 13th of March 2020, was accompanied by a SOPR reading of 0.90 and the price of BTC was at $5.5k. A bullish moment was encountered as the low SOPR reading indicated swing lows in line with the overall trend. The bullish momentum saw the price of BTC reach $9.9k with a SOPR reading of 1.03.
On the 25th of June 2021 the SOPR reading recorded a low reading on 0.95 with the price of BTC at 31k, this swing low result from the pullback of the $56k swing highs. With the 0.95 low SOPR reading. A bullish momentum was encountered, with BTC price peaking at $52.6k on the 6th of Sept 2021 while the SOPR reading recorded was 1.00.
Question 3
Write down the specific use of Relative Unrealized Profit/Loss(RUPL), SOPR, and MVRV in the context of identifying top & bottom?
RUPL Use Case
The RUPL on-chain metrics through its calculations and chart representation is used in identifying historical cycle tops and cycle bottoms with respect to the market capitalization and the relative time. Ideally, a RUPL reading above 0.75 indicates that price is approaching a historical cycle top where price can possibly meet a bearish resistance as a result of profit-taking by investors. A RUPL reading below 0.25 indicates that price is approaching a historical cycle low where potential price accumulation can occur resulting from discounted pricing of the asset.
Each level of RUPL is represented with a corresponding market psychology cycle like Euphoria, Greed, Denial, Hope, Fear, etc where these human mechanisms can affect trading psychology.
SOPR Use Case
The SOPR on-chain metrics through its calculations and chart representation identify swing tops and bottoms in line with the overall trend, this is done by dividing between spent price and the initial price the UTXO was created. Ideally, a SOPR reading significantly above 1 indicates price is approaching a swing high while a SOPR reading significantly below 1 indicates that price is approaching a swing low.
MVRV Ratio Use Case
The MVRV ratio on-chain metrics identify historical tops and bottoms by indicating the overall state of a market as overpriced or underpriced with respect to the current market capitalization and the realized cap. Ideally, a historical significant MVRV ratio reading above 300% is considered overpriced (tops), while a historical significant MVRV ratio reading below 100% is considered underpriced (bottoms).
Conclusion
The RUPL on-chain metrics and SOPR on-chain metrics are used in tracking the price development of assets from on-chain activities. The RUPL tracks the profit of loss ratio of unspent UTXO with respect to the current price, while the SOPR tracks the profit or loss ratio of spending a UTXO against the current price with respect to the created price. These on-chain activities contribute to the development of price in line with raw price action. All on-chain metrics add to the confluence analysis required before investing in a long-term projection.
Thank you professor @sapwood for this educative and insightful lesson