Crypto Academy / S5W1- Homework Post for @reminiscence01".

What do you understand by a Trending market?
It is known to everyone who knows a little cryptocurrencies that cryptocurrencies or crypto assets are volatile and thus the price of an asset can change in just a split second. For this reason crypto enthusiast came out with a representation of these price movements in a form of a chart. In technical analysis charts serves as the foundation upon which it is carried out.
In a chart representing a crypto asset trends are established thus the price of the asset tend to be going in one direction for some time. Being able to read and interpret these trends in the market can make you a very successful trader. From the explanations made above I will then say that a trending market refers to the price movement of an asset In which the movement is seen to moving in one direction. That is when the price of an asset has been on the increase for some time, it can be said that, that situation is a trending market. A trending market can be either a bullish trend where the price of the asset is seen increasing or in a bearish trend where the price of the asset is seen decreasing for some time.
What is a bullish and a bearish trend? (screenshot required)
BULLISH TREND
We say a market is in a bullish trend when the price of an asset is experiencing a continuous increase. In technical terms we say a market is in a bullish trend when the price of an asset is closing at higher highs than the previous highs. A bullish trend can also be called an uptrend because the candles are seen moving in an upward direction. This is a season where investors tend to take profit.
BEARISH TREND
This is the opposite of a bullish trend. In the crypto sphere we say a market is in a bearish trend when its price is currently closing at lower prices than the previous highs. This means that the asset is experiencing a decline in value or price. This is the ideal time for traders to buy and hold in order to make profit during an uptrend.
Explain the following trend identification and give an example of each of them. (Original screenshot needed from your chart). Do this for a bullish and a bearish trend.
i) Market Structure.
ii) Trendlines
In most cases candlesticks on charts are used for technical analysis the movement of these candlesticks creates a graph that can be called market structure. Market structure is a very common way of identifying market trends. So basically you can be able to tell the current condition of a market using the market structure generated from the candlesticks patterns that are created. I will explain how to use a market structure to identify both a bullish trend and a bearish trend below:
BULLiSH TREND
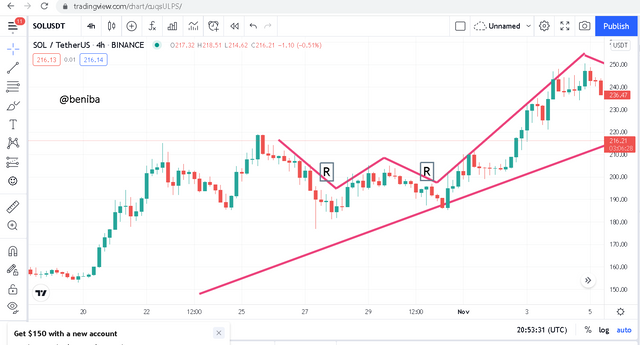
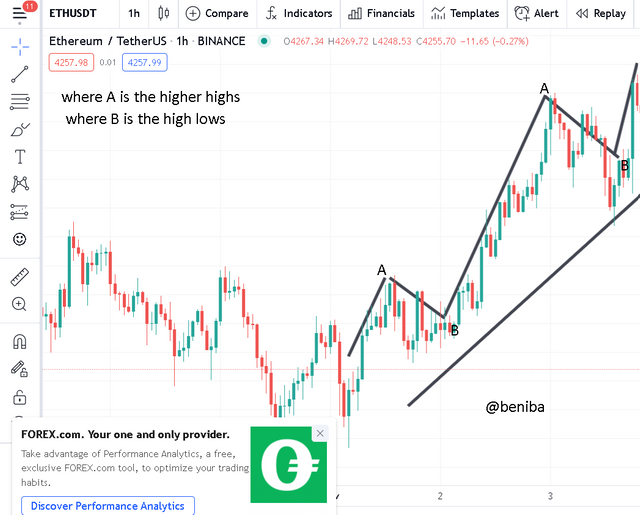
A bullish trend is established when they is high demand or when there is more buying pressure than selling pressure. Bullish market structure is a market structure where the candlesticks are seen moving in an upward directions with some retracements along the way. In this case the price doesn’t trade below the low points of the previous period and closes higher than the previous closing point. Periods of retracement are the right moments to enter into a trade. Below is an image showing a bullish market structure.
BEARISH TREND
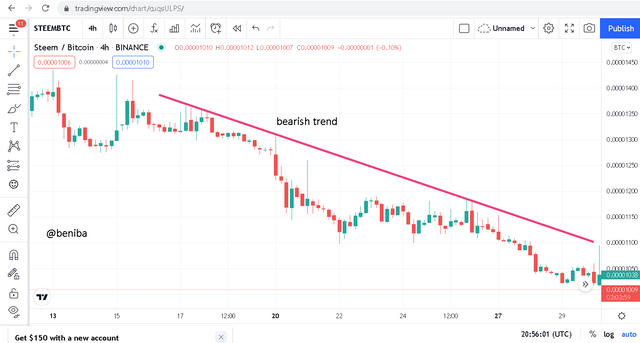
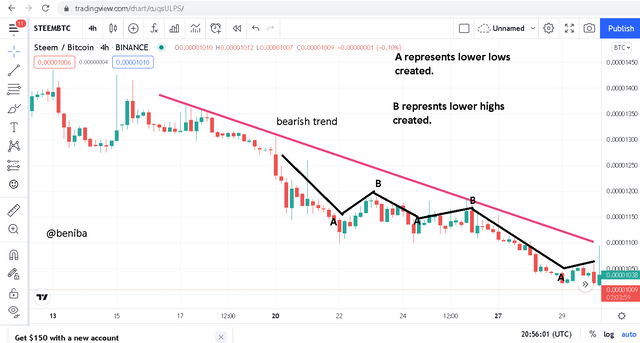
Basically a bearish trend is established when there more selling pressure than buying pressure. This situation tends to make the value of an asset decrease until the buying pressure outweighs the selling pressure. This can be spotted using the market structure when it is seen that the candlesticks are moving in a continuous downward direction. In this scenario the price tends to be trading below the previous low points and closes at a lower price as compared to the previous candlestick. There are also price retracements that occur during the trend.
This is also a very efficient way of identifying market trends. This method makes good use of a straight line that is drawn to either join two low points during a bullish trend or two high points during a bearish trend. This line is the trend or the candlesticks are expected to be completely above the trend line in a bullish trend or completely below the trend line in a bearish trend. If the market moves across the trend line there it implies that a trend reversal has occurred. I will now explain how to identify a bullish or bearish trend using trend lines.
BULLISH TREND
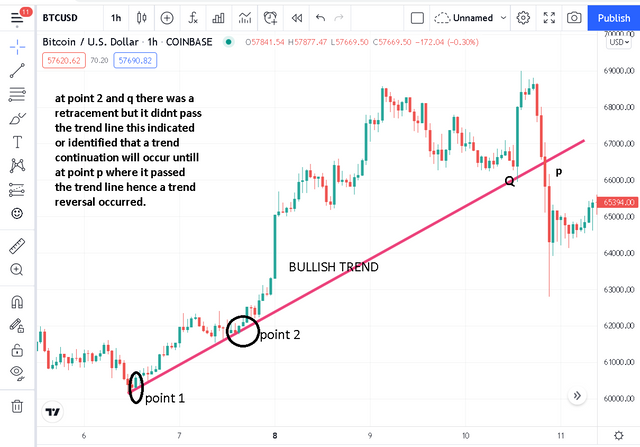
Using a trend line to spot a bullish trend means that a line will be drawn to join two or more low points of the current market. With the line drawn below the candlesticks if there is a price retracement the markets rises after hitting the line but if it continues moving down after touching the line then a trend reversal is been experienced.
BEARISH TREND
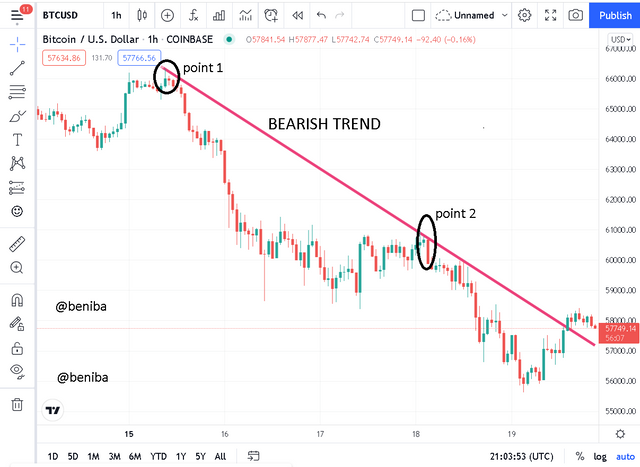
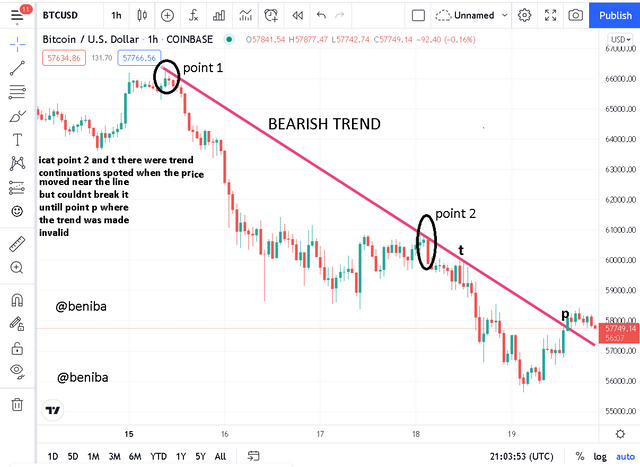
Using a trend line to identify a bearish trend means that a line will be drawn to join two or more high points of the current market. With the line drawn above the candlesticks if there is a price retracement the markets moves down after hitting the line but if it continues moving up after touching the line then a trend reversal is been experienced.
Explain trend continuation and how to spot them using market structure and trendlines. (Screenshot needed). Do this for both bullish and bearish trends.
TREND CONTINUATION
From my explanations made above, I stated that retracements are seen in any trend in the market. This makes the market move in a zig zag pattern regardless the current trend it is in. The moment where the movement of the market where it goes against the current trend but doesn’t go further than the previous high point or previous low point and bounces back to the original trend can be called trend continuations. Retracements are experience due to the practice of buyers and sellers. Retracement in a bullish trend occurs when investors decide to take profit and retracement in a bearish trend occurs when people decide to buy the asset because of its relative low price.
IDENTIFYING TREND CONTINUATION USING MARKET STRUCTURE
BULLISH TREND
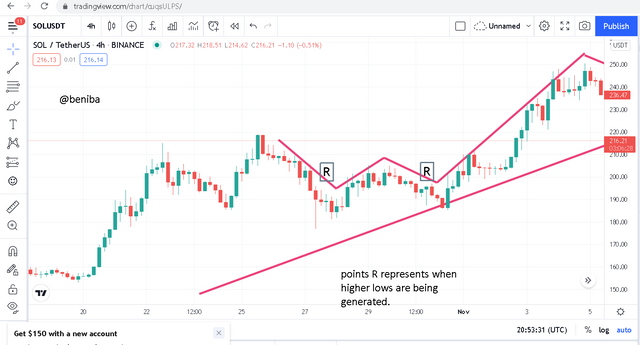
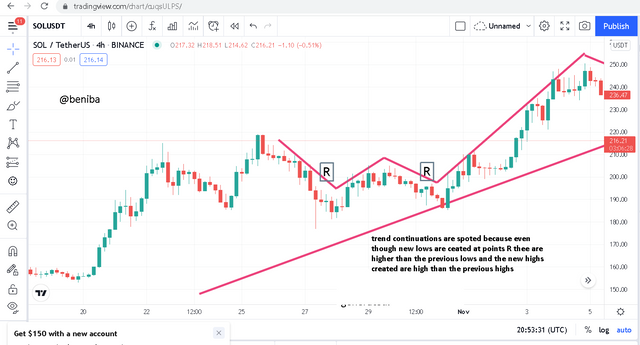
In this scenario there is a retracement during a bullish trend, thus the price tends to be declining hence creating new lows however the lows created do not go below the previous low that existed already. This means that the buying pressure is still in control so the market will continue in the original direction which is the uptrend. After the retracement occurs a new high will be created and this new high must or should be higher than the previous high point.
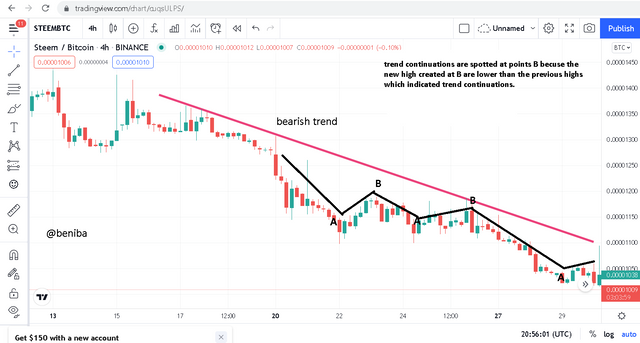
BEARISH TREND
This is a case where there is a retracement during a bearish trend or downtrend. This implies that the price tends to go up for a while creating new highs and suggesting an uptrend but it quickly moves back in the original direction. It must also be noted that the new high created will not exceed or be higher than the high of the previous period. This also indicates that selling pressure is still in control.
IDENTIFYING TREND CONTINUATIONS USING TRENDLINES
BULLISH TREND
As described earlier the trend lined during a bullish trend is obtained by joining two low points in a trending market. The trend line act as a support line which pushes the market to move in the original direction. Trend continuation are seen with trend lines when the market moves and touches or gets near the trend line and immediately there is a continuation of the uptrend. In a case where the market moves below the trend line then there is a trend reversal.
BEARISH TREND
Just like in the bullish trend the trend line in a bearish trend is obtained by drawing a straight line to join two high points in a bearish trend. The trend line acts as a resistance to the price movements. Anytime the markets tend to be appreciating and hits the trend line it moves back and continues in the original direction which is the bearish trend that is it is not able to break the resistance given by the trend line.
Pick up any crypto-asset chart and answer the following questions -
i) Is the market trending?
ii) What is the current market trend? (Use the chart to back up your answers).
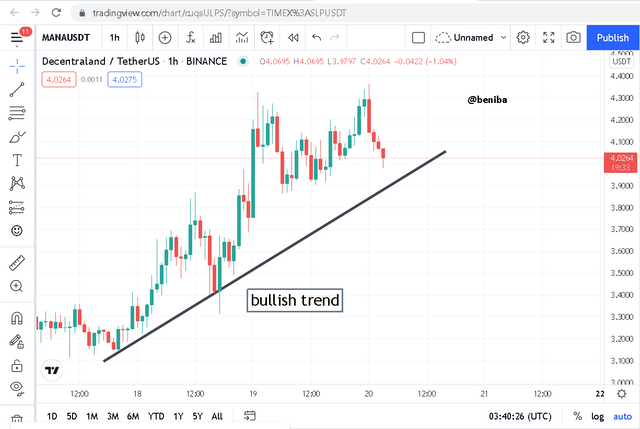
I chose to use decentraland chart for this question. The pair is MAN/AUSDT
I. Yes from the chart a shown below it can be concluded using trend lines that the market is trending.
ii. the current market trend is a bullish trend. As seen in the chart below I drew a trend line which joined two low points and even though there has been some retracements the price movement is still moving above the trend line indicating that the trend is still valid.
In the crypto world especially investment there is a popular saying that “the trend is your friend”. This saying implies that for an investor to be very successful he or she should be able to read and understand the current market trend. Understanding trends will help you make very good and sound decisions in the market. A market can be in a bullish trend, bearish trend or a ranging market. In all these trends there are certain actions that should be taken.
Hello @beniba, I’m glad you participated in the 1st week Season 5 of the Beginner’s class at the Steemit Crypto Academy. Your grades in this task are as follows:
Observations:
This is true when drawing trendlines for all types of trend.
Recommendation / Feedback:
Thank you for submitting your homework task.