Crypto Academy / Season 3 / Week 7 - Homework Post for [@kouba01] … by @benton3
Hello my good friends. Hope we are all doing great. It is once more another week of crypto academy. Presently 8n week 7 of its season 2. This time I will be doing the homework task of @kouba1 where he thrilled us with the topic Trading Crypto With Average Directional Index (ADX) Indicator

Discuss your understanding of the ADX indicator and how it is calculated? Give an example of a calculation. (Screenshot required)
The ADX which means in full "Average Directional Movement Indicator" was developed by Welles Wilder. This indicator measures the strength of price movement in both positive and negative direction using the DMI- and DMI along with it.
It is a non-direction indicator of a trend but measures the strength of the trend. It also assist in filtering false signals in price movements.
The ADX works best when used with other indicators. It does not generate a buy or sell signal rather, it evaluates the trend in the market telling whether strong or weak.
The ADX is measured in a range of 1- 100. The range a particular asset pair is determines the strength or weakness of the the trend it is in at particular period of time.
The table below shows the ranges and what is its interpretation when used or seen on a pairs chart.
| ADX RANGE | INTERPRETATION |
|---|---|
| 0-25 | No trend in the market or it might be very weak. |
| 25-50 | There is visible trend in the market |
| 50-75 | The trend is very strong |
| 75-100 | Extremely strong trend. |
So from the table above, we can see the ranges, the ADX can possibly be in and how it can be interpreted or read.
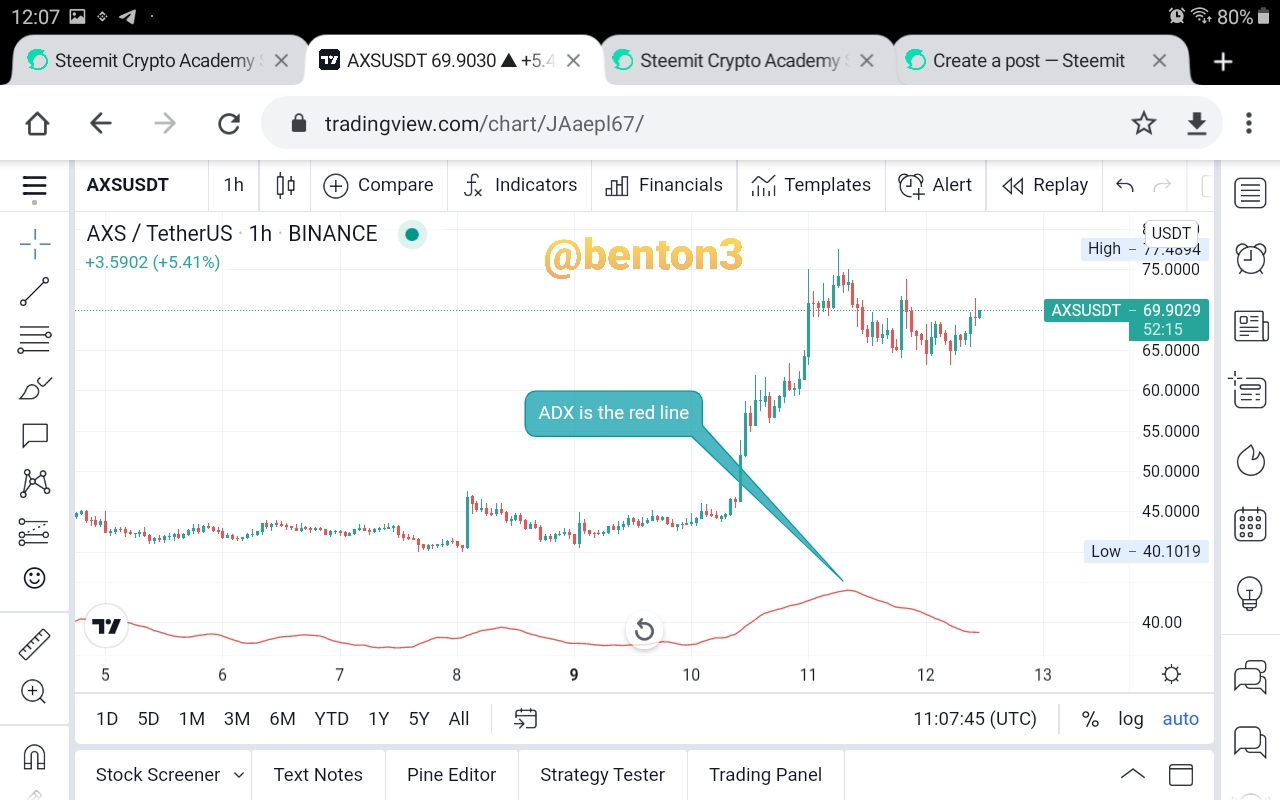
The chart above shows the ADX being added to it.
How ADX Indicator works with DMI
Like I earlier pointed out, the ADX indicator does not work alone. To be more accurate and easier to read, another indicator is added to it. The DMI(Directional Movement index) is added to the chart to do just that. The DMI shows the direction of the market. It helps in measuring the high and lows of the market, making the chart easier to read and enabling us to identify the trend direction.
The DMI provides two addtional curves known as DI+ and DI-. DI+ shows how strong the upward trend is while the DI- shows how strong the downward trend is.
So the ADX works by using the strength of both the DI+ and the DI- , in determining the direction of the market.
This is illustrated below.
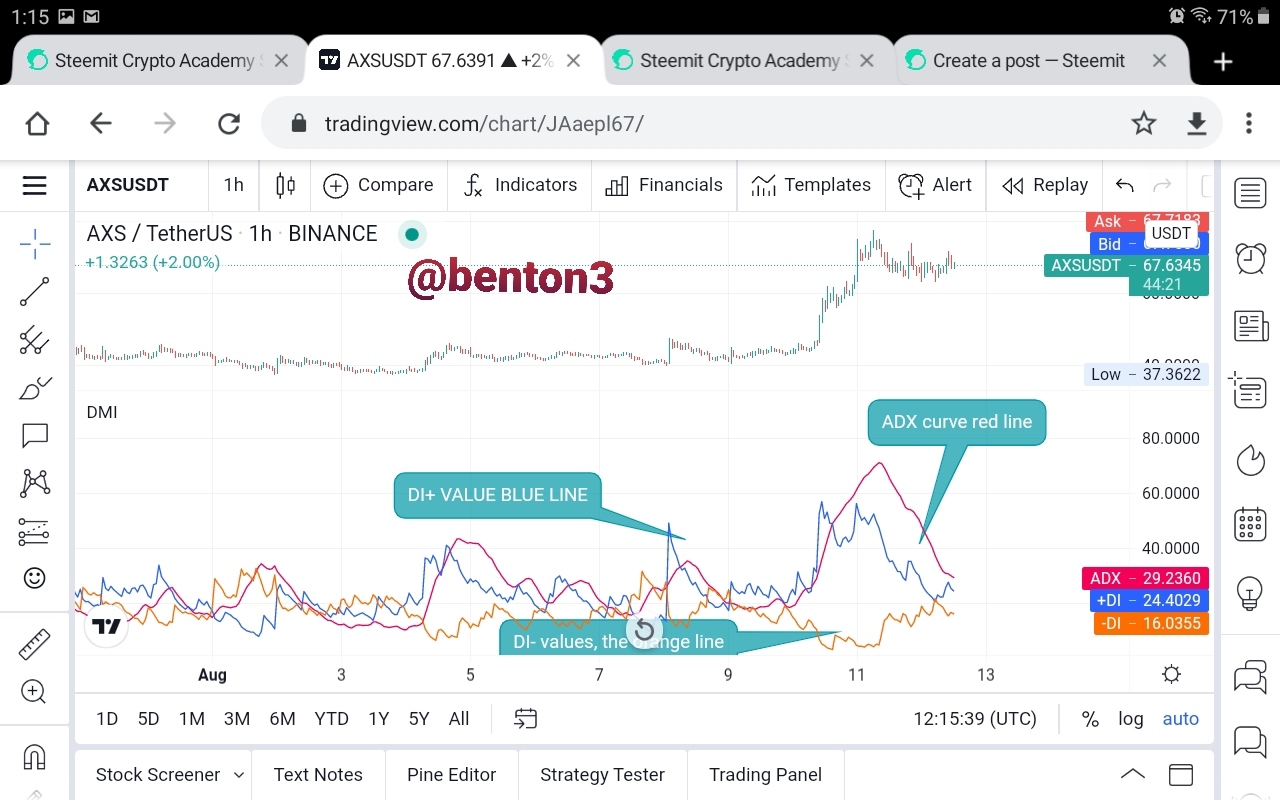
From the screenshot above the
ADX = 29.2360 - red line - determining the overall strength of the trend
DI+ = 24.4029 - blue line - measuring the strength of the upward trend
DI- = 16.0355 - orange line - measures the strength of the downward movement.
We also need to know that when the DI+ is above the DI-, it shows that price is on the increase, and when DI+ is below DI-, it shows that the price is decreasing. This crosses does not indicate a buy or sell signal. So traders need to use other tools to determine whether to buy or sell.
So once the ADX is at above 50, it is signaling a strong movement in a particular direction. Let us remember that ADX does not signify whether a bullish trend or bearish trend but only the strength of a trend.
How it is calculated?
Let us remember that ADX cannot work alone. It works with DMI to measure the strength of a trend. So to calculate ADX, there are other values to be calculated first.
We need to calculate the DMIs and the true range(TR) which we be used to calculate DI+ and DI-.
The formular for calculating the DMI at a particular time is
DMI+ = Day High- Previous High
DMI- = Previous Low - Days Low
The True Range is calculated using the formular below
TR = MAX(|PH- PB|; |PH-C|; |PB -C|)
Where
C - the previous close
PH - current high
PB - current low
Then our DI+ and DI- values will be are calculated as follows
DI+ = DMI+/TR
DI- = DMI-/TR
Then the DX value is calculated.
DX = 100 * ((DI +) - (DI-)) / ((DI +) + (DI-))
While the ADX will be
ADX = Total n [((DI +) - (DI-)) / ((DI +) + (DI-))] / n
EXample of how to calculate it.
Current High - 73.99
Current low - 63.09
Current price74.5 -71.69
Previous low - 55
Previous high - 77
Period 14
Previous close - 66.62
**DMI+ = Day High- Previous High = 74.5 - 72 = 3.5 **
DMI- = Previous Low - Days Low = 60 - 63.09 = - 3.09
We can see that the DMI- is in negative. So automatically, it is zero value.
Let us now calculate our true range.
TR = MAX(|PH- PB|; |PH-C|; |PB -C|)
TR = (|74.5 - 63.09|; |74.50 - 66.62|; |63.09 - 66.62|)
= (10.41; 7.88; -3.53).
The true range maximum is 10.41 as can be seen above.
DI+ = DMI+/TR = 3.5/10.41
DI+ = 0.336
and for DI-
DI- = DMI-/TR = -3.09/10.41
** = -0.297**
To now calculate the ADX we will use this formular
ADX = Total n [((DI +) - (DI-)) / ((DI +) + (DI-))] / n
ADX = 14[((0.336) - (-0.297)) / ((0.336) + (-0.297))]/14
ADX = 14[(0.633/0.039)]/14
ADX = 227.230/14
ADX = 16.230
So The ADX is 16.230, so there is no trend indication at all since it is within the range of 0-25.
How to add ADX, DI+ and DI- indicators to the chart, what are its best settings? And why? (Screenshot required)
I will demonstrate that using my tradingview account.
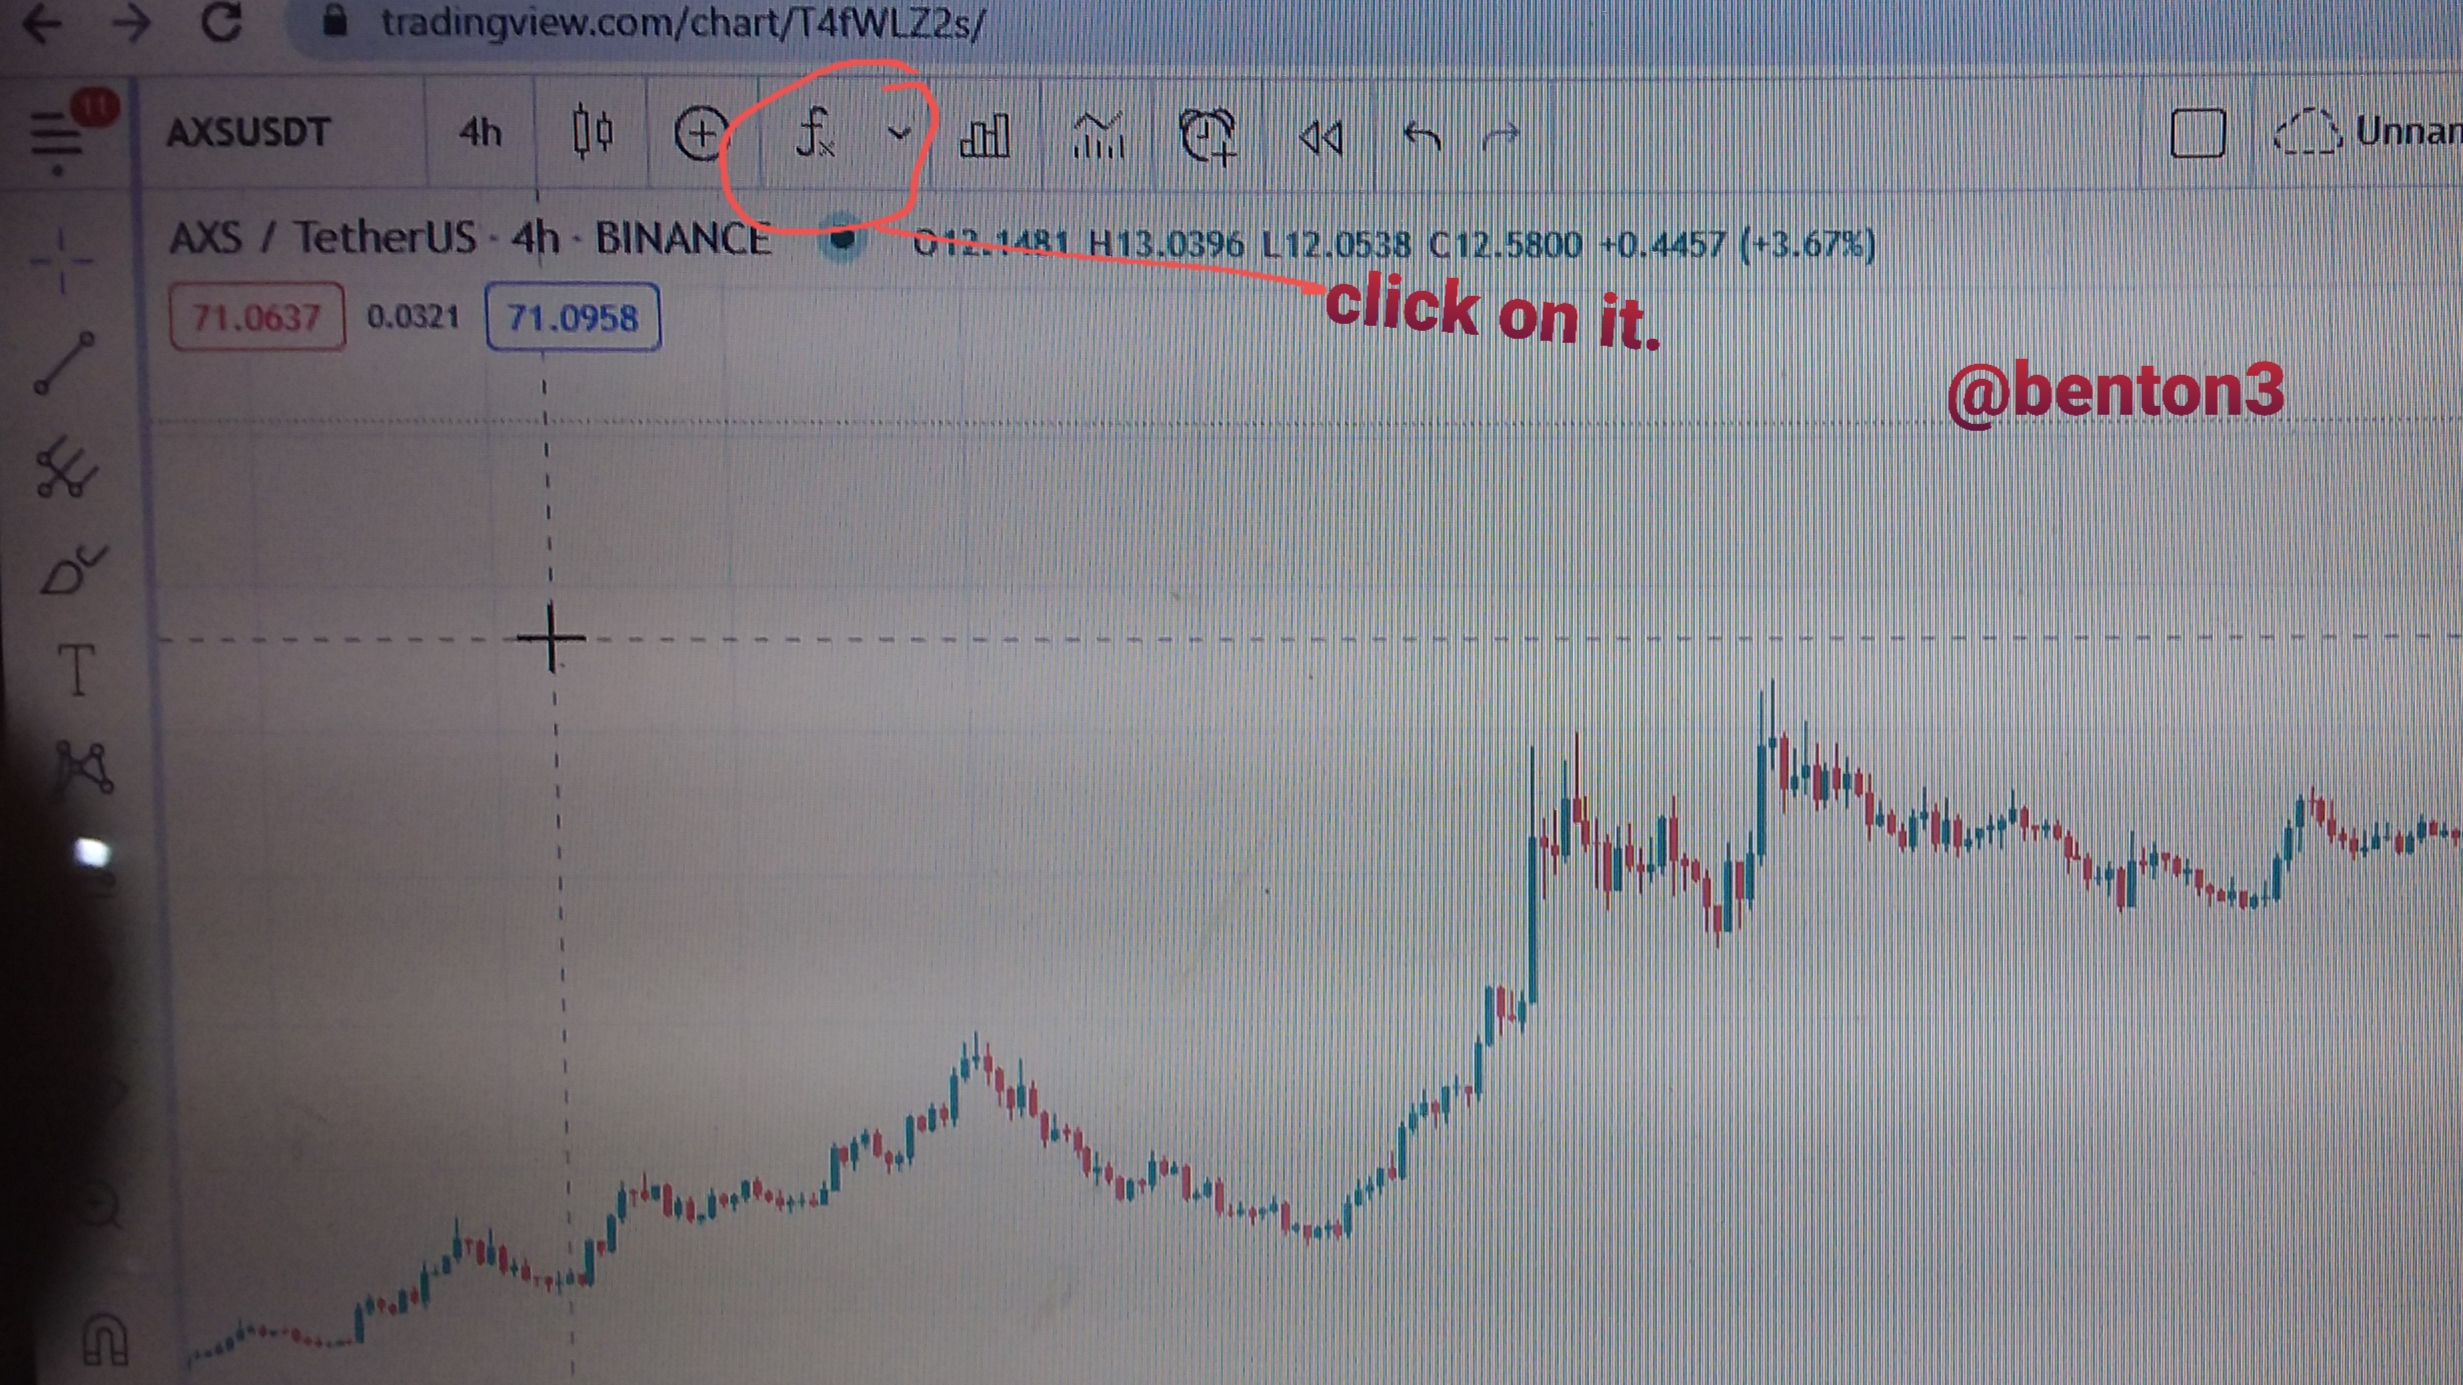
Once the website is open and the chart is on the screen, then
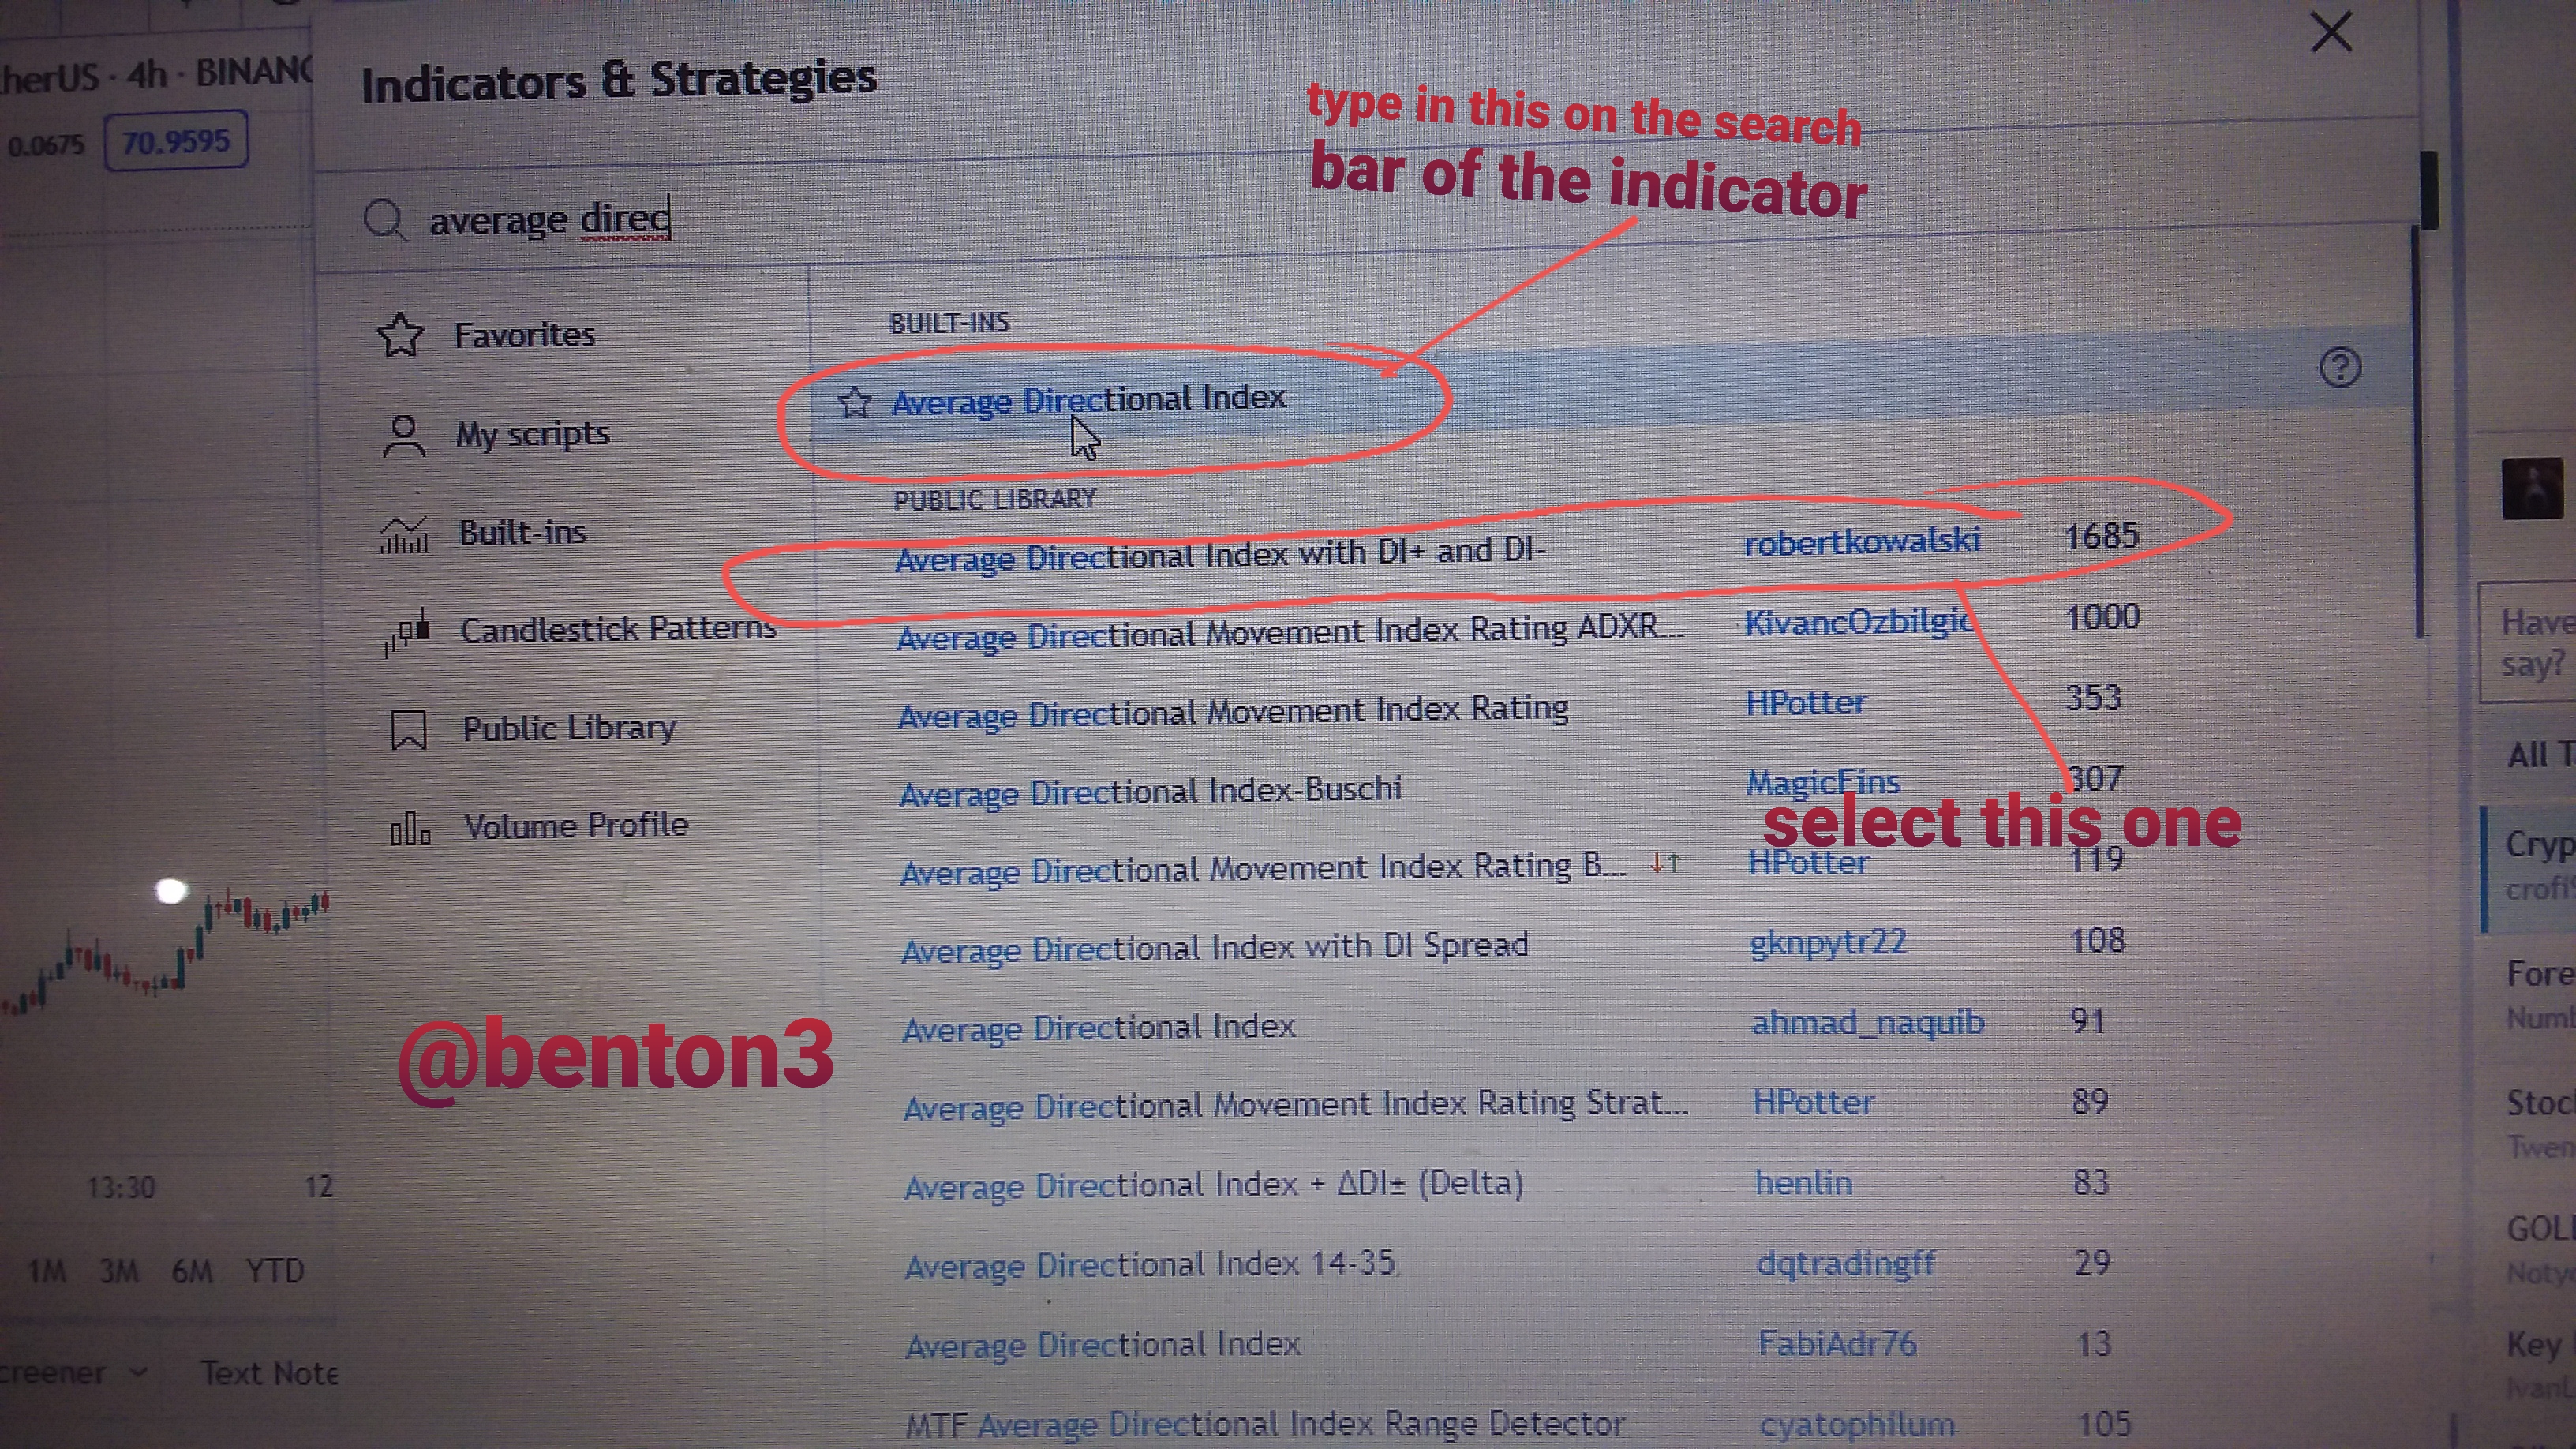
● Select or click on the "fx" button for indicator screen
● On the search bar of indicators type Average Directional Index
● it will bring out so many options, then choose the one with DI+ and DI-, so that the lines could be
used together
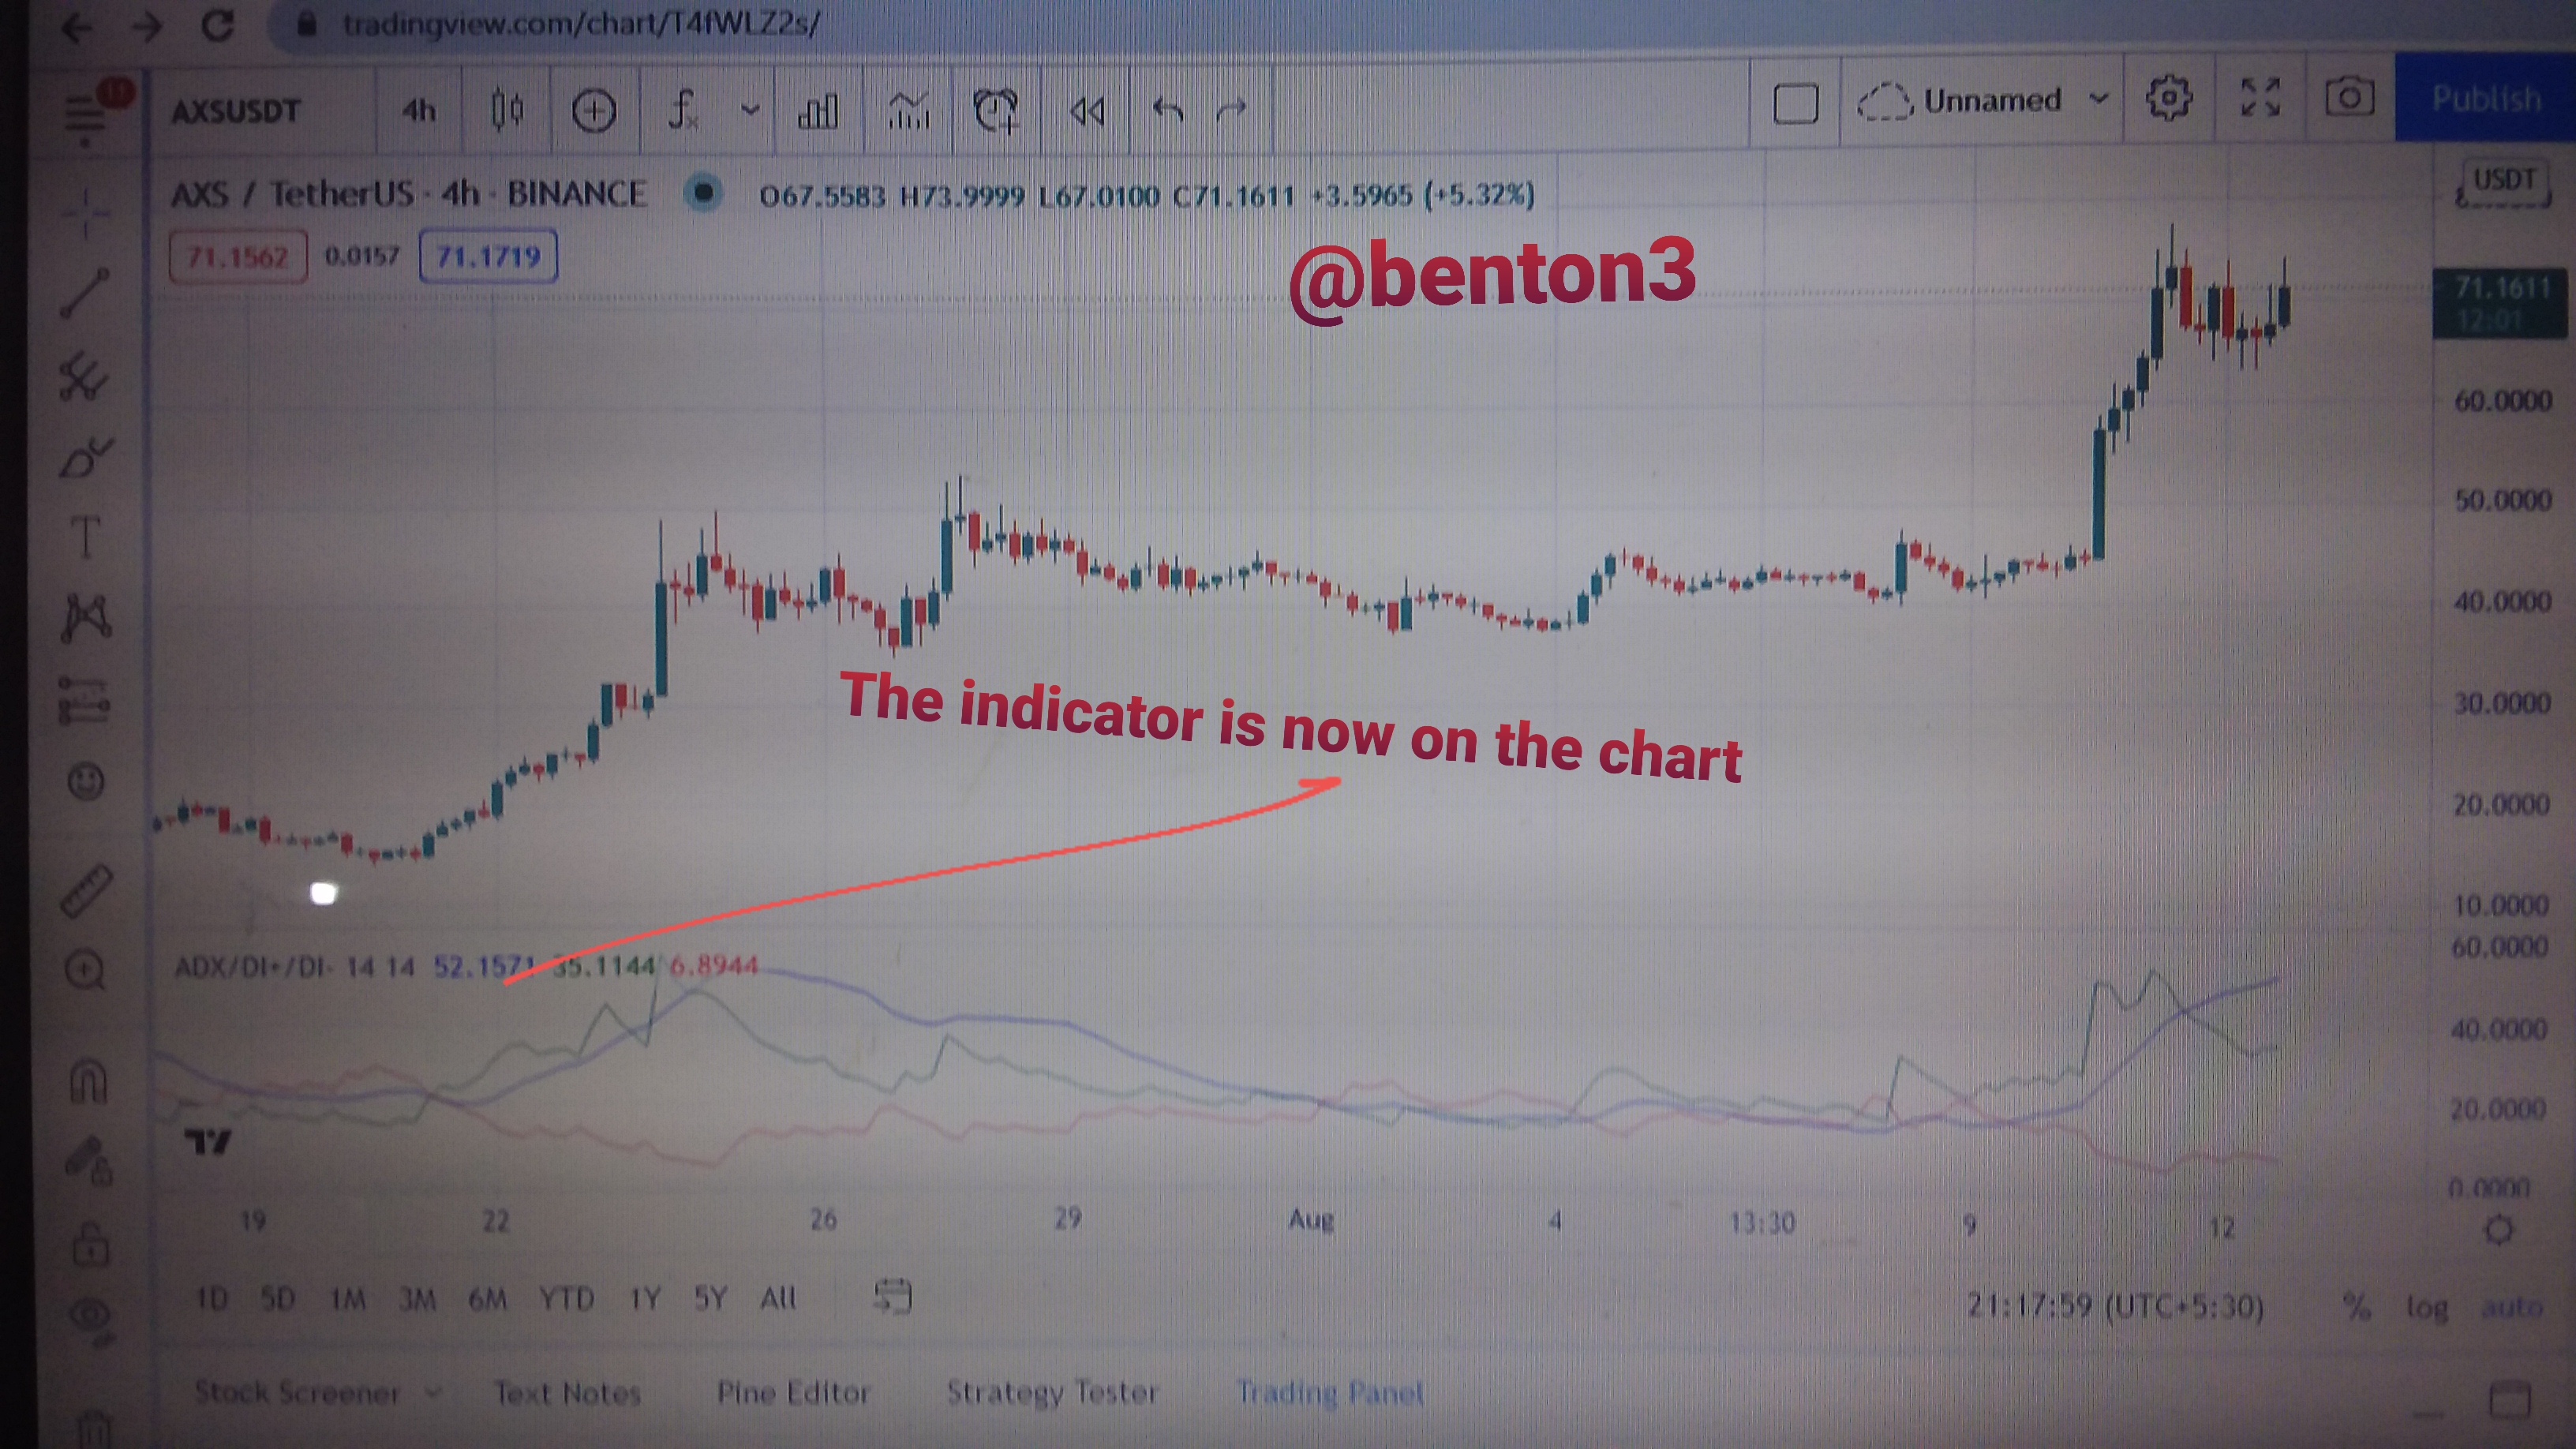
ADX DI+ and DI- on the chart now.
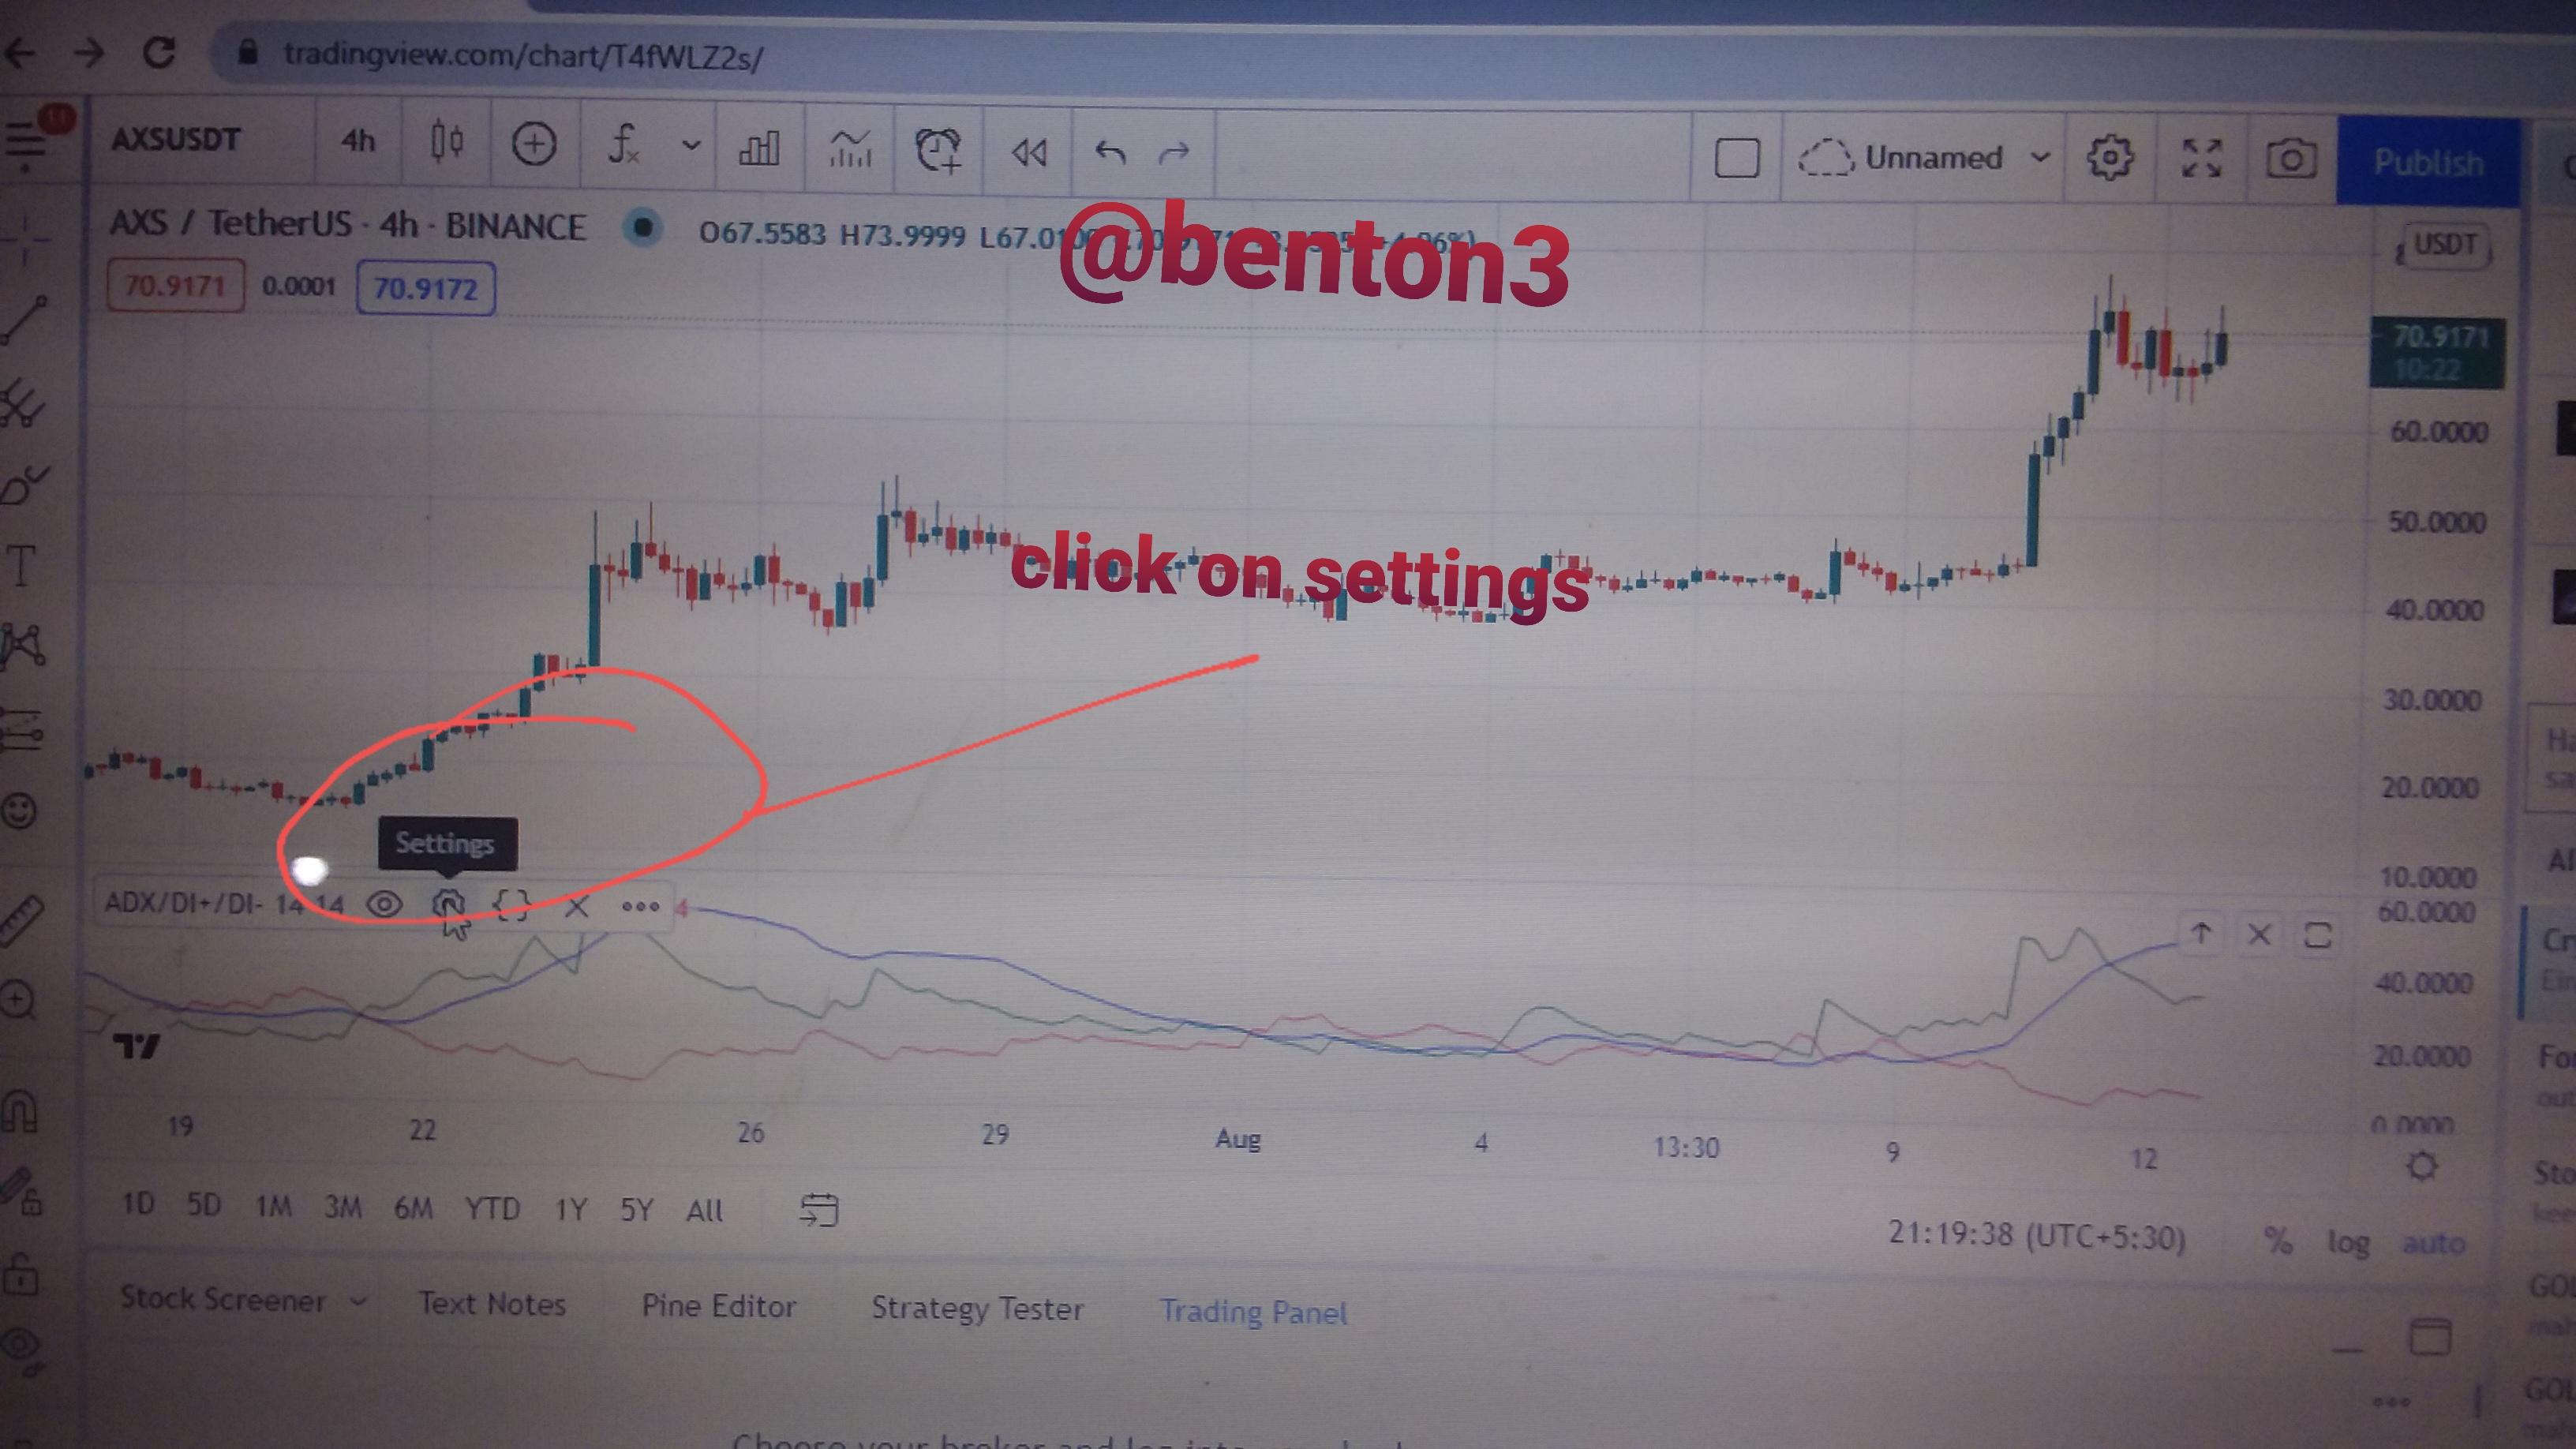
● To now set it up to suit our trading style, click on the settings as is shown on the screenshot below.
Select style to set the colour you want each curve to be
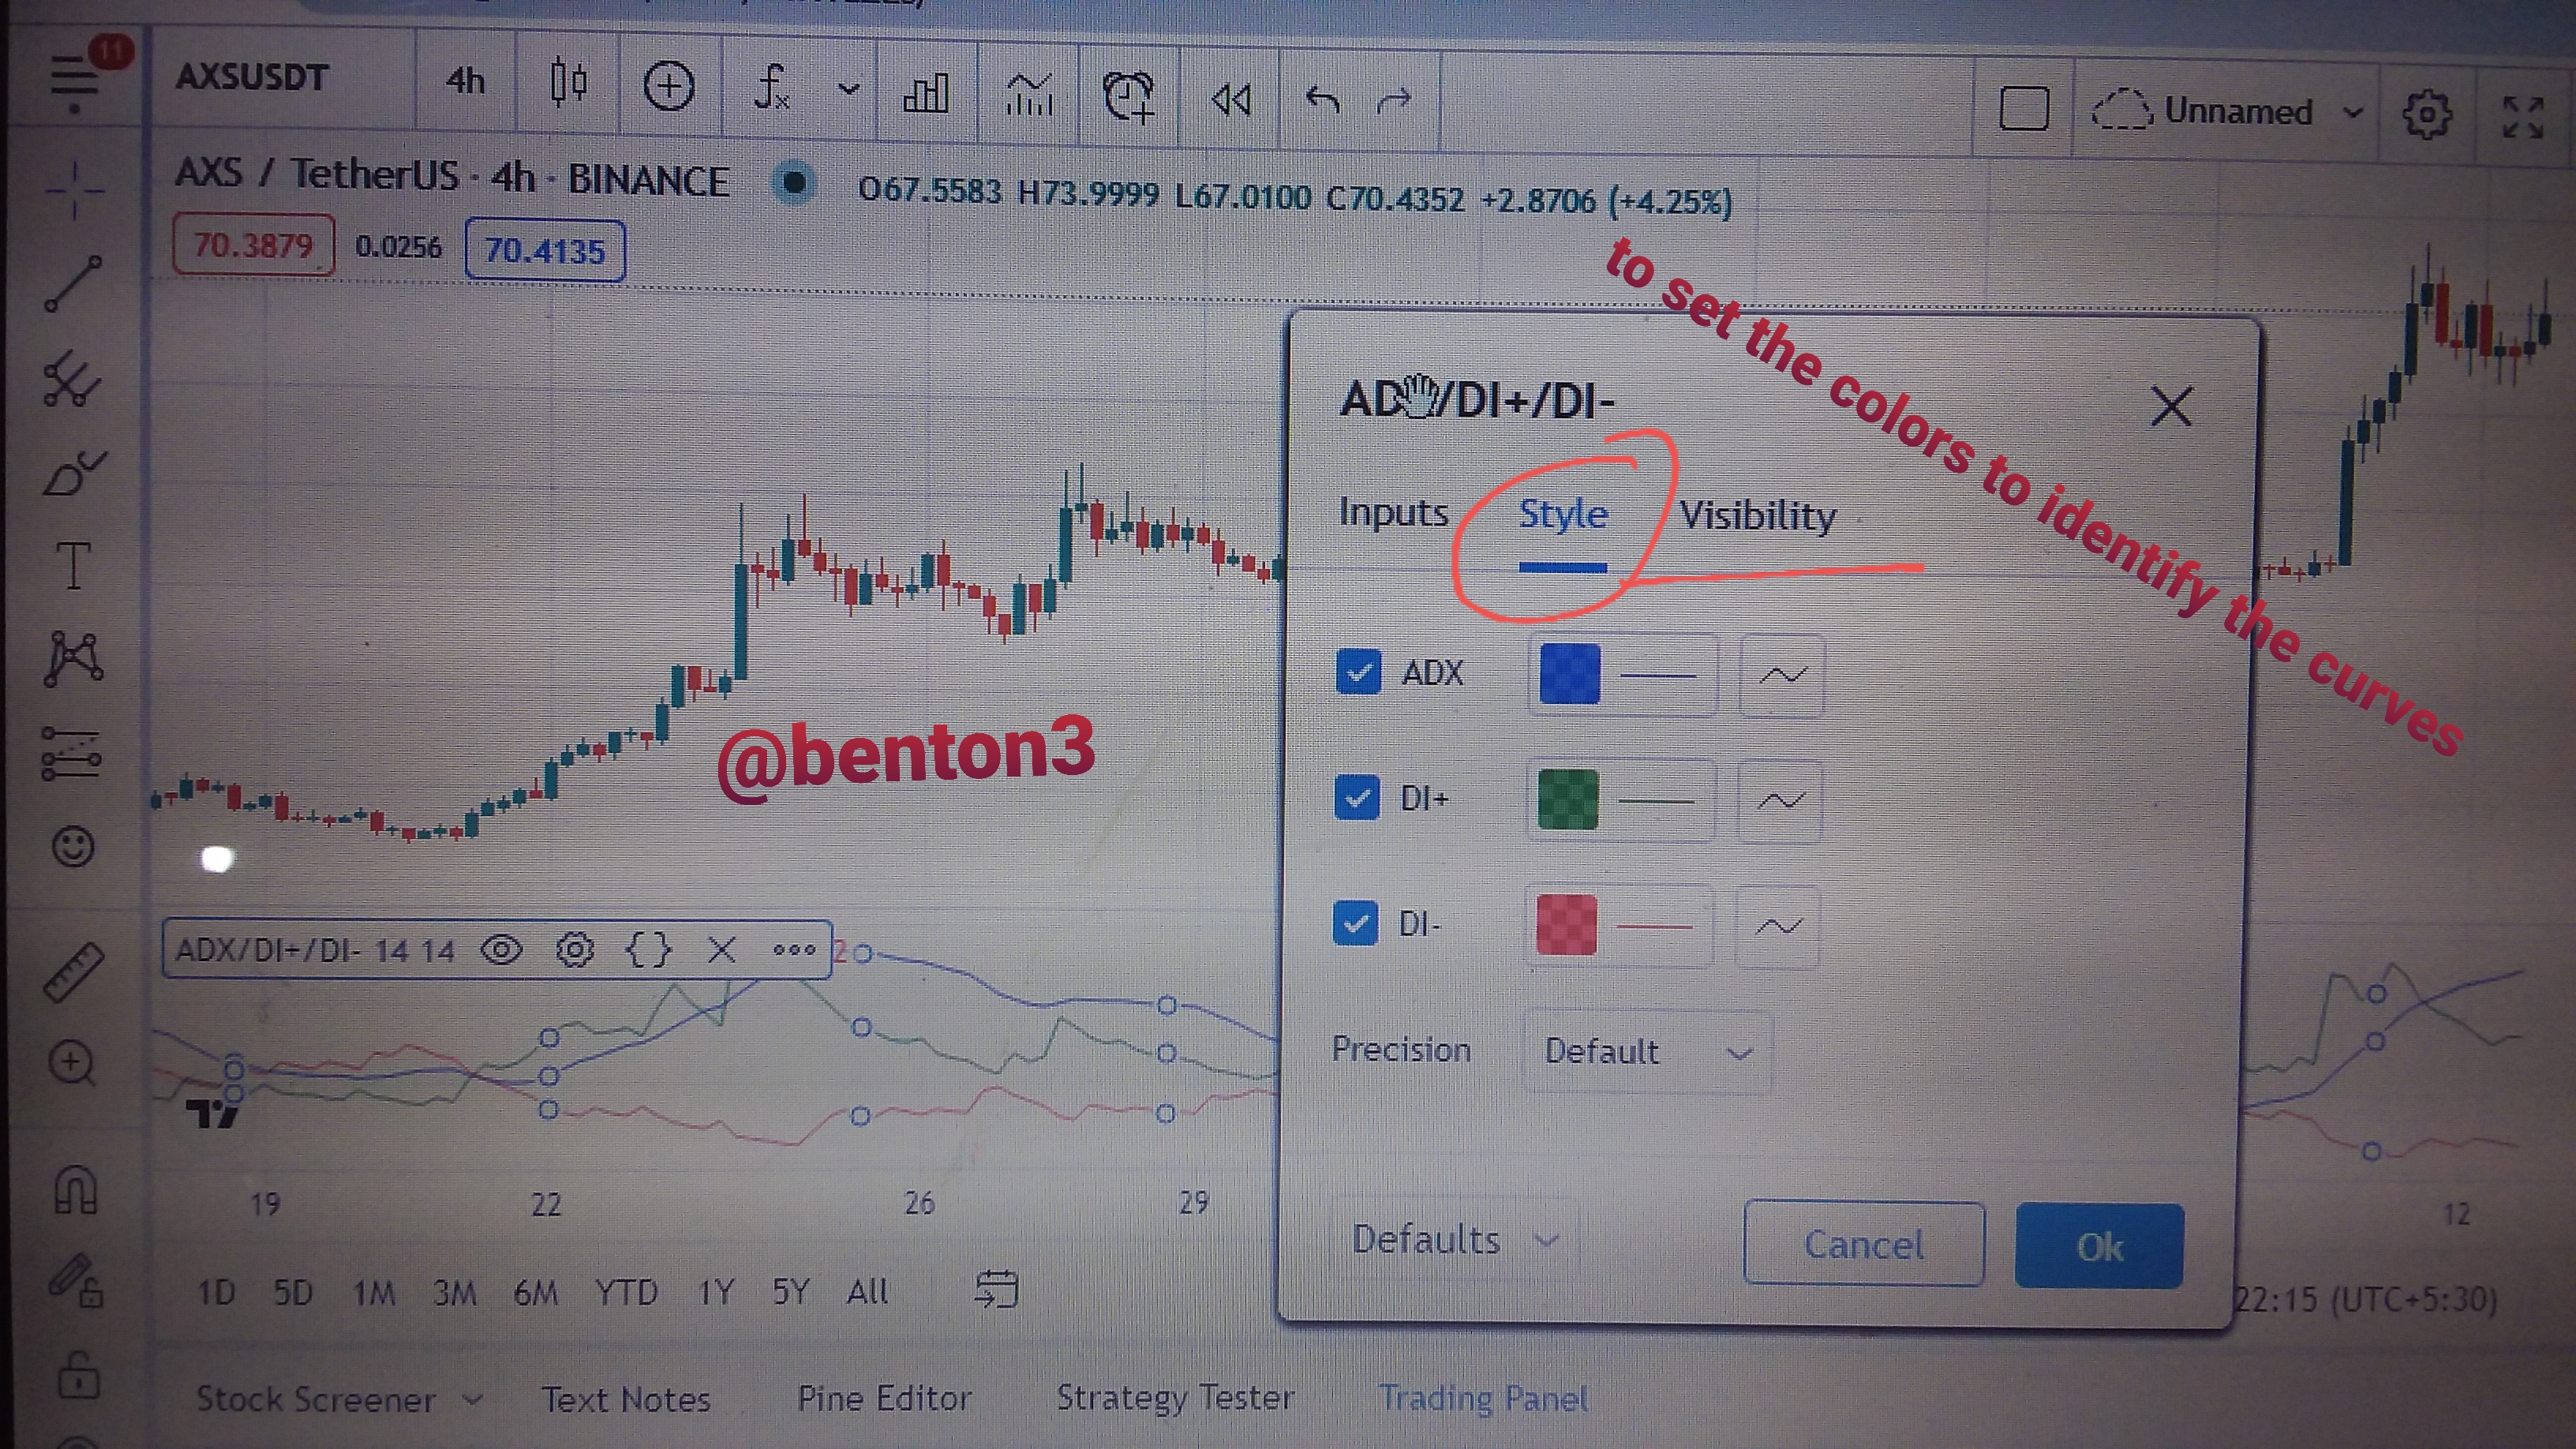
Then choose inputs to set the periods for your ADX and the DIs. Remember that the length determines how efficient the indicator will be or how fast it will relate to price changes.
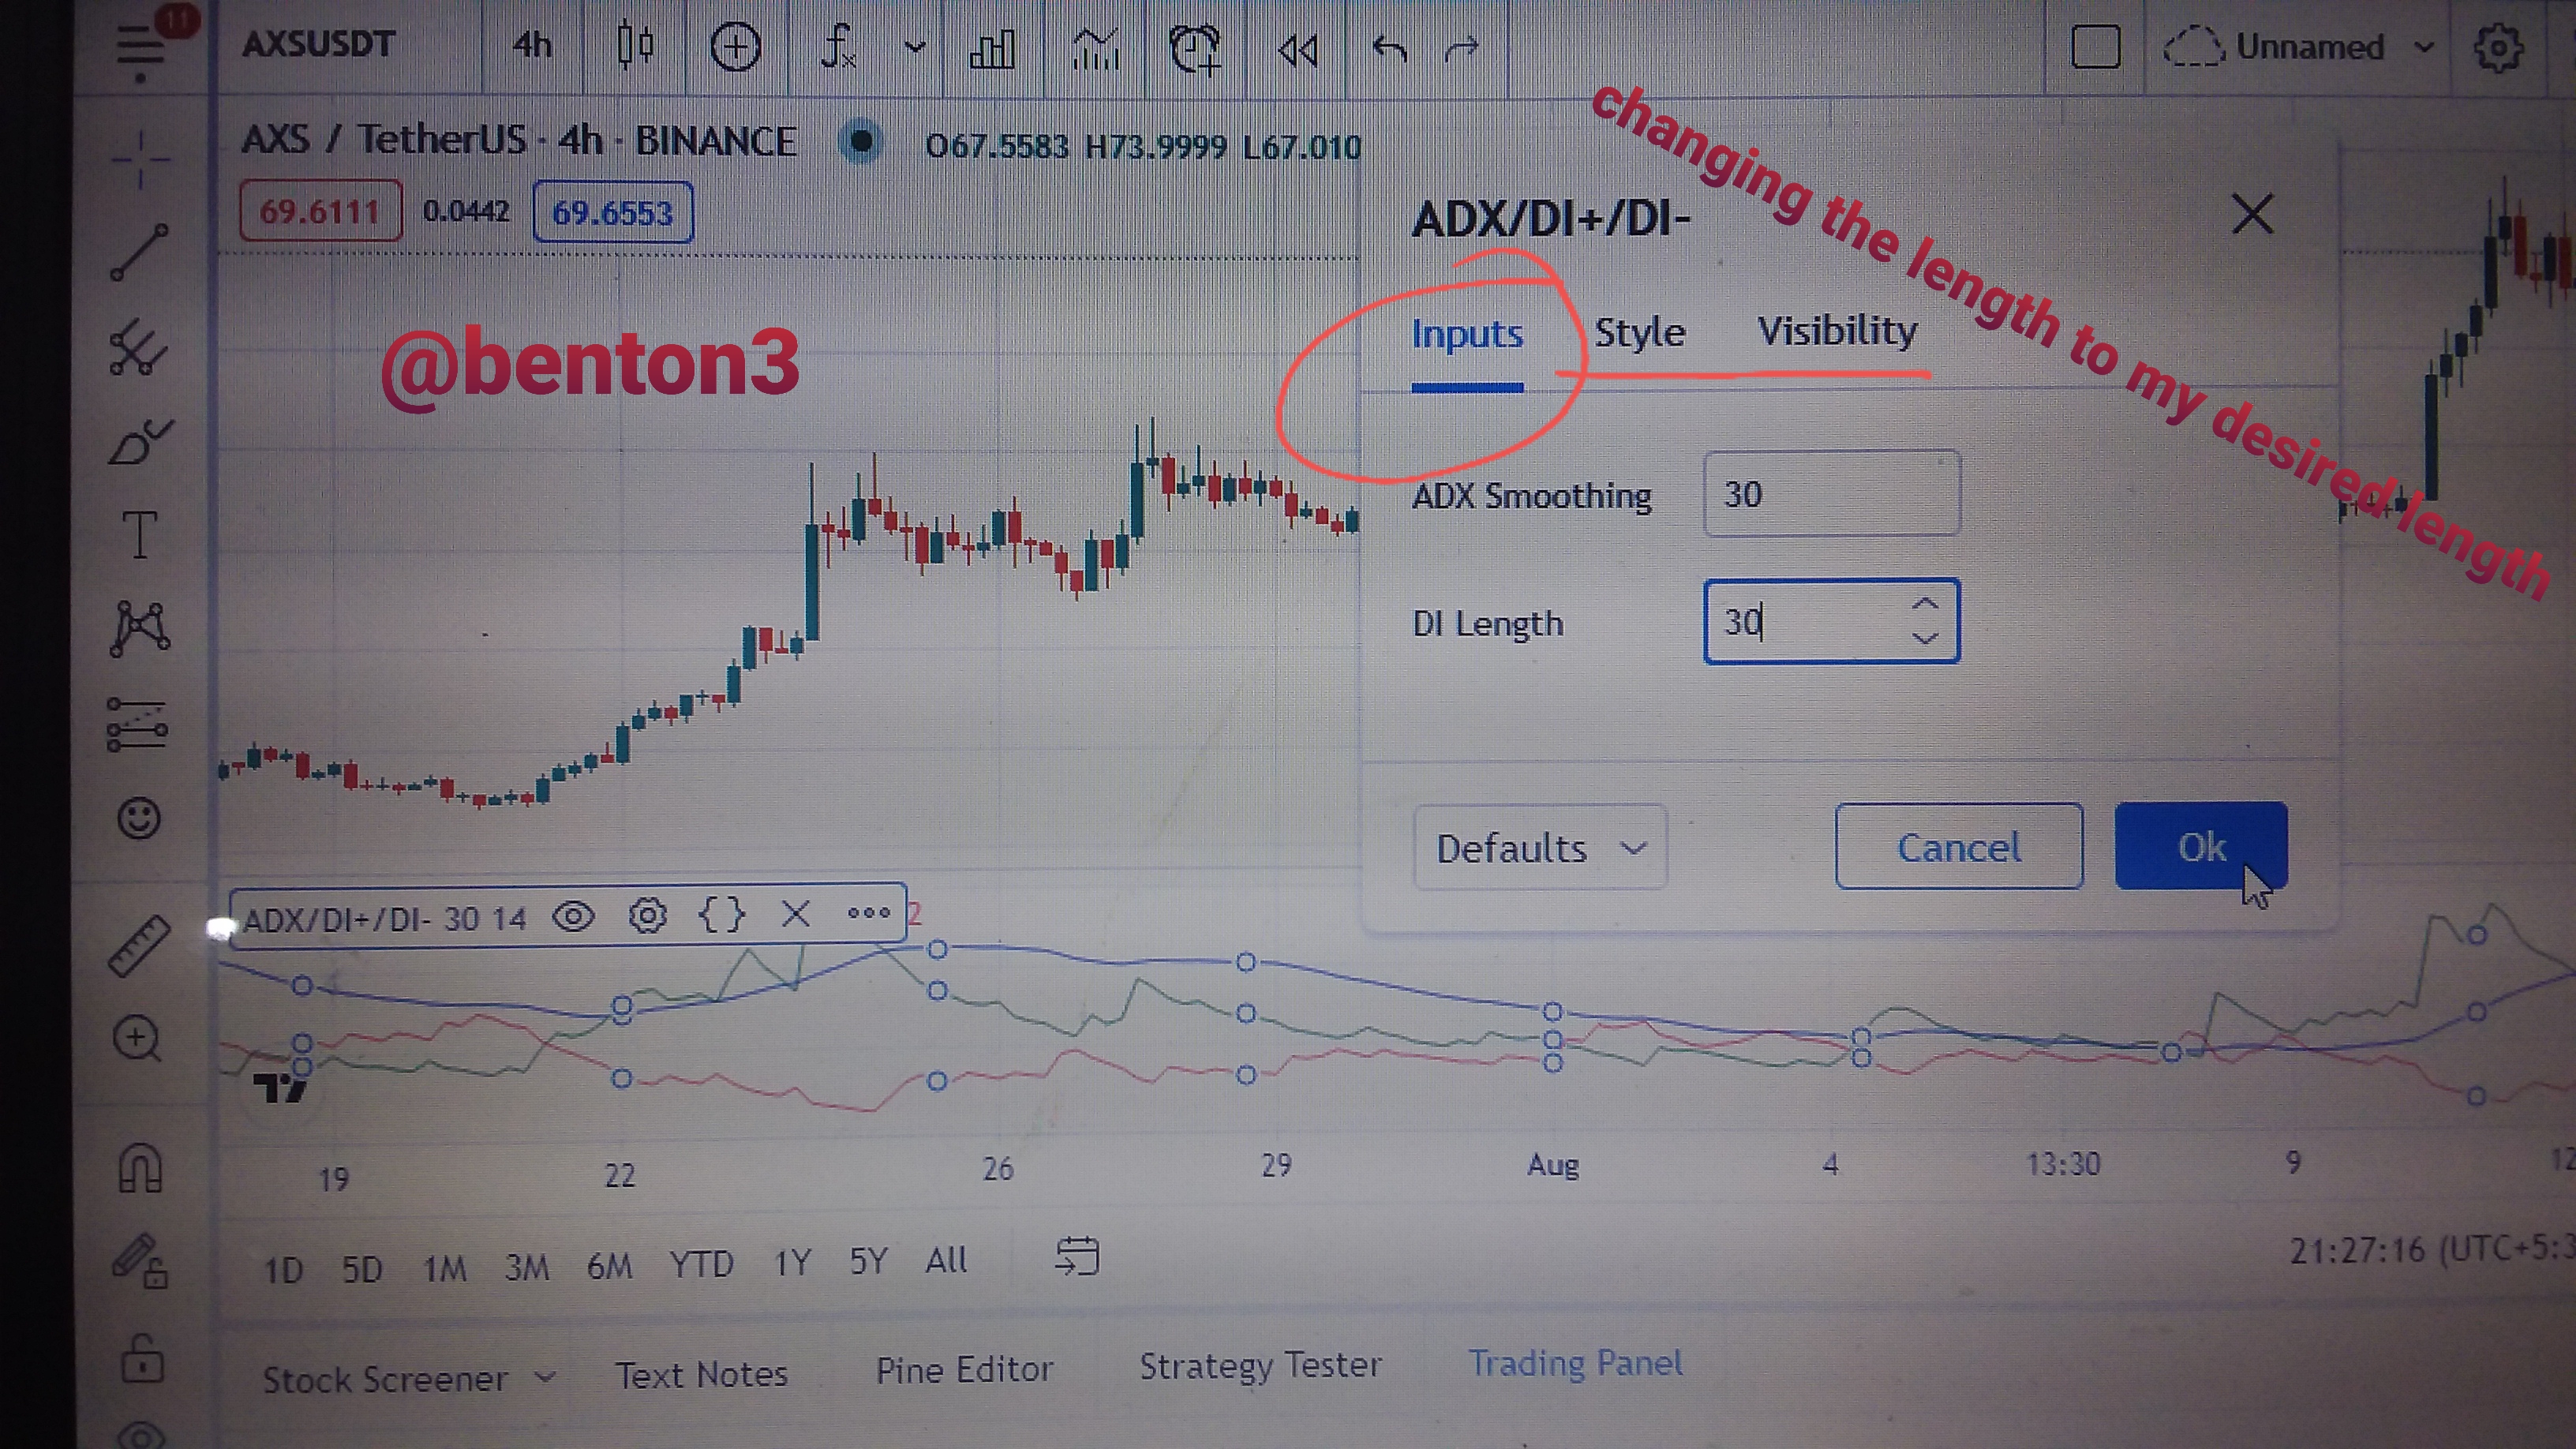
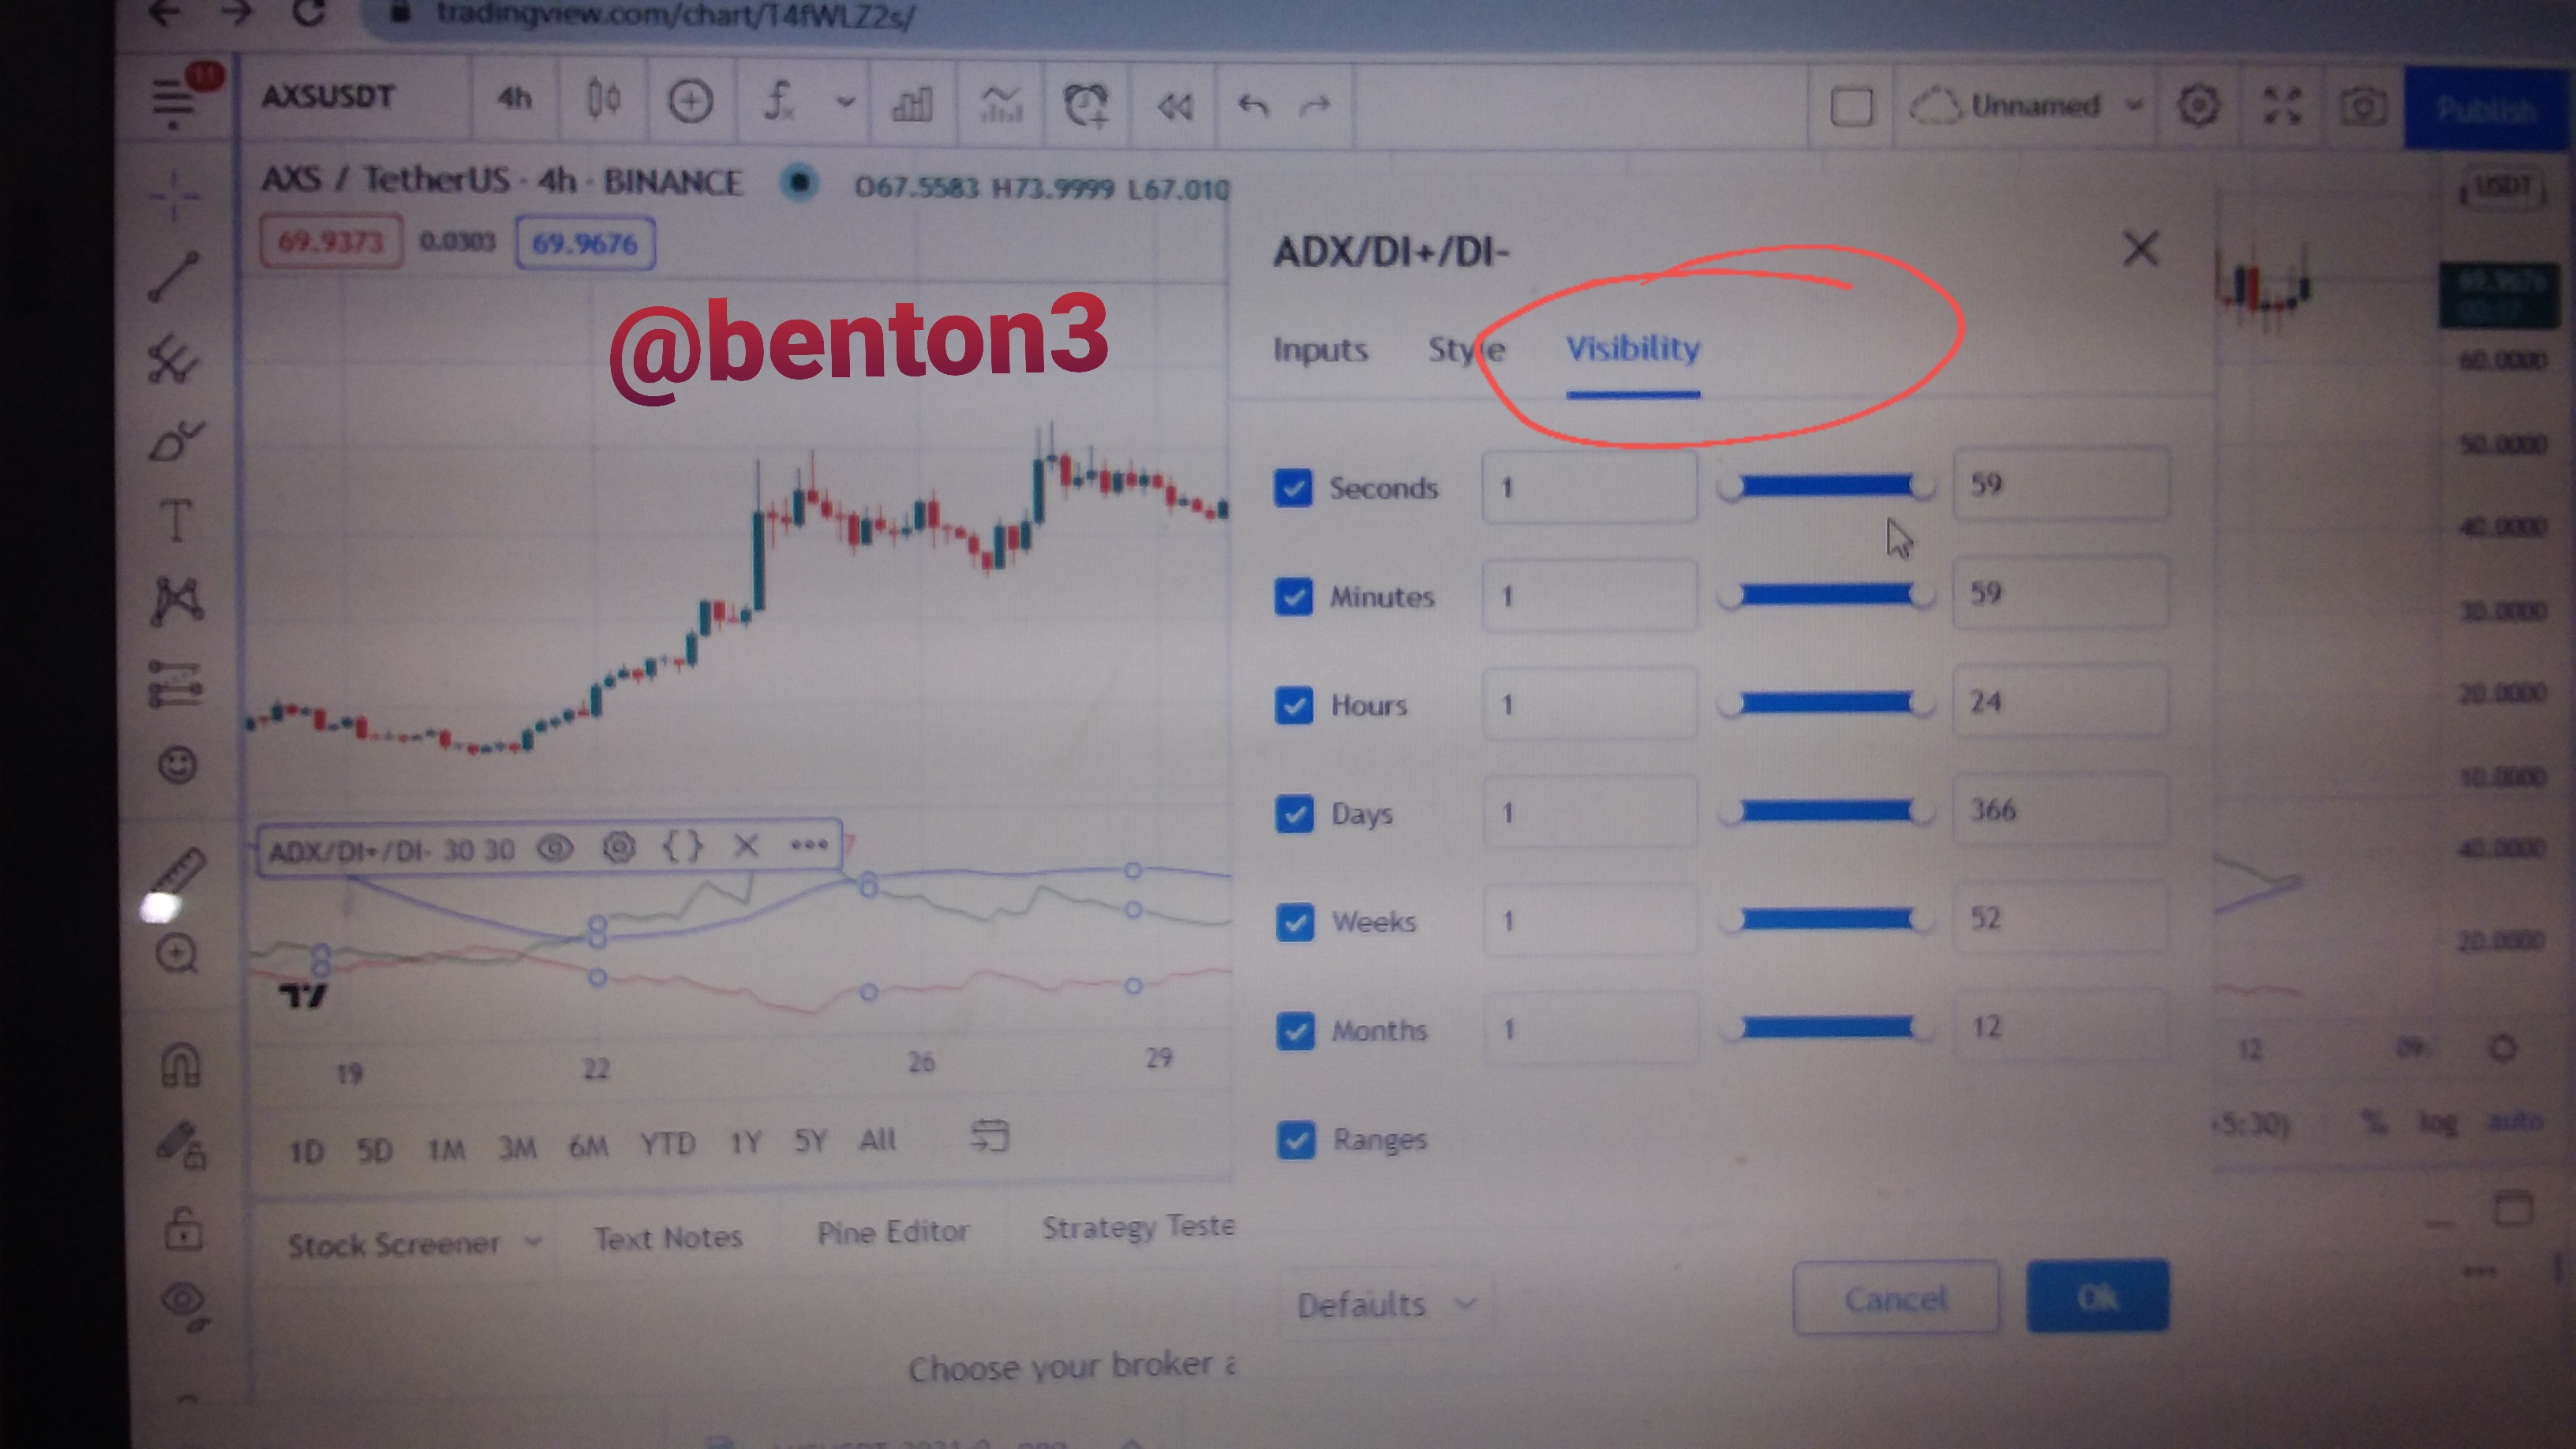
Then select visibility to let the system know that the indicator should appear in all the timeframes.
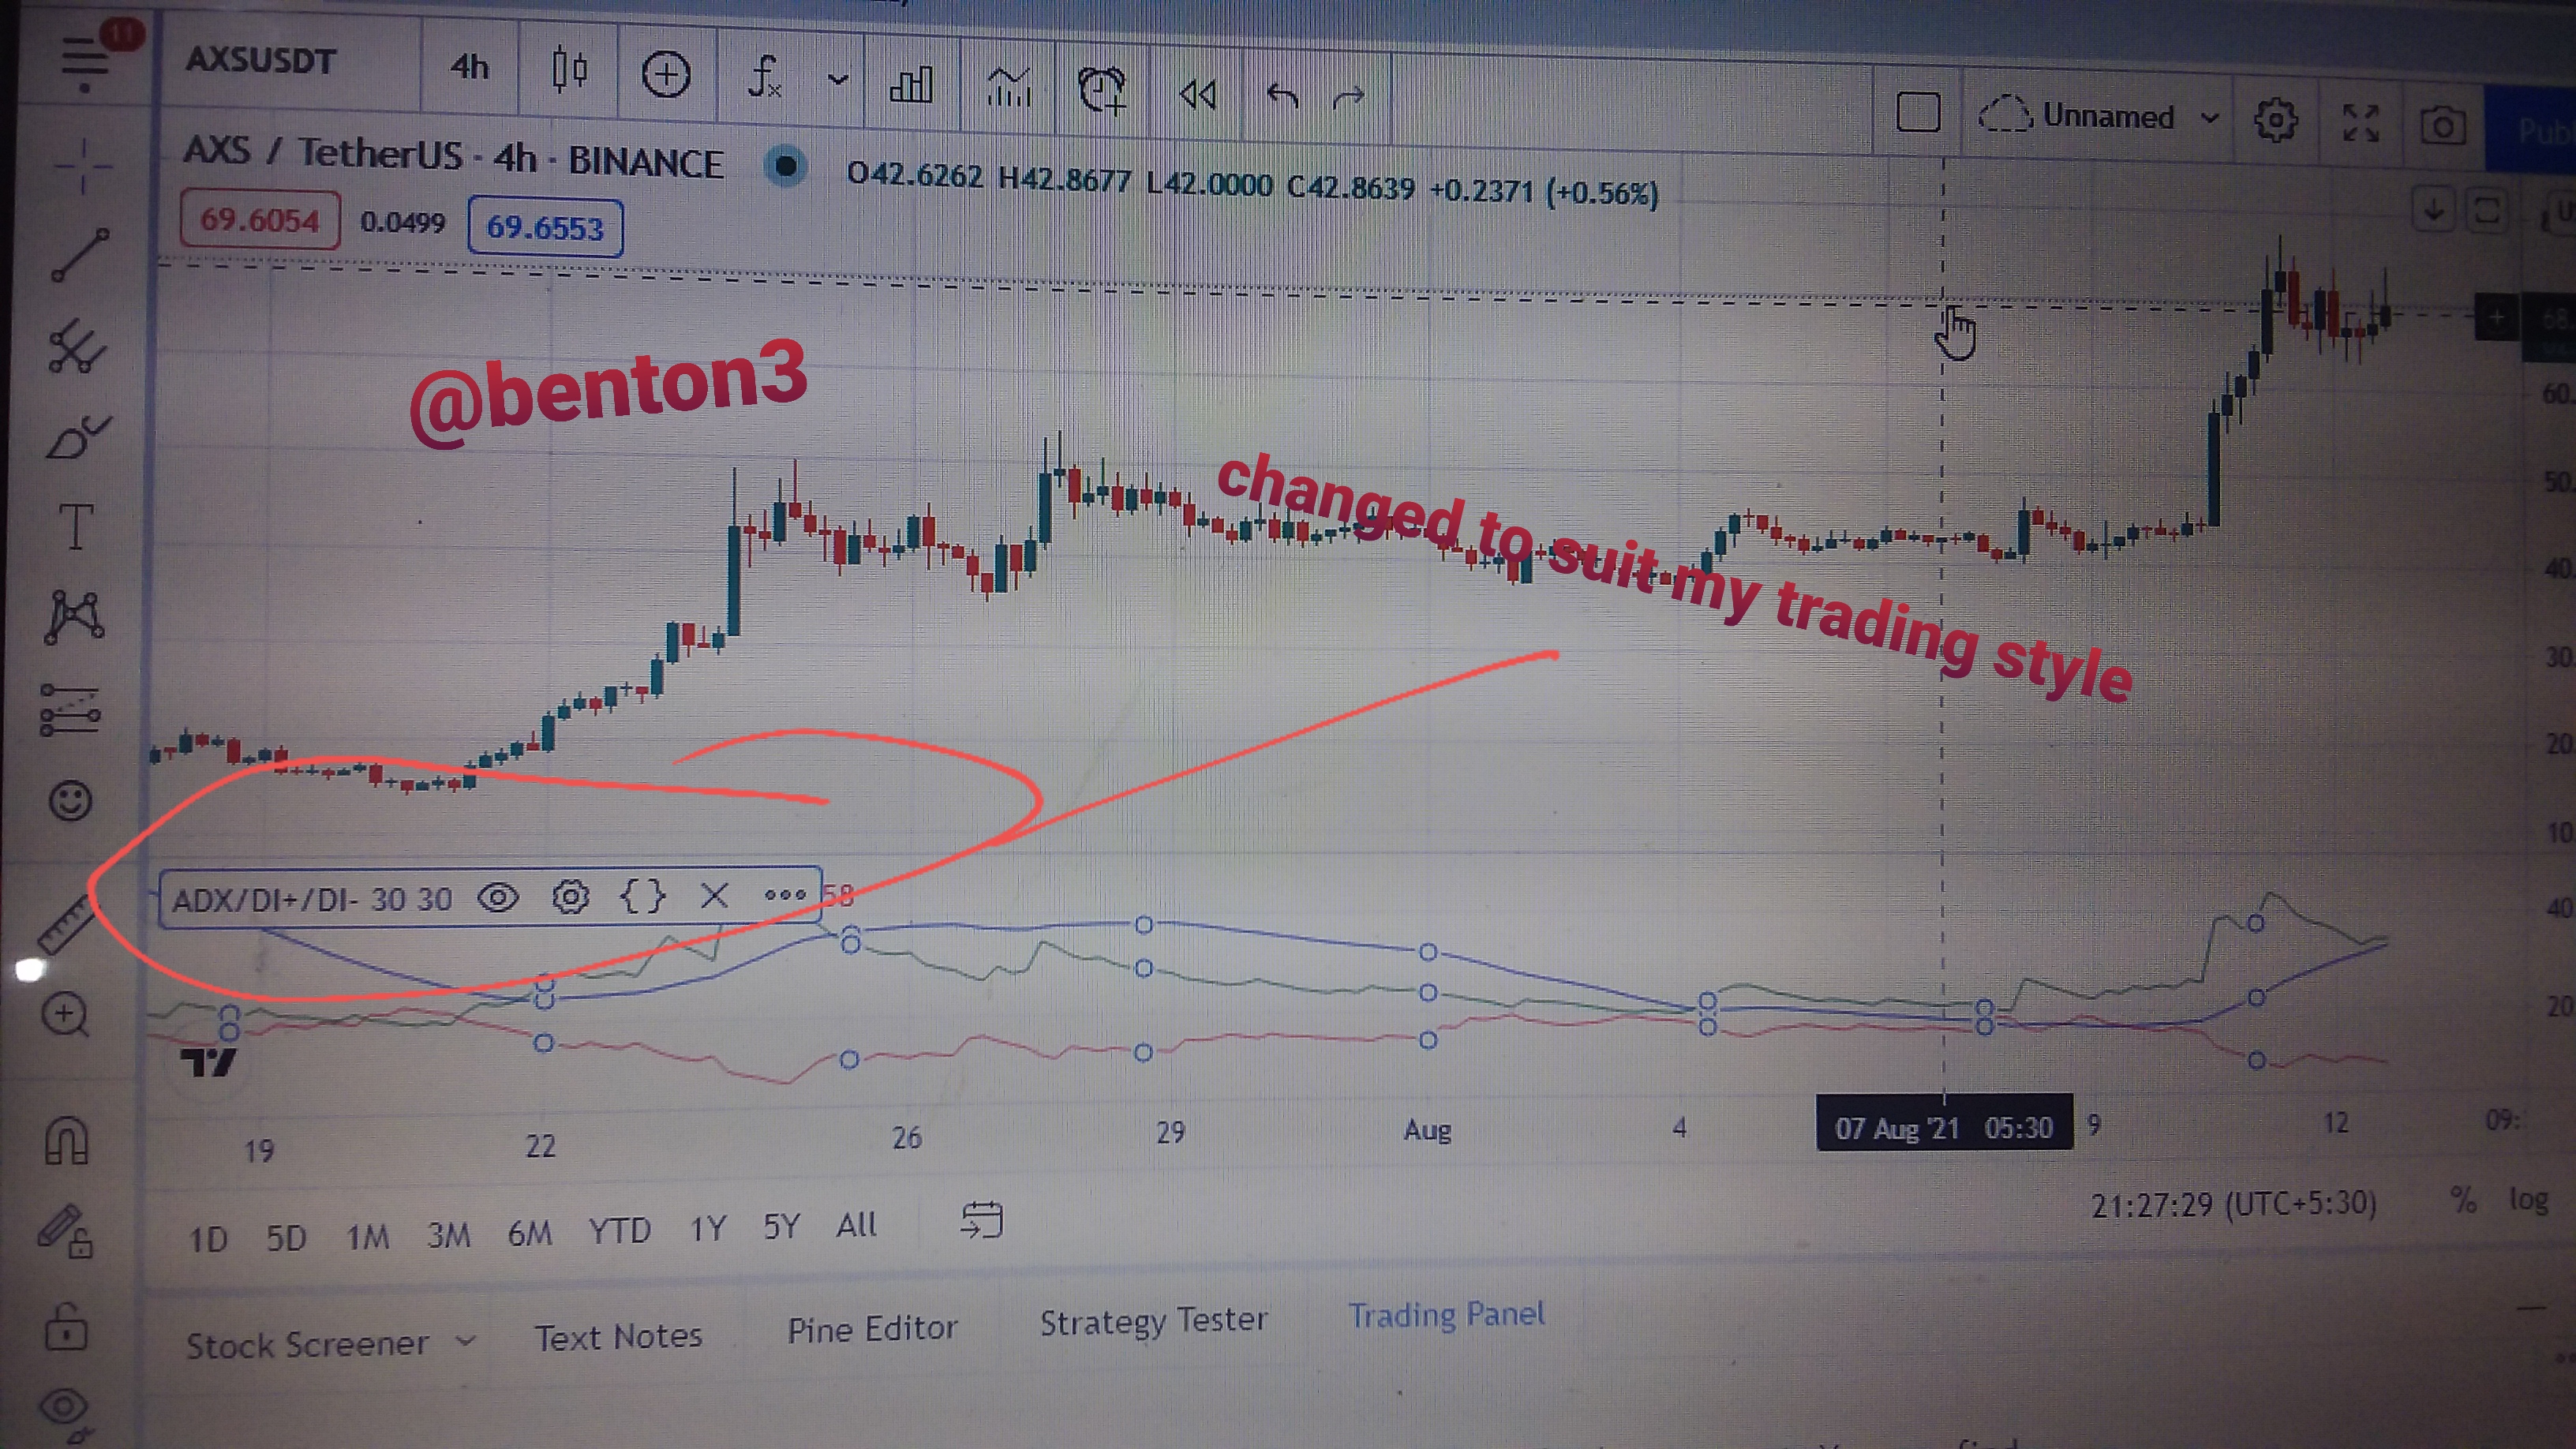
You can see the changes made on the indicator settings, instead of 14 period or length it is now 30 period or length.
What are its best settings? And why
The length setting is the most important setting of this indicator. The length determines the effectiveness of the indicator depending on the trading style of the trader. The period here refers to the number of last candlesticks to be used by the indicator.
The shorter the length selected, the more volatile the the price will be on the indicator, thereby generating so many signals which are false most at times. On the other hand, when a higher number of length is selected, it does not respond quickly to price movements, thus taking longer time
The default setting for length is 14 periods. This implies that the ADX will be focusing on the last fourteen periods.
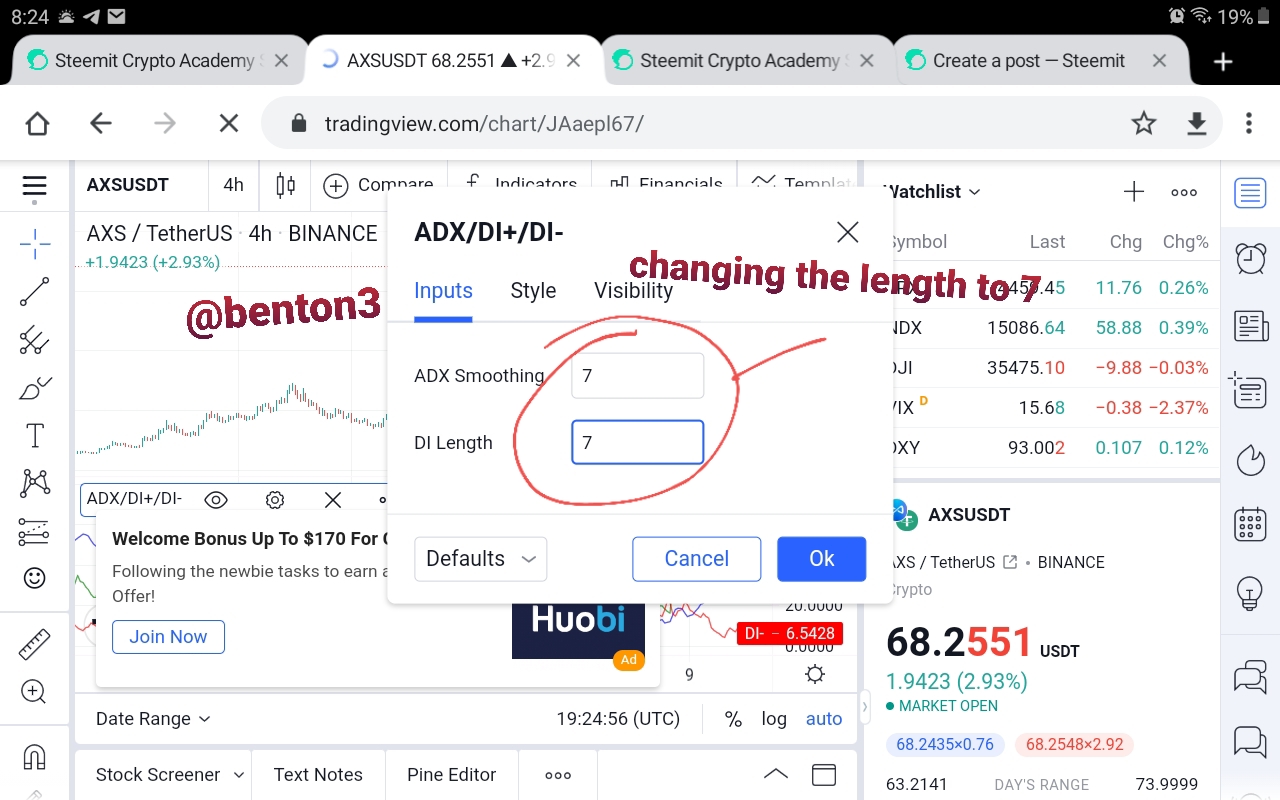
Let us now look at the chart above that used 7 periods.
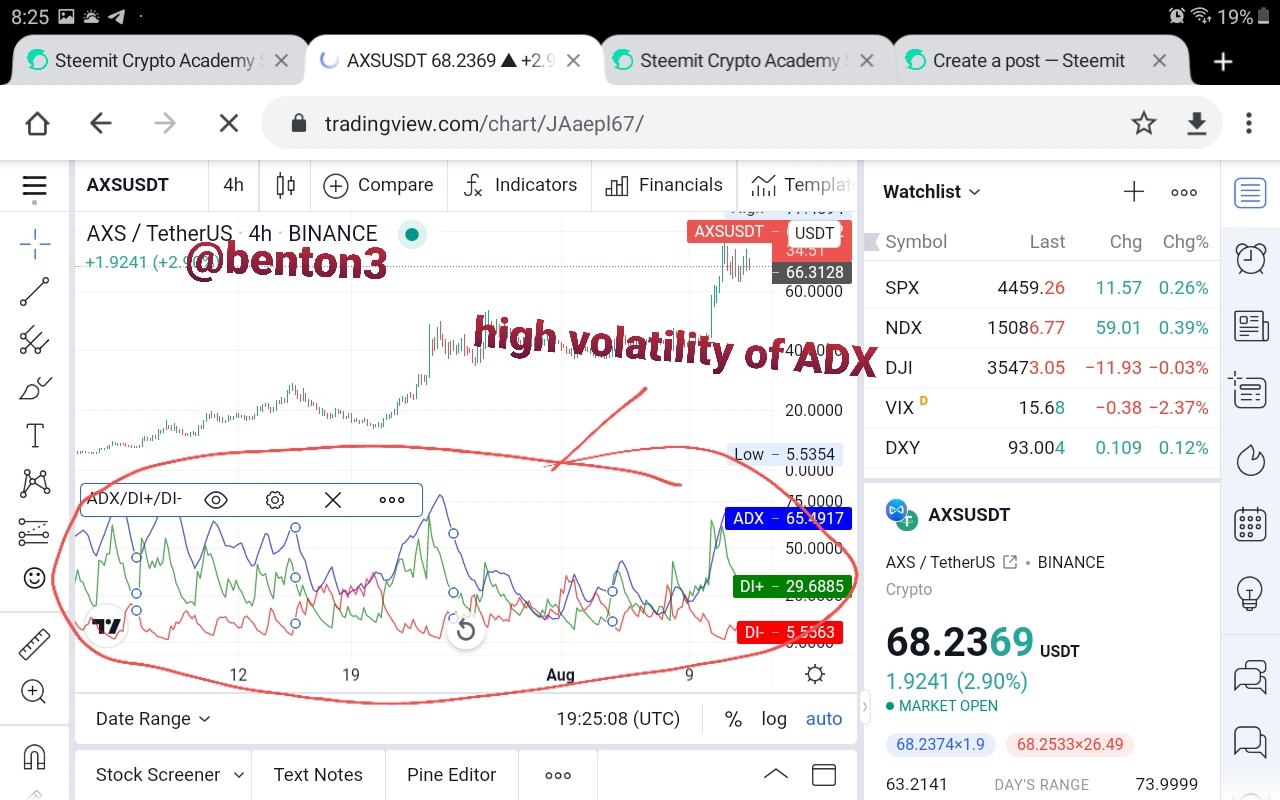
From the chart we can see that the indicator was responding fast to the price movements causing much volatility to the ADX indicator. This generated so many signals in the process which are false.
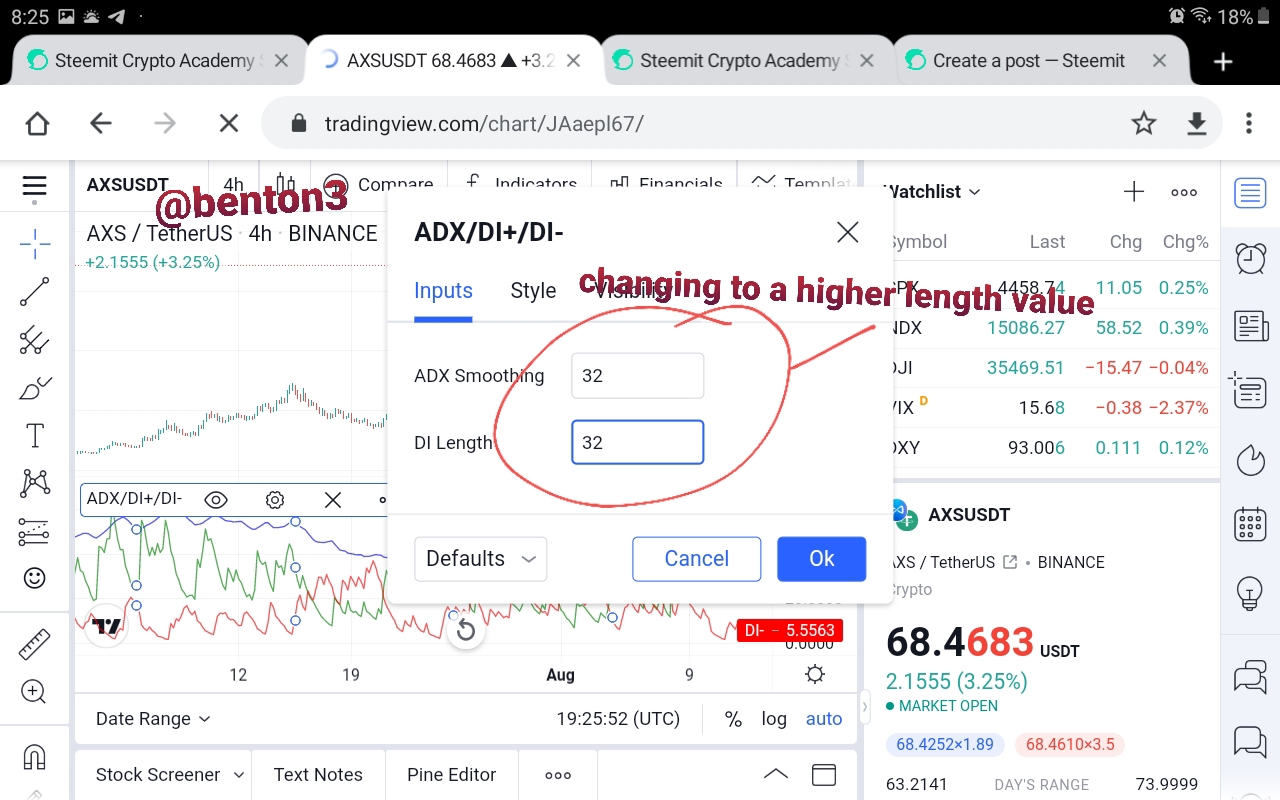
Now let us use the 32 period setting in the chart above and see what happens to the ADX indicator.
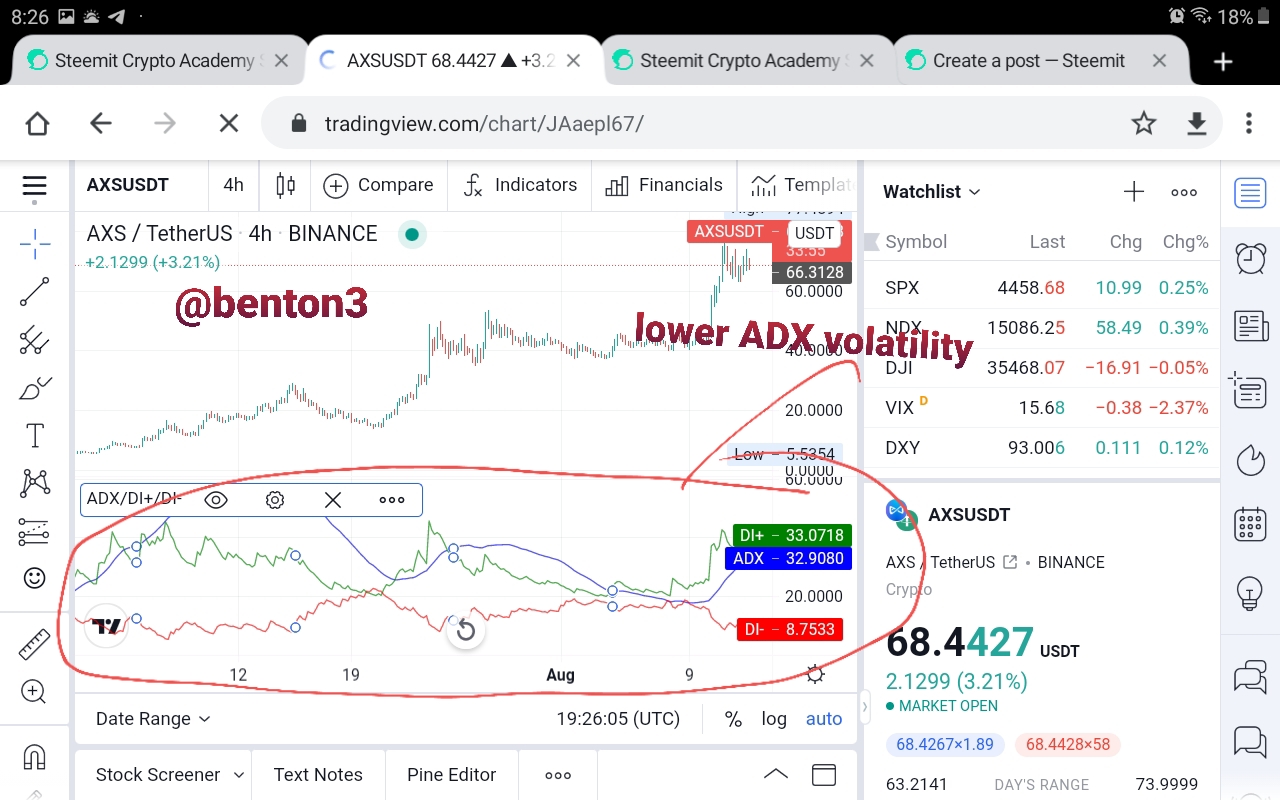
From the chart above, we will notice that the volatility was quite reduced and it looked as if it was not following up with the price movements.
So when it comes to the best settings, it is dependent on the trader and the strategy he adopts while trading. A scalper can use a shorter period, entering the market and leaving immediately. While an intraday trader will find it more useful to use a longer period in his settings.
So the choice of which is best is determined by the trader using it.
Do you need to add DI+ and DI- indicators to be able to trade with ADX? How can we take advantage of this indicator? (Screenshot required)
Earlier on, we pointed out that ADX is an indicator that meaures only the strength of a trend, if it is weak or strong. It does not show the direction of the trend, neither does it give a buy signal. It measures the strength within the range of 0- 100.
So when using the ADX alone and we notice that the strength is above 25, from our chart that is visible to us, we can determine the trend direction easily and then join the trend immediately. The chart below shows thus.
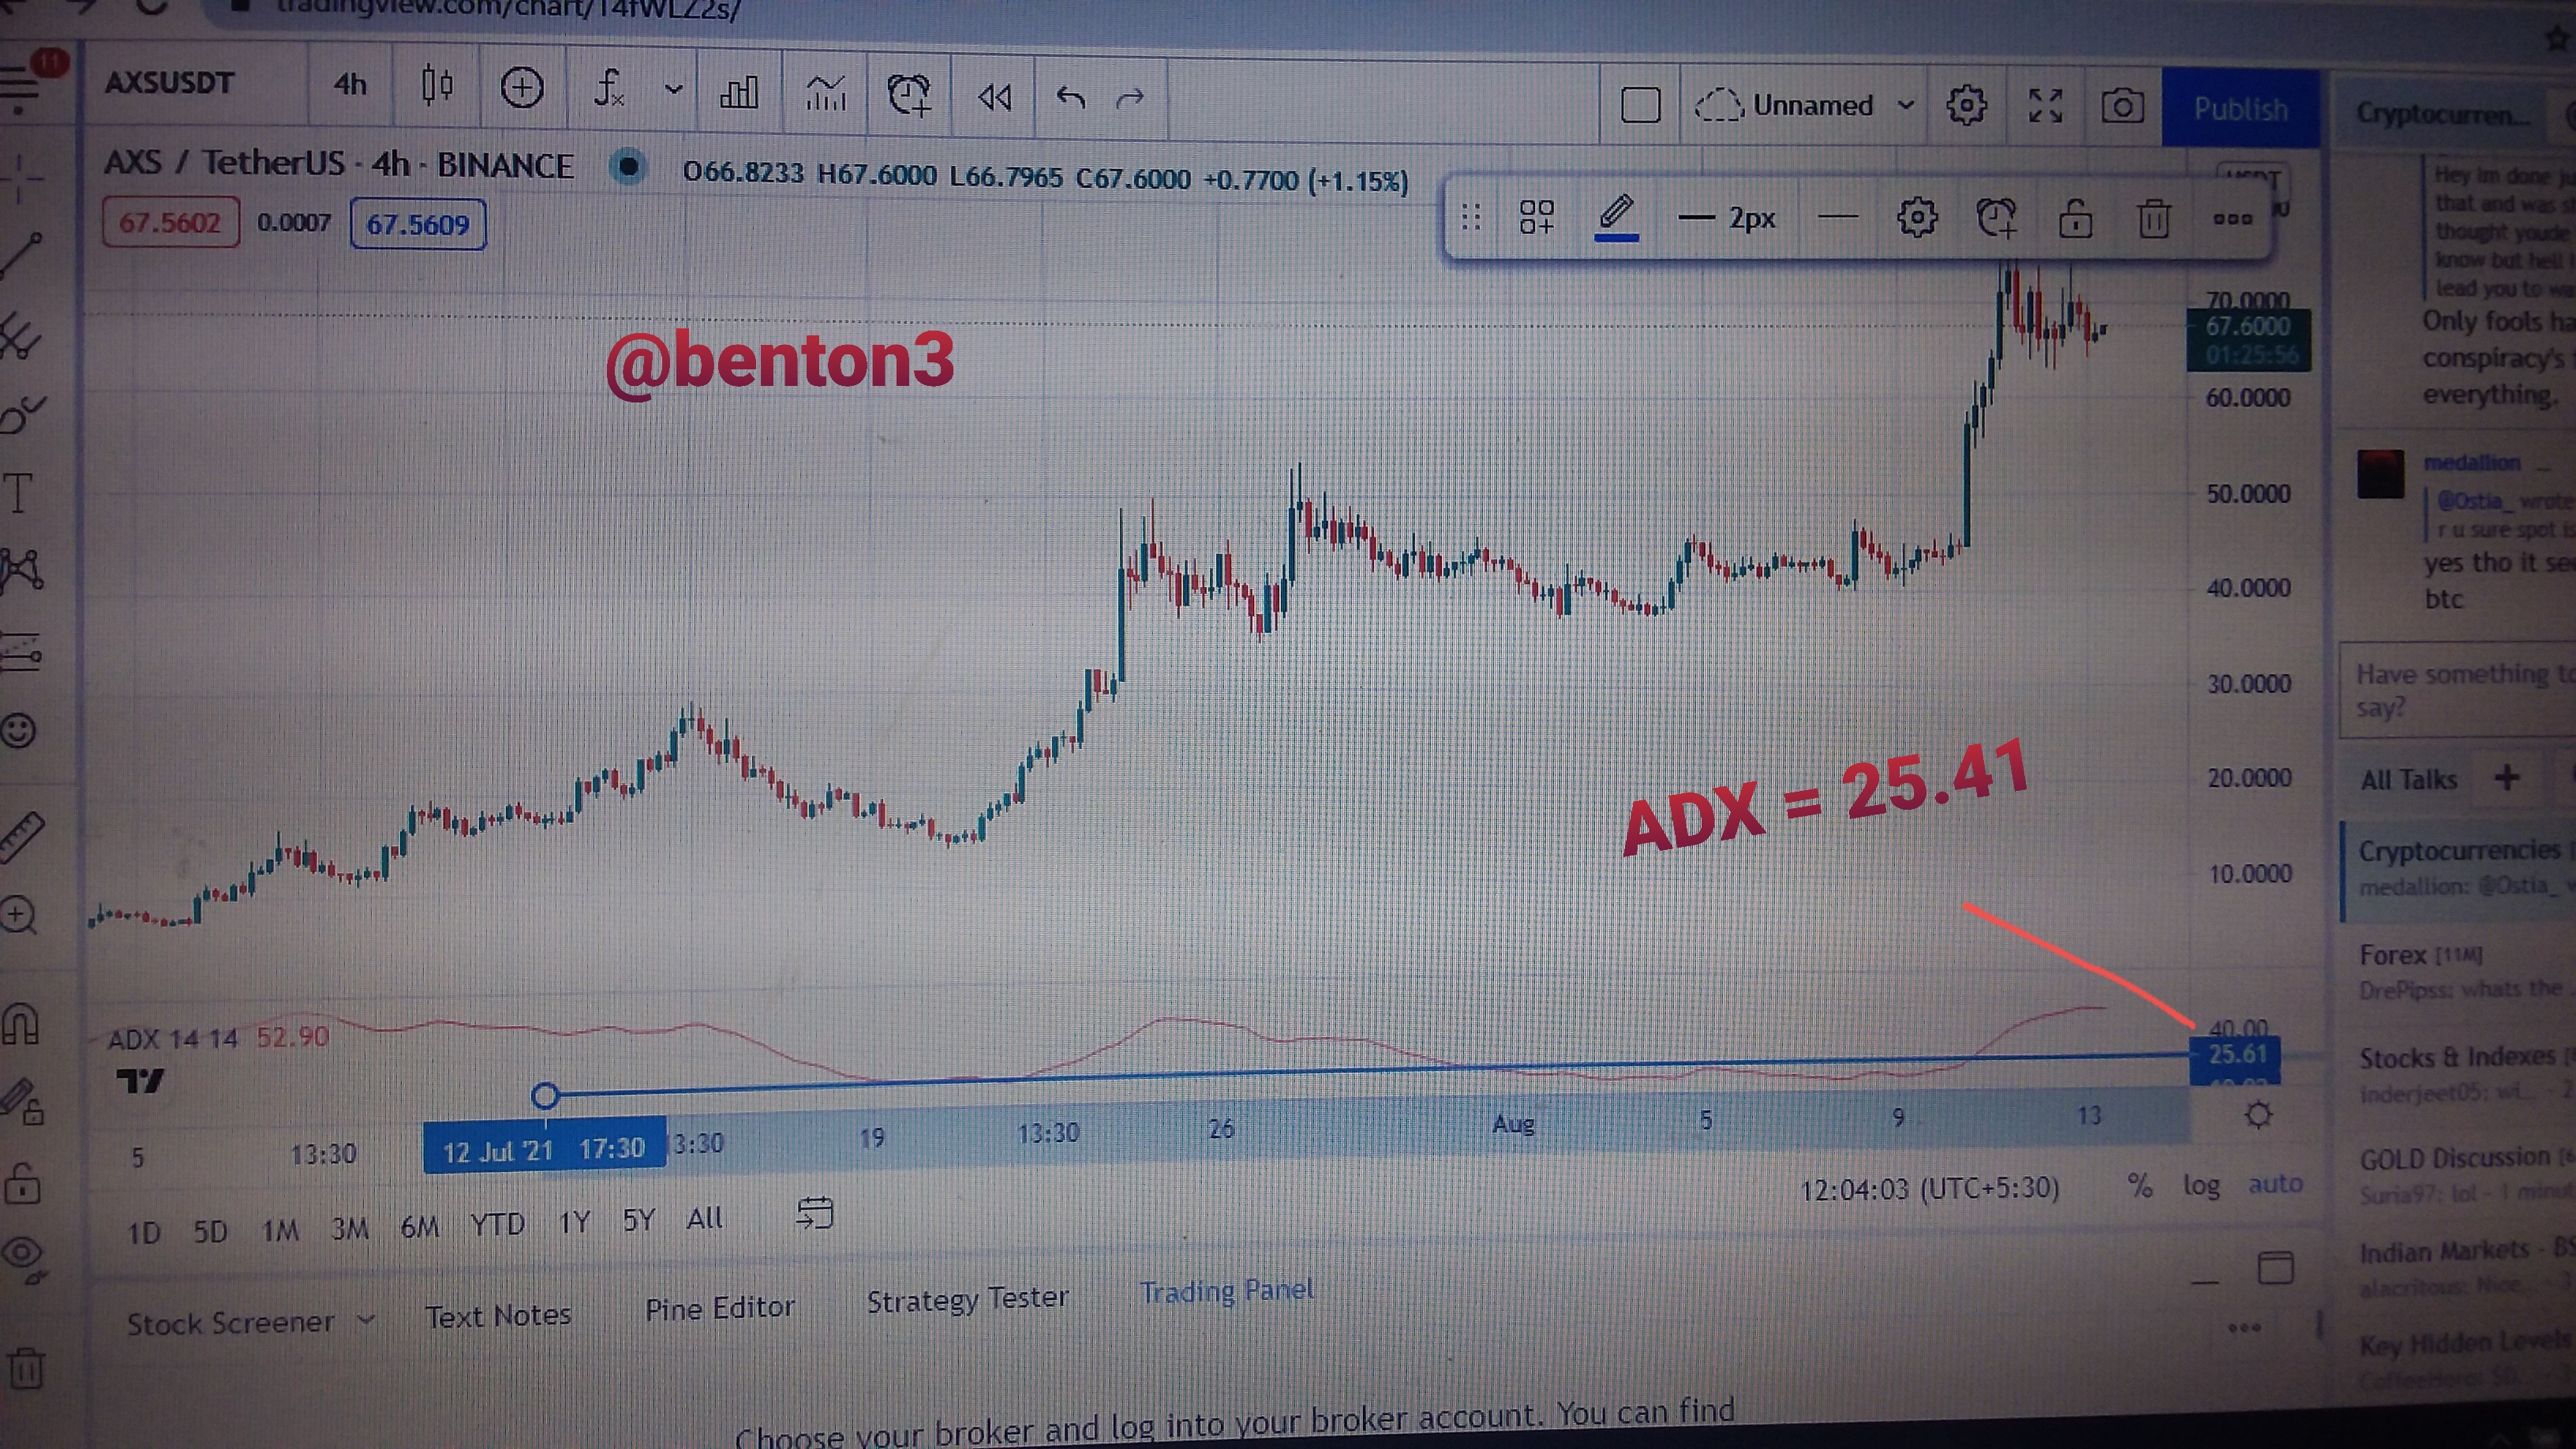
Using the price action together with the ADX we can enter a trade at the point where ADX was 25.41, which we also noticed was an entry point on the chart.
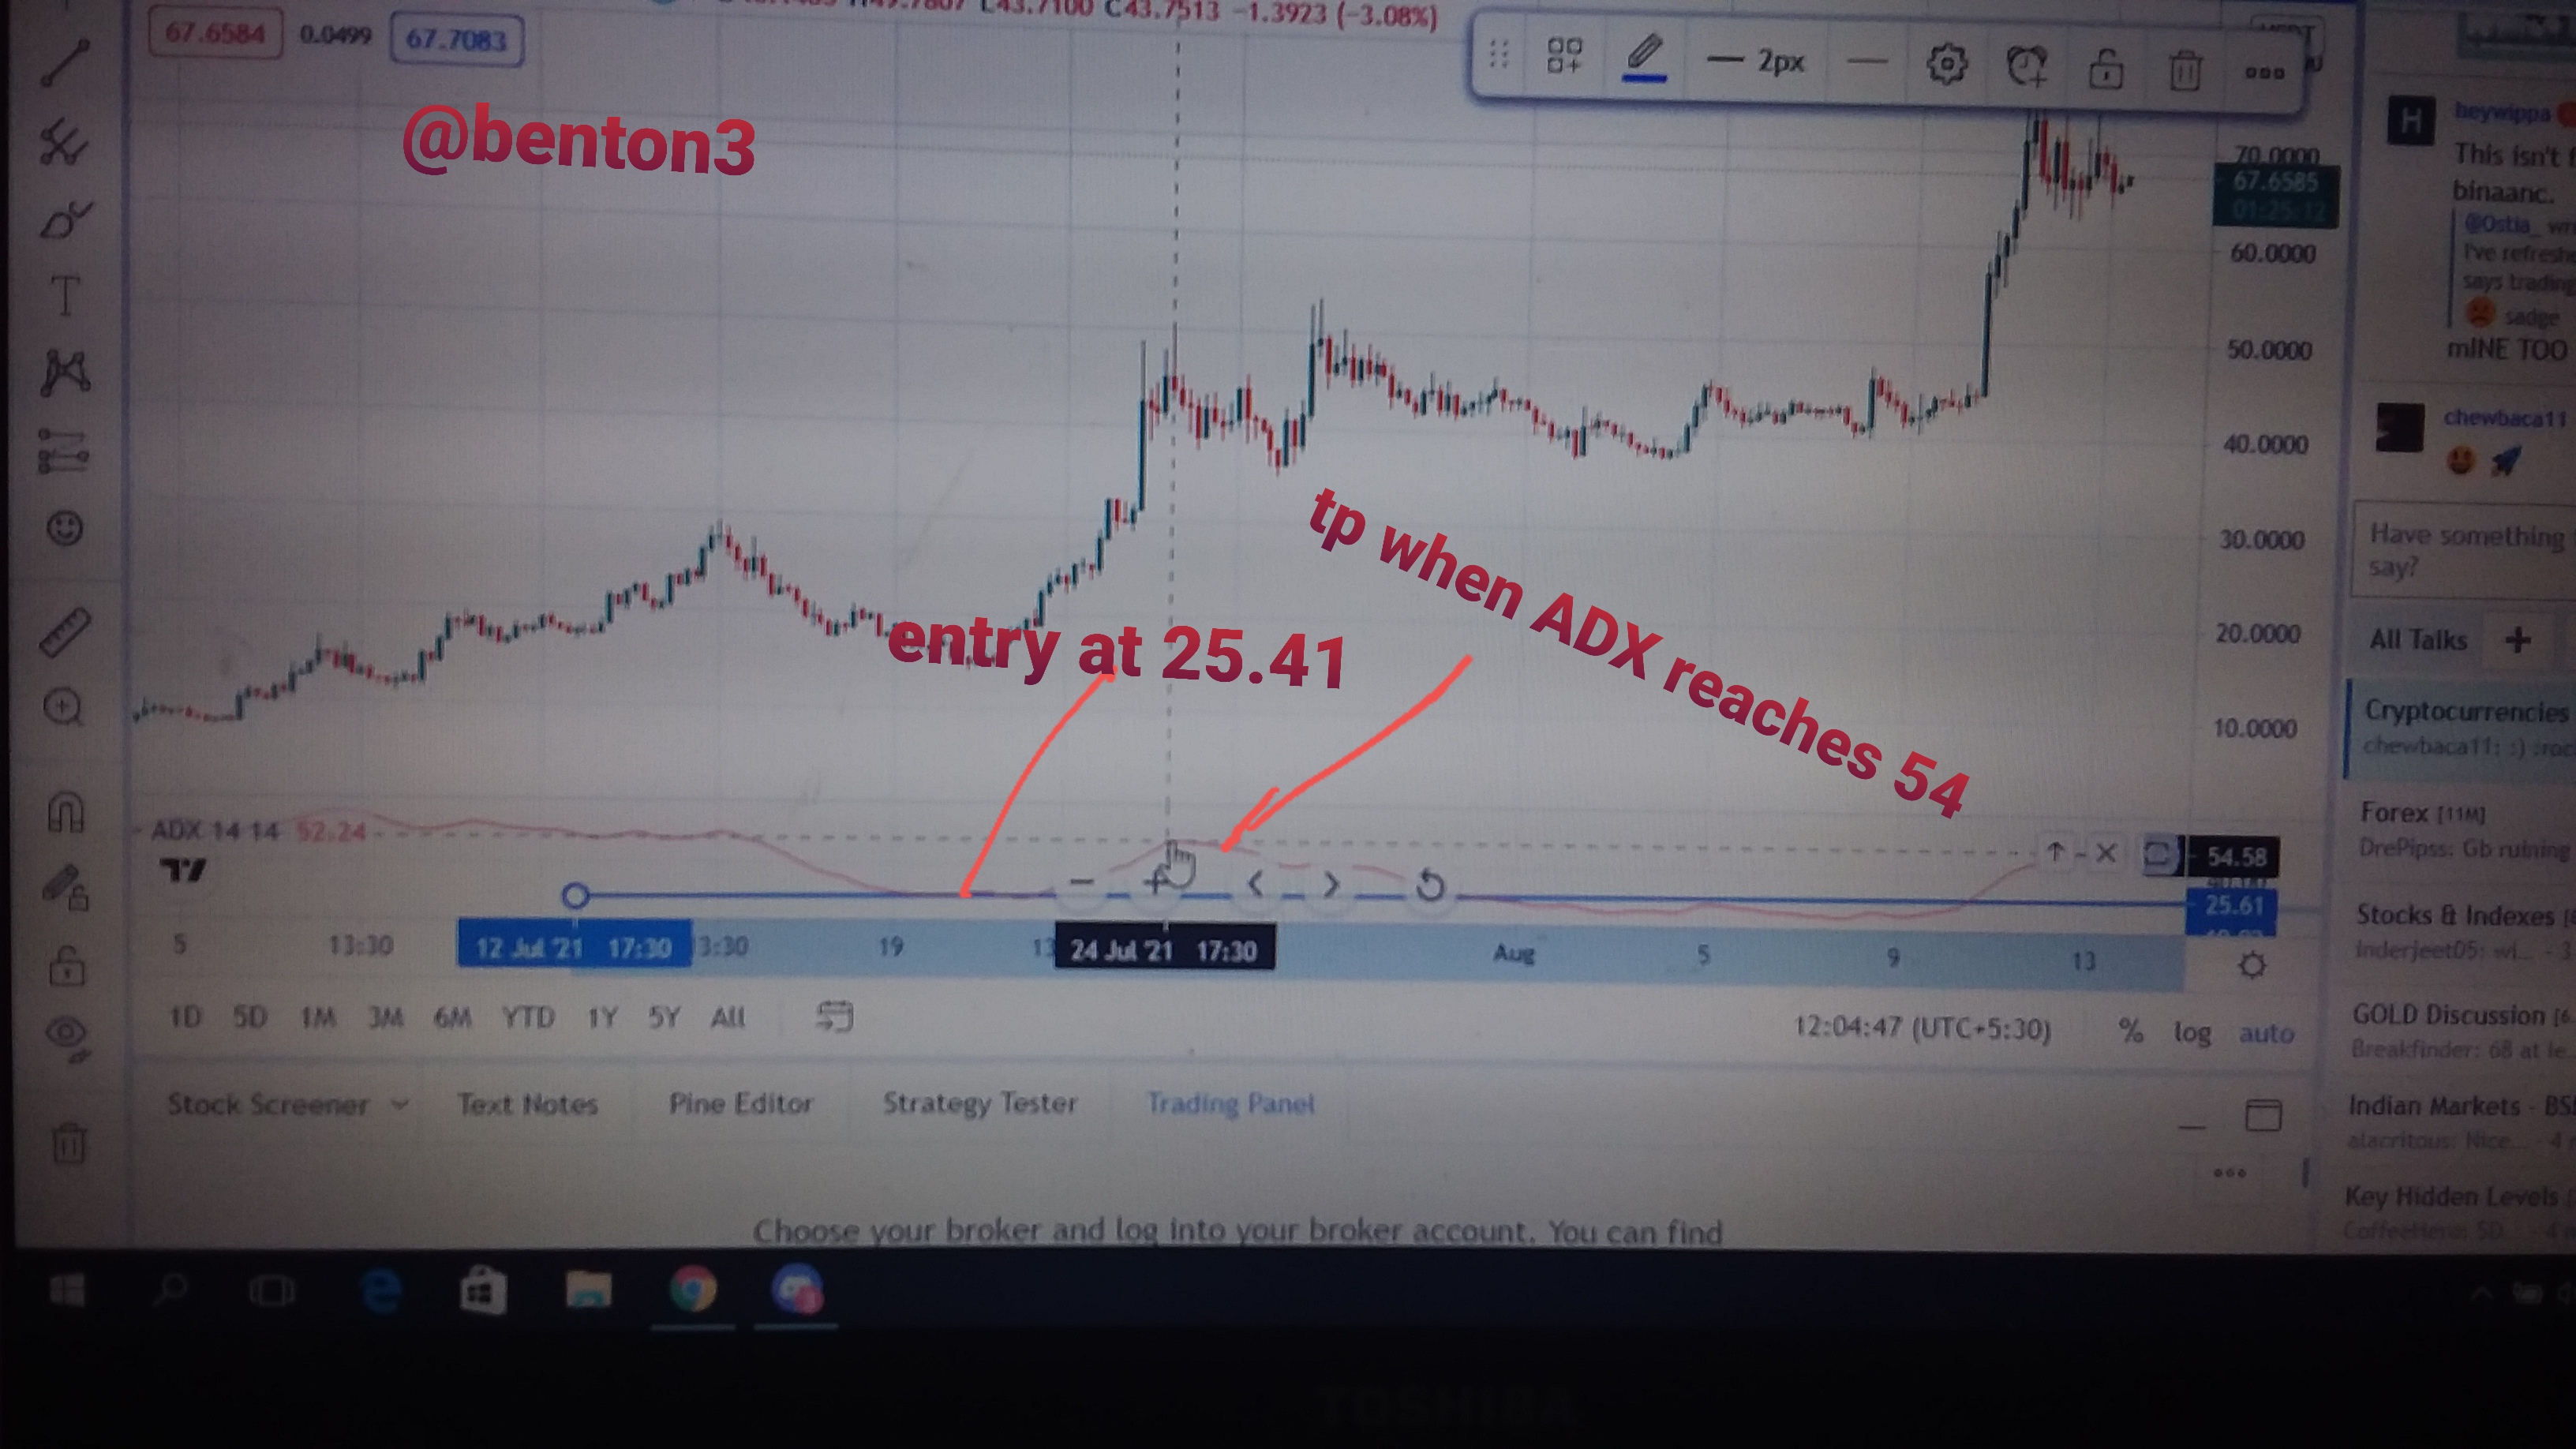
We can join the trend and exit at ADX 52. Looking at the chart, we can see how strong the trend was too.
So a trader can take advantage of the strong ADX reading and engage in a trade.
Adding other indicators like DI+ and DI- can further enhance the efficient functioning of the ADX making it easier for the trader to use.
Let us now use the same asset pair chart to explain this.
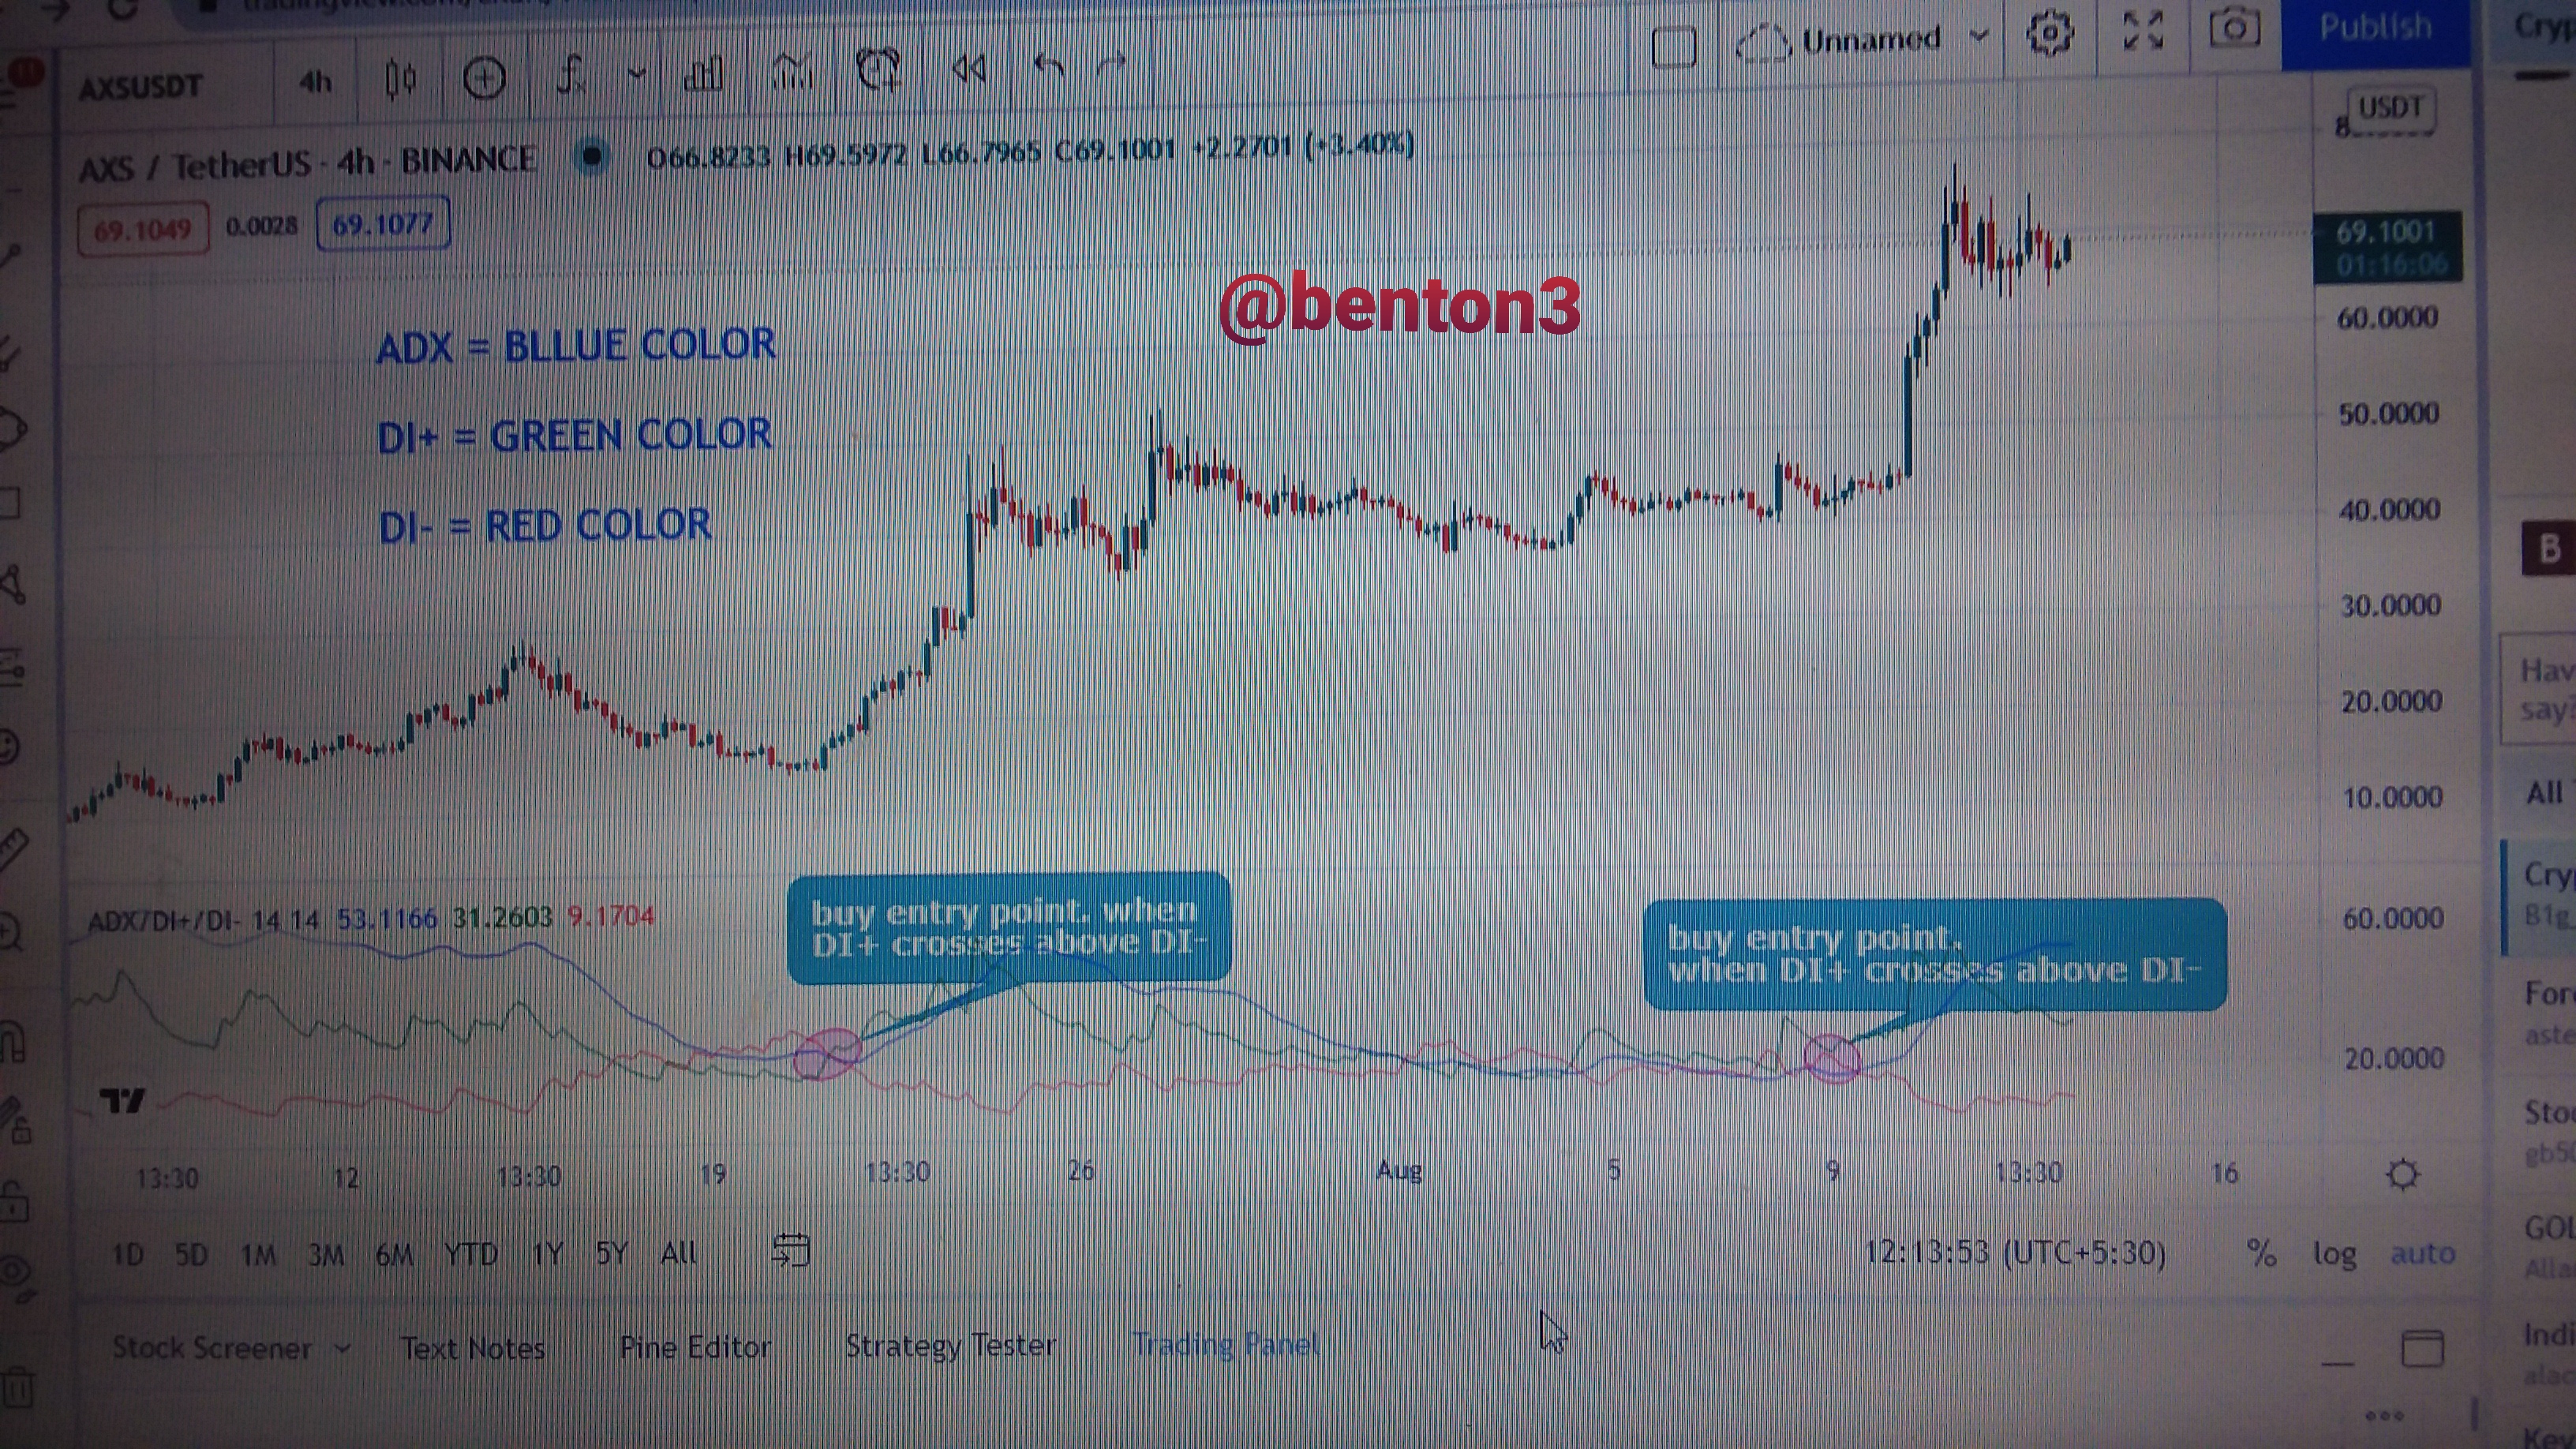
From the chart above, we can see the three curves represented by various colours. The DI+ and DI- indicates the direction of the trend. Thus when the DI+ crosses above the DI-, it was an indication of a strong uptrend marked with the circle notations
If you carefully compare it to the chart having only the ADX, you will notice that the cross occurred at exactly where the ADX was above 25. Both indicators now given credence to each other.
Therefore traders can maximize the use of ADX by employing additional indicators like DI+ and DI- to achieve trading efficiency.
What are the different trends detected using the ADX? And how do you filter out the false signals? (Screenshot required)
What are the different trends detected using the ADX?
There are four trends that can be detected by the ADX indicator. They are explained below.
No Trend or Weak Trend
This trend occurs when the ADX is at 0 - 25 zone. At this point none of the participants in the market(buyers and sellers) dominate the market. The market tends to be a ranging market operating within the boundary of a resistance and support.
We can refer to this point as a consolidation phase.
The chart below illustrates that.
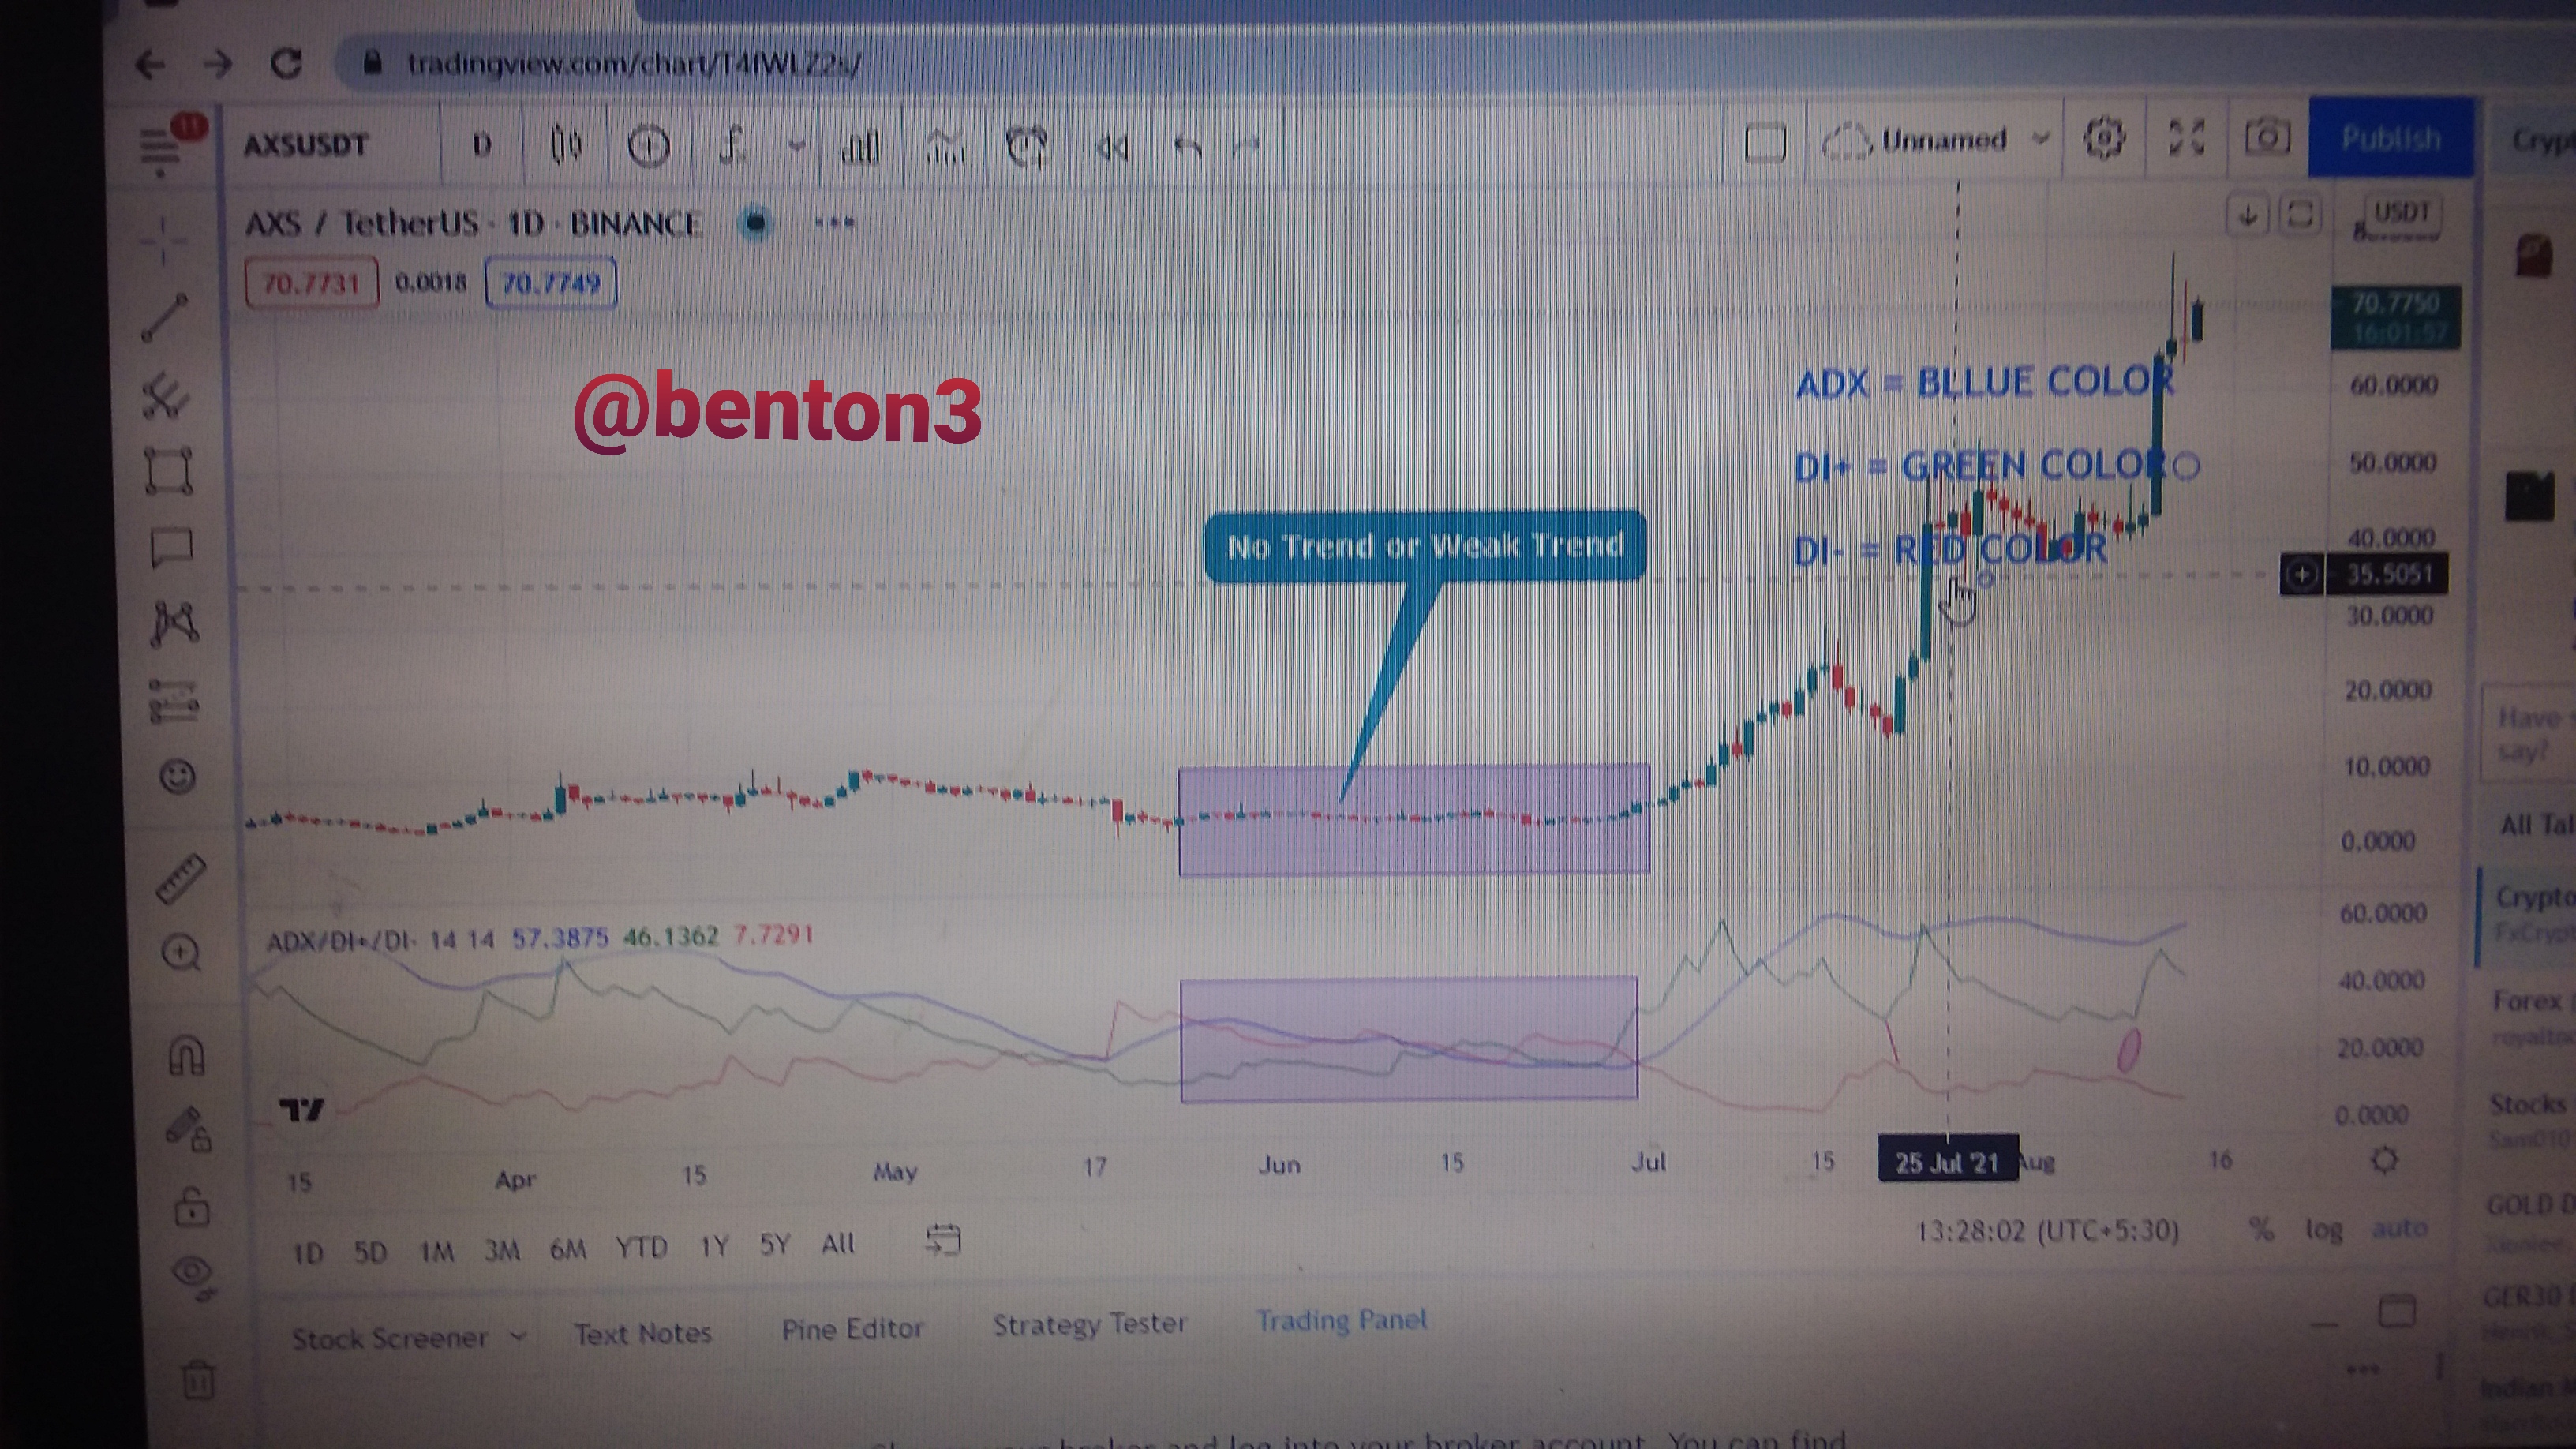
Looking at the chart, you notice the price have been in a ranging movement for sometime. Thus the ADX have been hovering between 0 - 24 values.
Strong Trend
The strong trend is dictated when the ADX is at the range of 25-50. This signifies a strong trend. It is an important point where trader usually engage in trade.
The chart below shows that.
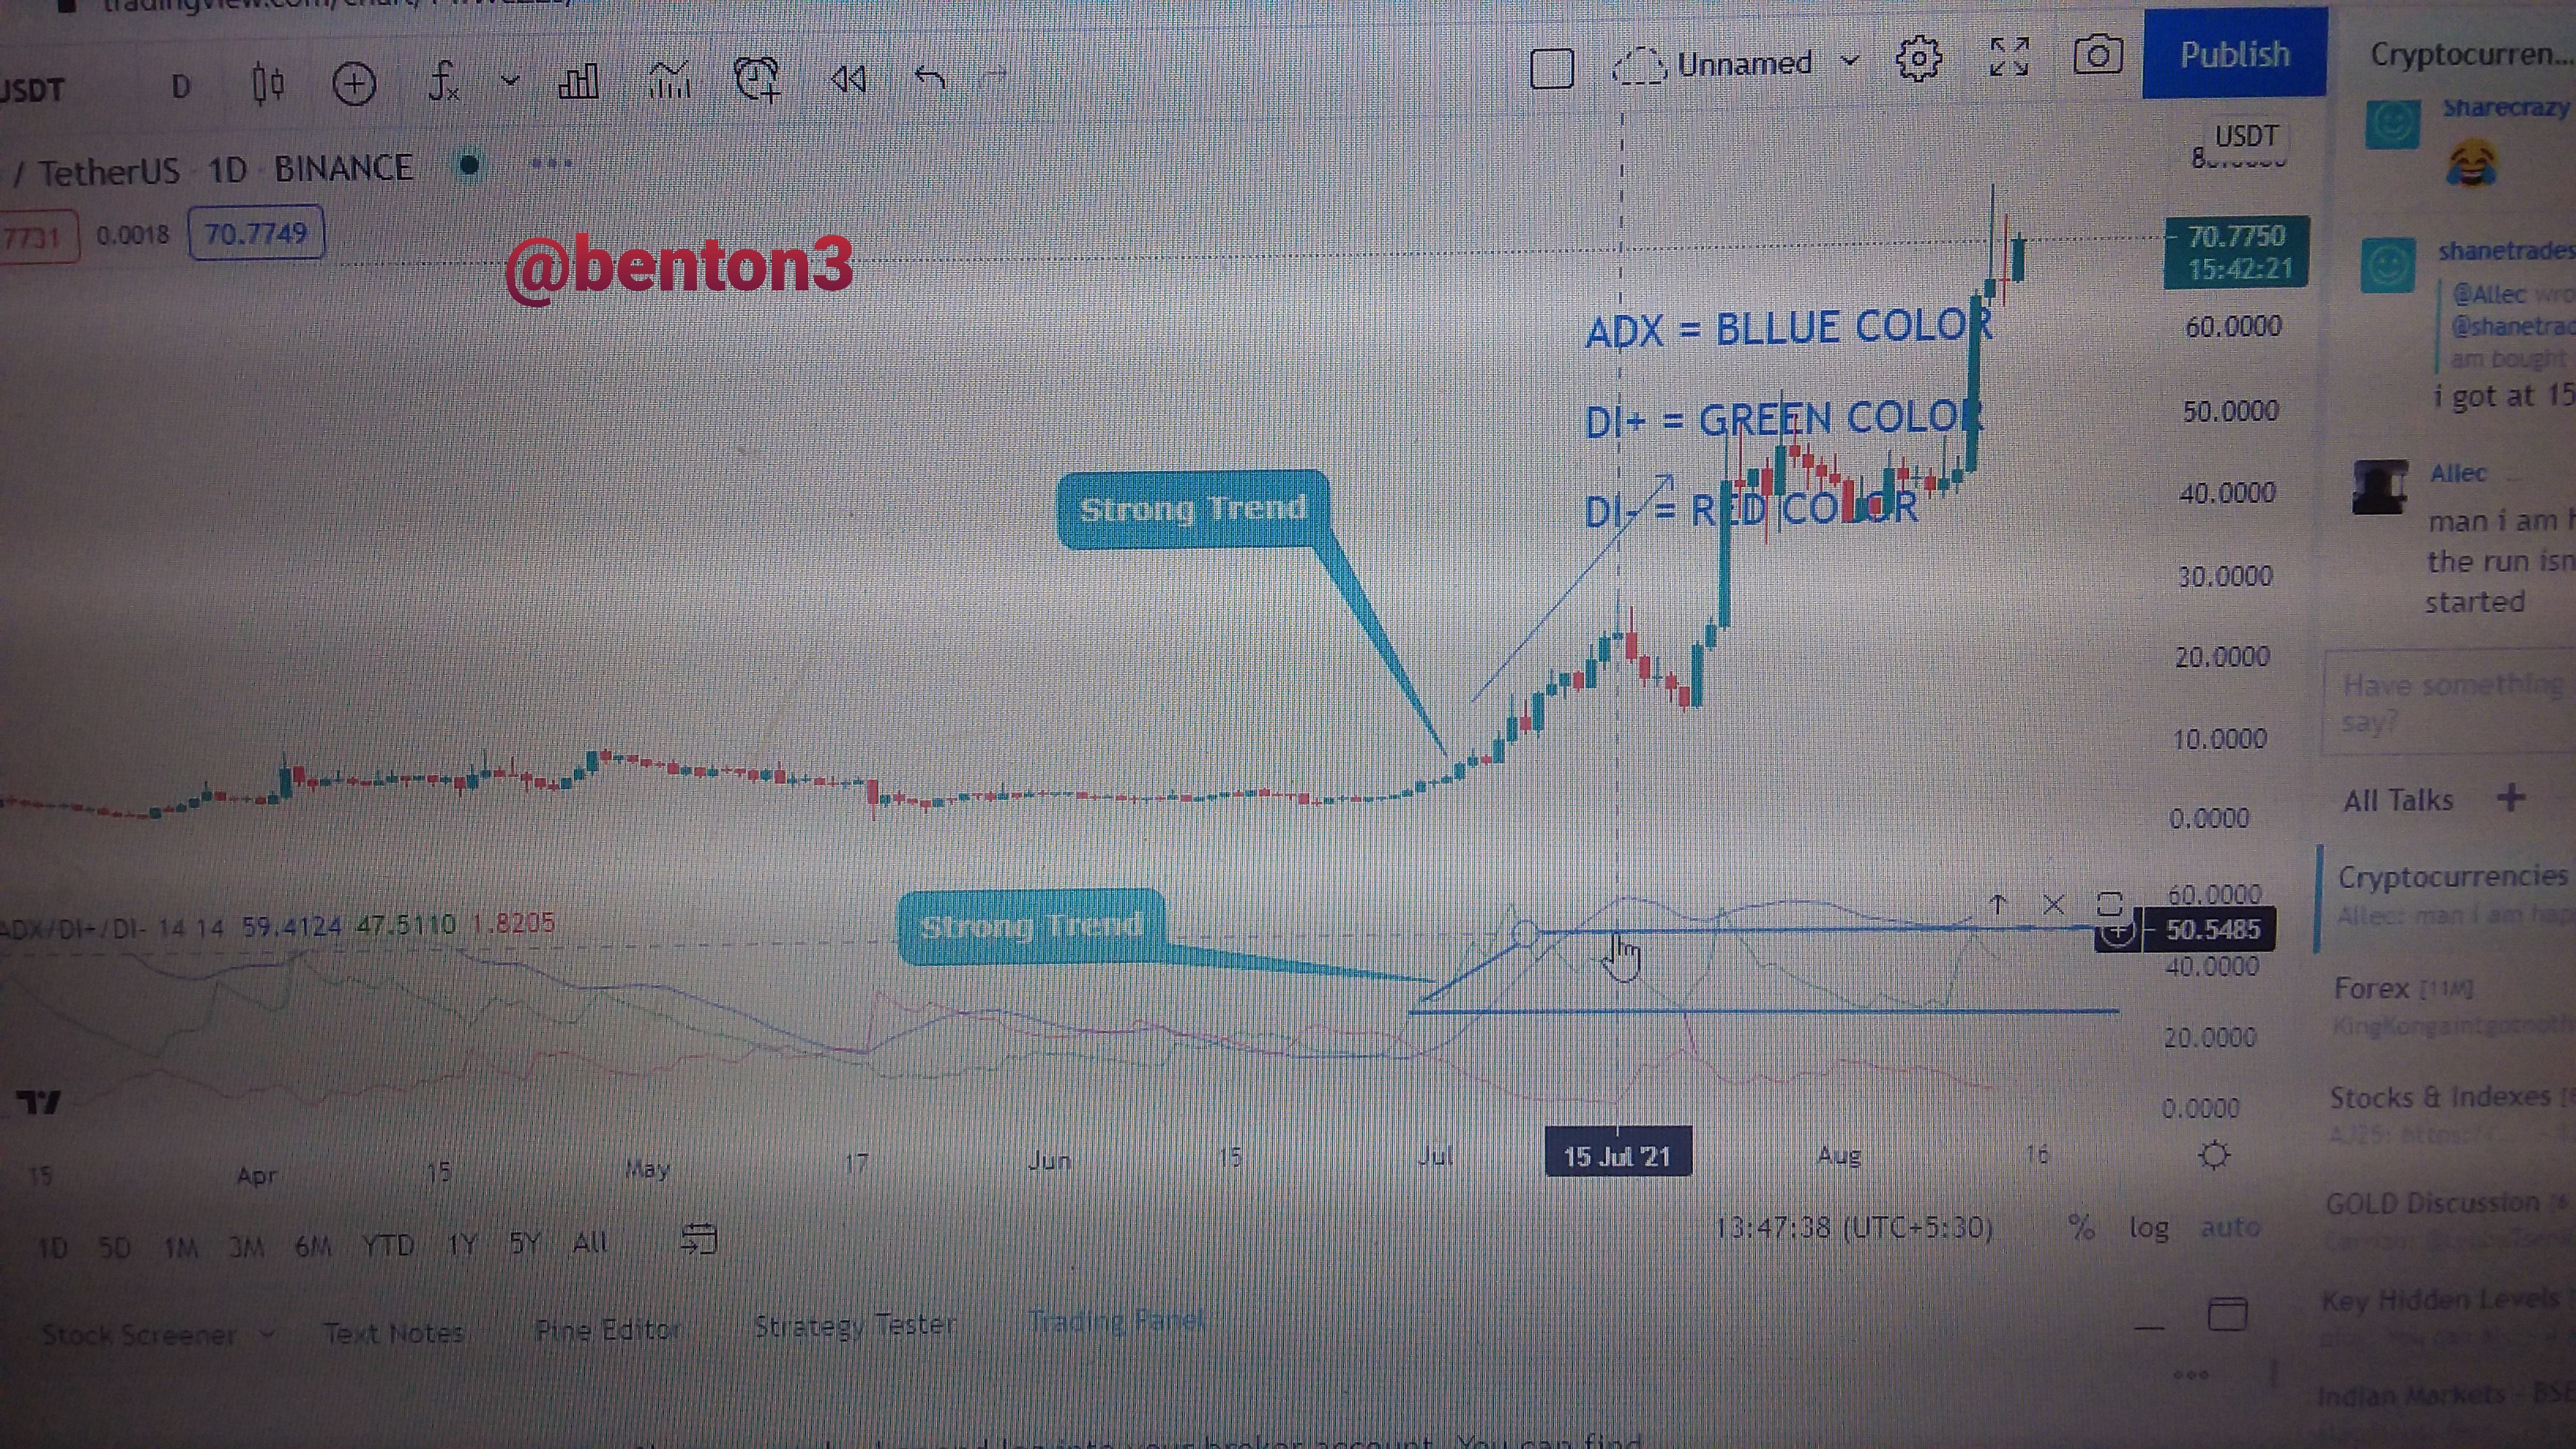
The horizontal lines on the chart shows the range from 25 to 50. It is good to note that the trend is easily identifiable and headed up
Very Strong Trend
Whenever we see the ADX in the range of 50 - 75, the trend is very strong. At this point, traders are very sure of the trend they are into. However, It usually very rare to see the trend operating in this area for a long time as a result of resistance and support.
This is shown in the chart below.
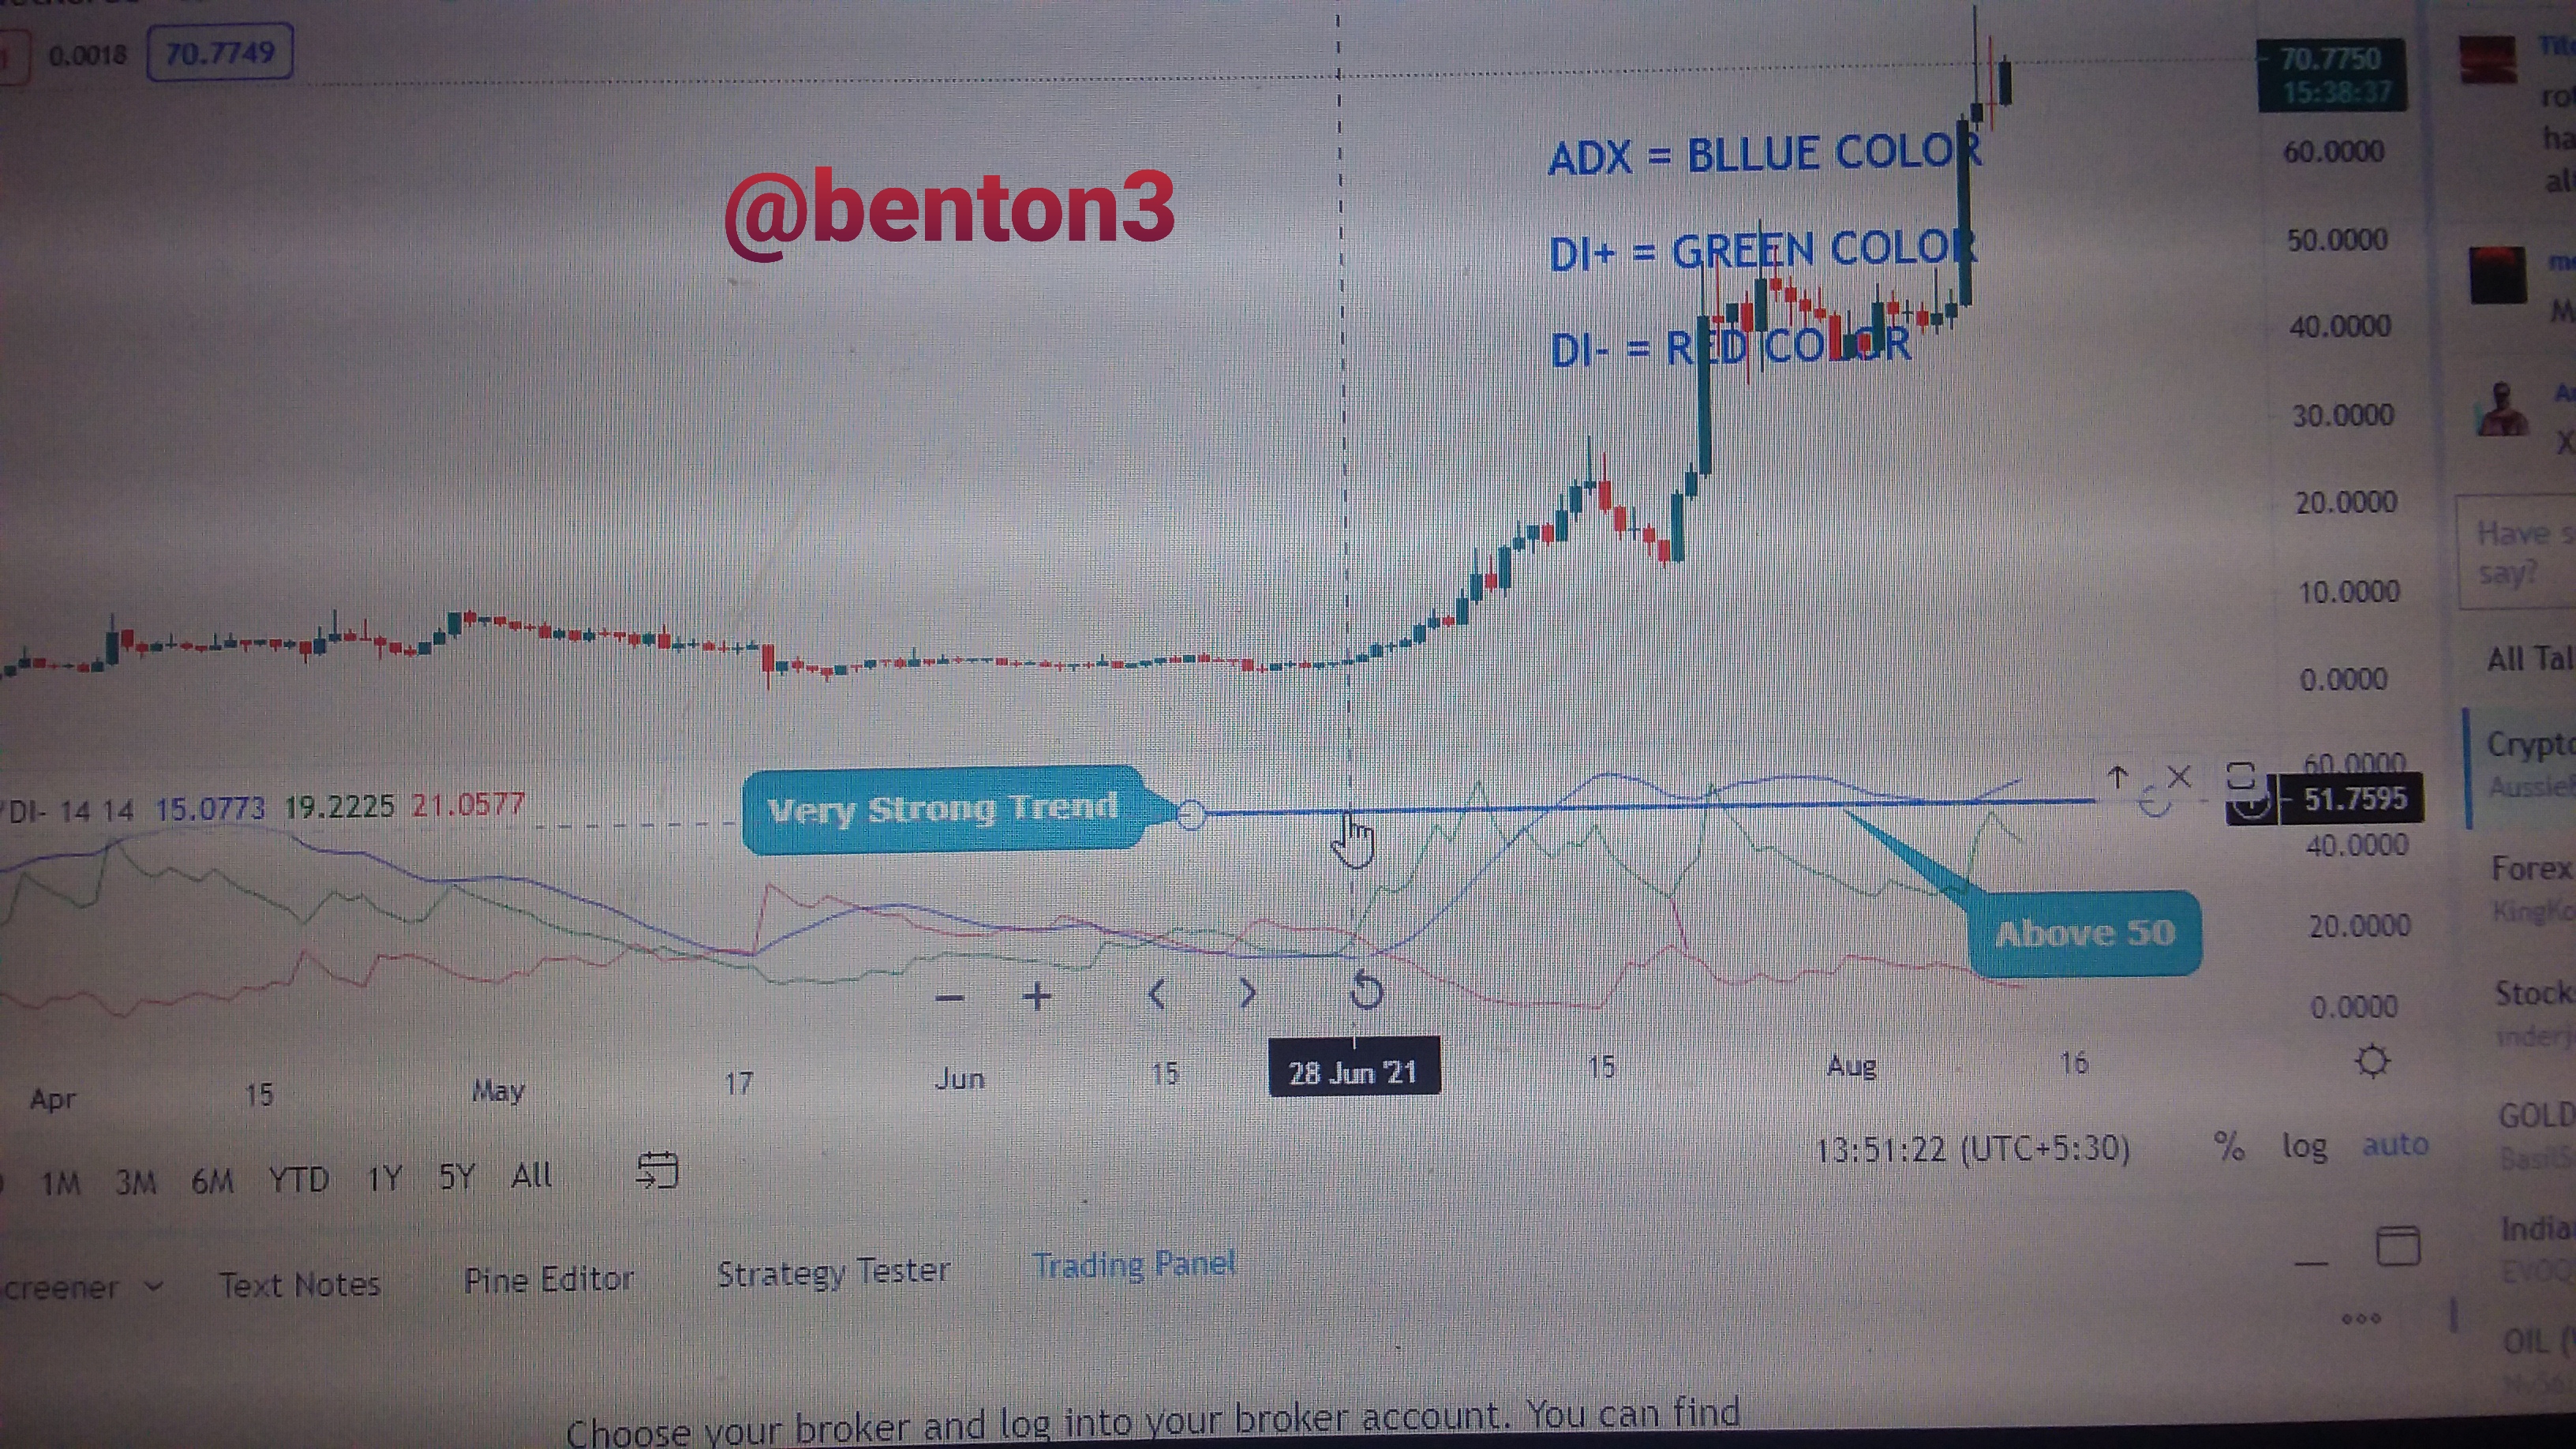
The area indicated with a horizontal line is the beginning of this range. You can also notice that it did not last long due to price action on resistance and support.
Extremely Strong Trend
This trend can also be detected by the ADX. The range of the indicator in the chart is between 75 - 100. It is an indication of a strong trend. It is usually very difficult and not common to see this range in an ADX indicator. I searched through various charts but could not see any.
And how do you filter out the false signals?
■ To filter out false signals using ADX, we have to be conscious of the periods we use when setting up the indicator.we earlier noted that the use of shorter periods leads to much volatility of the ADX indicator, thereby creating false signals. So it is advisable to use longer periods during set up to avoid such, in essence filtering out the false signal.
■ Another way we can filter false signals is by using another indicator in addition to the ADX. Adding the DI+ and DI- can also help to filter out false signals. We have earlier mentioned about the DIs crossing. Once the DI crossing occurs below the ADX 25 value range. It simply means that it is a false signal.
The chart below illustrates that.
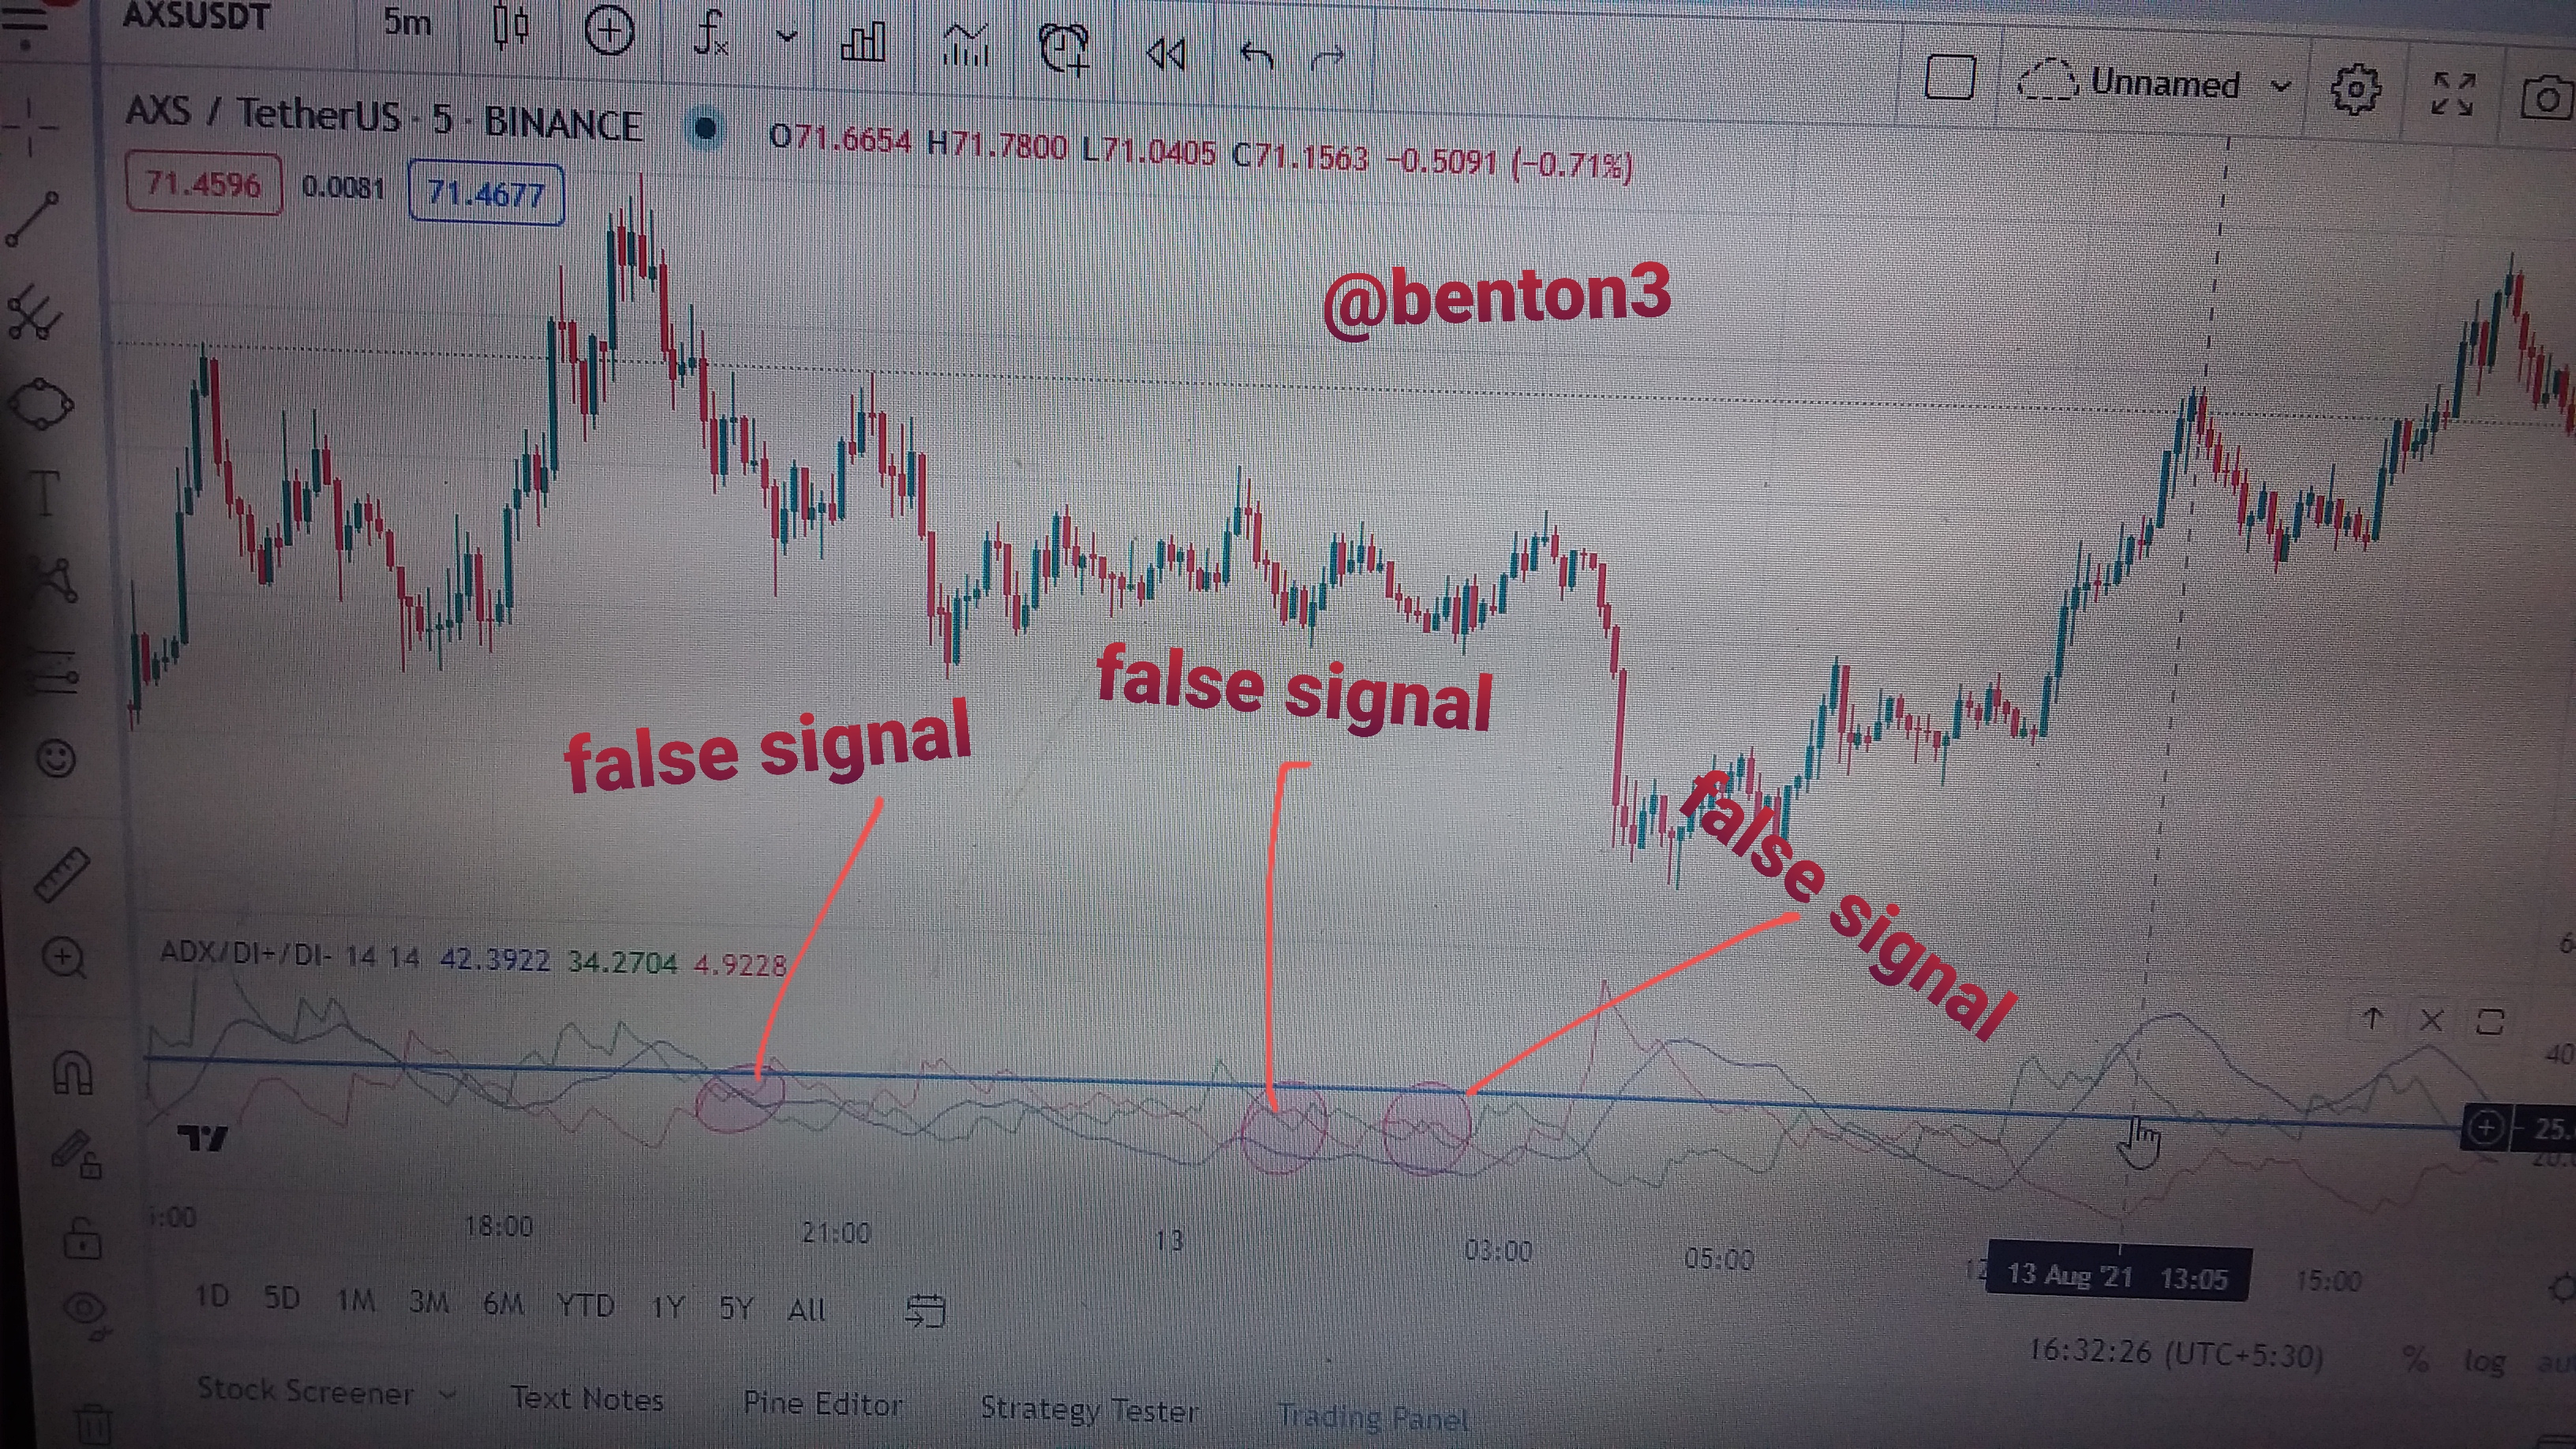
From the chart above we can see the three circled spots where the DI's inter cross. All these crosses happened below the 25 range of the ADX, totally invalidating them making them false signals.
Other signals like the RSI, Exponential Moving Average could also work along with the ADX to filter out false signals.

Explain what a breakout is. And How do you use the ADX filter to determine a valid breakout? (Screenshot required)
Explain What breakout is
Breakout simply can be defined as when there is a break in a previous support or resistance the crypto chart of an asset.
During an upward trend, there are resistances where former supports were. Thus the price will need to break through the resistance in order for the price to continue surging forward, creating a new higher and higher low. So crossing that resistance is referred to as breakout.
In the same way, during a downward trend, price gets to a place known as support, where it finds it difficult to cross and continue its movement down. These supports were formerly resistance. So the price crossing the blockade or support so to speak is known as breakout. The price would continue to move down creating new lower lows and lower highs.
In both scenario, the price retests both the support and resistance several times failing to breakout, before it finally does so.
And How do you use the ADX filter to determine a valid breakout?
ADX indicator can be used to determine a valid breakout. First we need to add the ADX indicator and the DI's in our pairs chart. At least, we now know that it is only used for measuring trend strength. For any trend to be valid, it must be above the 25 range. So any breakout below the ADX range 25 is not valid.
Now let us look at a false valid breakout using the chart below.
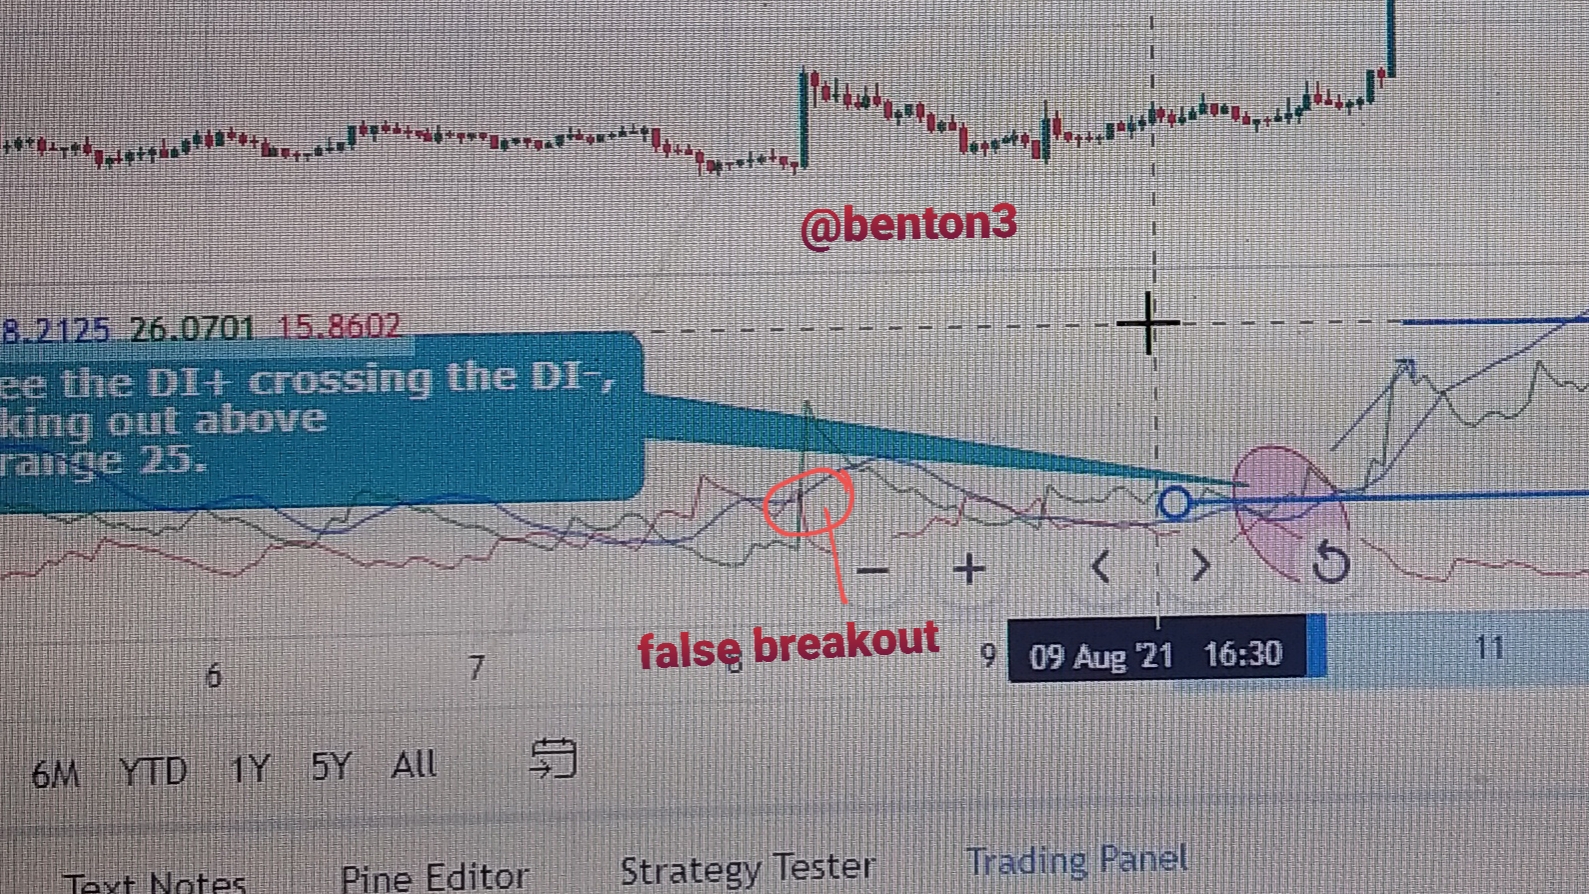
From the chart below, we notice that there was a first breakout. But it was not a valid breakout because, it occurred below the 25 ADX range. We also saw that it immediately went back to its ranging market status. Thus the ADX filtered a false breakout.
Let us now see an example of a valid breakout.
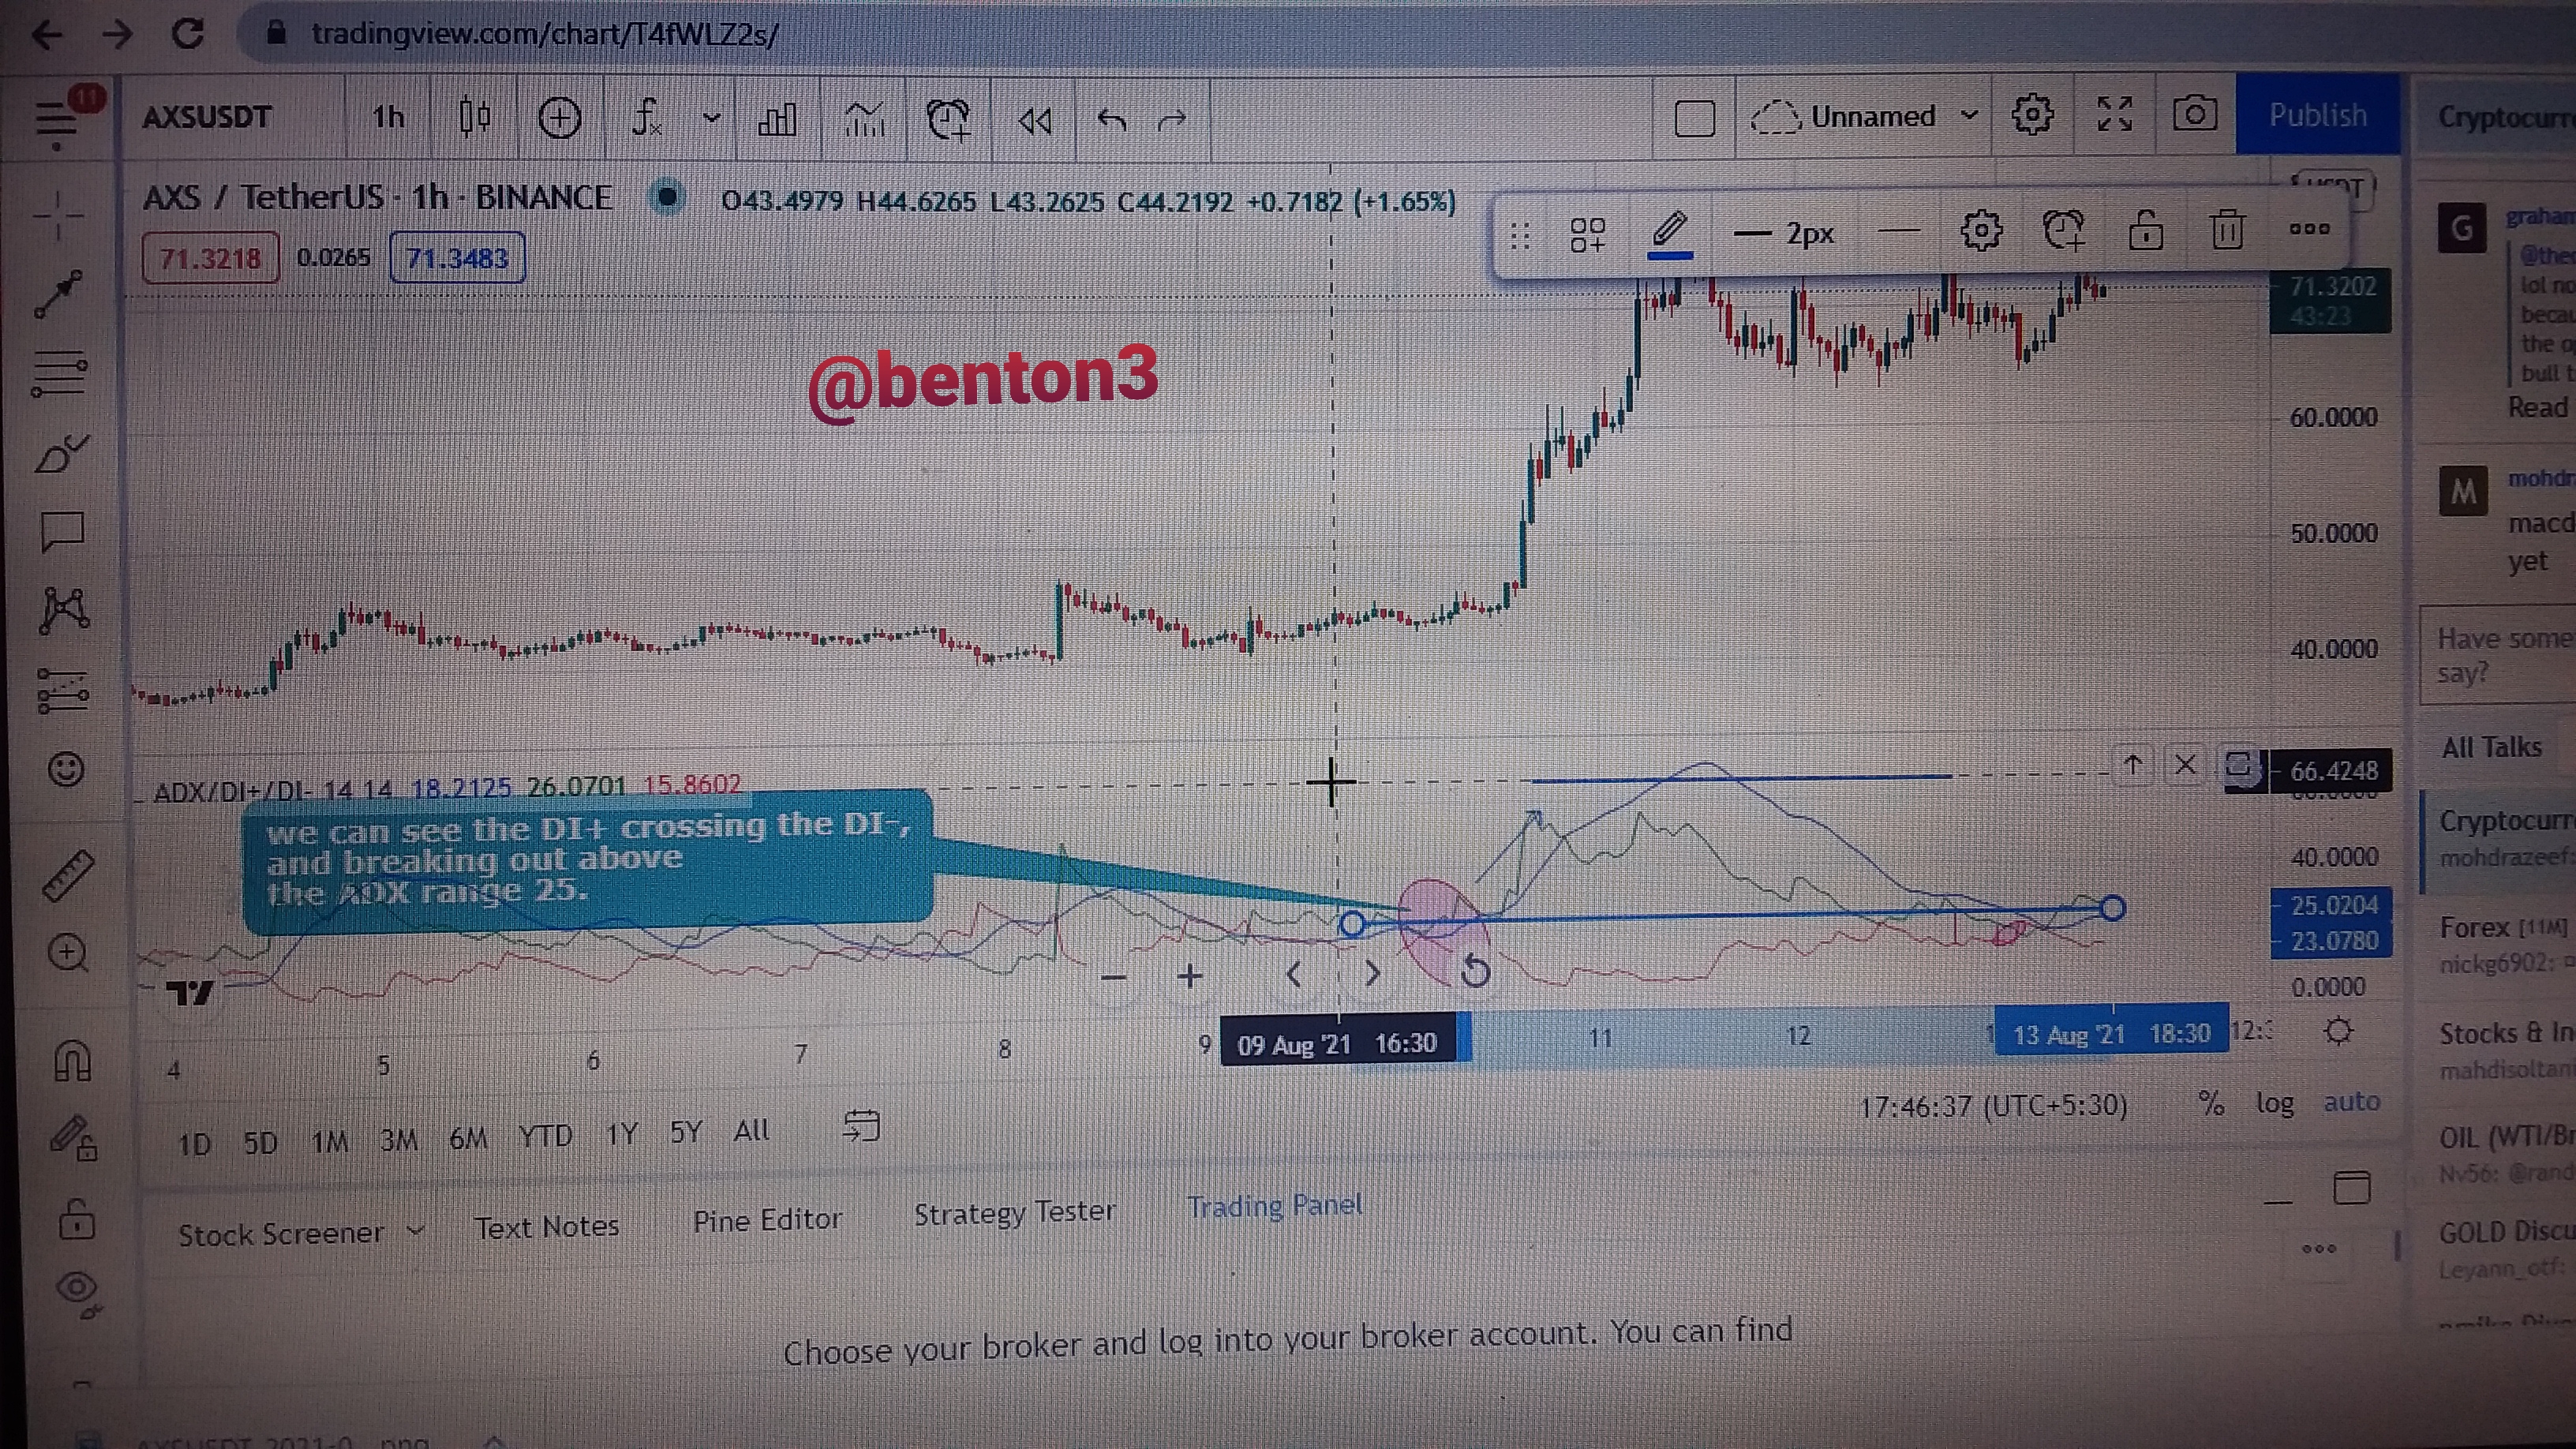
From the area circled on the chart, we can see the DI+ crossing the DI-. But that is not enough to confirm the breakout, until the ADX was at 25 and above , which we can see with the first horizontal tool line. This confirms the breakout. We also saw from the chart, that the trend was a strong one upward from the range height of the ADX which got to as high as more than 60.
Thus we can see that the ADX indicator was used in filtering out valid breakout.
What is the difference between using the ADX indicator for scalping and for swing trading? What do you prefer between them? And why?
What is the difference between using the ADX indicator for scalping and for swing trading
ADX indicator for Scalpers
ADX indicators are used be Scalpers with other indicators or tools to determine resistance and support. For the scalpers they use a ADX period of 100 which moves along with price will help them enter the market and exit immediately. Even though so many false signals will be generated, other indicators used will smoothen them out.
Scalpers usually use it in small timeframes like 1minute and 5mins.
ADX indicator for Swing traders
Swing traders use ADX indicators with other two to be sure to get the appropriate entry point for their trades. Their setting will be used in higher timeframes like 4hrs and 1 day. The setting of the period would be used depending on the timeframe the trader chooses but shoud be between 14 and 30.. Since we know that longer timeframes delays in producing signals, using other indicator like EMA 200 and pivotal point and even fibonacci can be a source of great assistance in quickly identifying resistance and support as well as entry signals.
So the major difference is the setting
For scalpers, lower timeframes are used.100 periods are also used in setting the ADX indicator
For swing traders higher timeframes are used. Periods of above fourteen but not more than 30 are also used depending on the trader, to give more accurate result.
What do you prefer between them? And why?
For me I would prefer the swing trade strategy because, I would not like to be checking on my system every minute just to monitor my trade which is evident in scalp trading. So swing trade gives me some liberty to do other things for myself. Additionally, I also require less indicators if I am a swing trader, thereby giving me a much visible and clearer chart to work on. ADX indicator can as well be used in swing trading more perfectly than in scalp trading, giving me the opportunity to make more profit without jumping out immediately.
Conclusion.
It has been a great time learning about ADX indicator and its uses. I have learned that the ADX indicator on measures the strength of a trend, whethet it is weak, strong, very strong and extremely strong. I have also learned it works more perfectly well with other indicators, that can assist a trader enter a trade appropriately.
I have also learned how to trade with it, filter false signals, filter a valid breakout, scalp and swing trade using ADX indicator. The work of the DI's and how it helps in determining transaction entry is another plus to this lecture.
Thanks you so much @kouba01 for this nice class.
Hello prof @kouba01. I got your upvote, but could not see your homework rating. Please check If I am mistaken.
Thanks.
Hello @benton3,
Thank you for participating in the 7th Week Crypto Course in its third season and for your efforts to complete the suggested tasks, you deserve a 9.5/10 rating, according to the following scale:
My review :
Excellent work which covered the subject in all its aspects in a superb manner and with a solid methodology. Most of the answers were precise and direct.
A good and deep explanation of ADX indicator with a great effort to interpret its complex method of calculation.
In the last question, your answer was general as you did not go into details and did not provide some illustrative examples.
Thanks again for your effort, and we look forward to reading your next work.
Sincerely,@kouba01
Hi sir
Hi sir
Sir spourt me plz