The Iran War's Real Threat Isn't Oil. Here's What to Watch Instead.
Hi, we're Bitbaby Research.
We put this together because we think most people are only seeing the surface of what's happening right now.
TL;DR
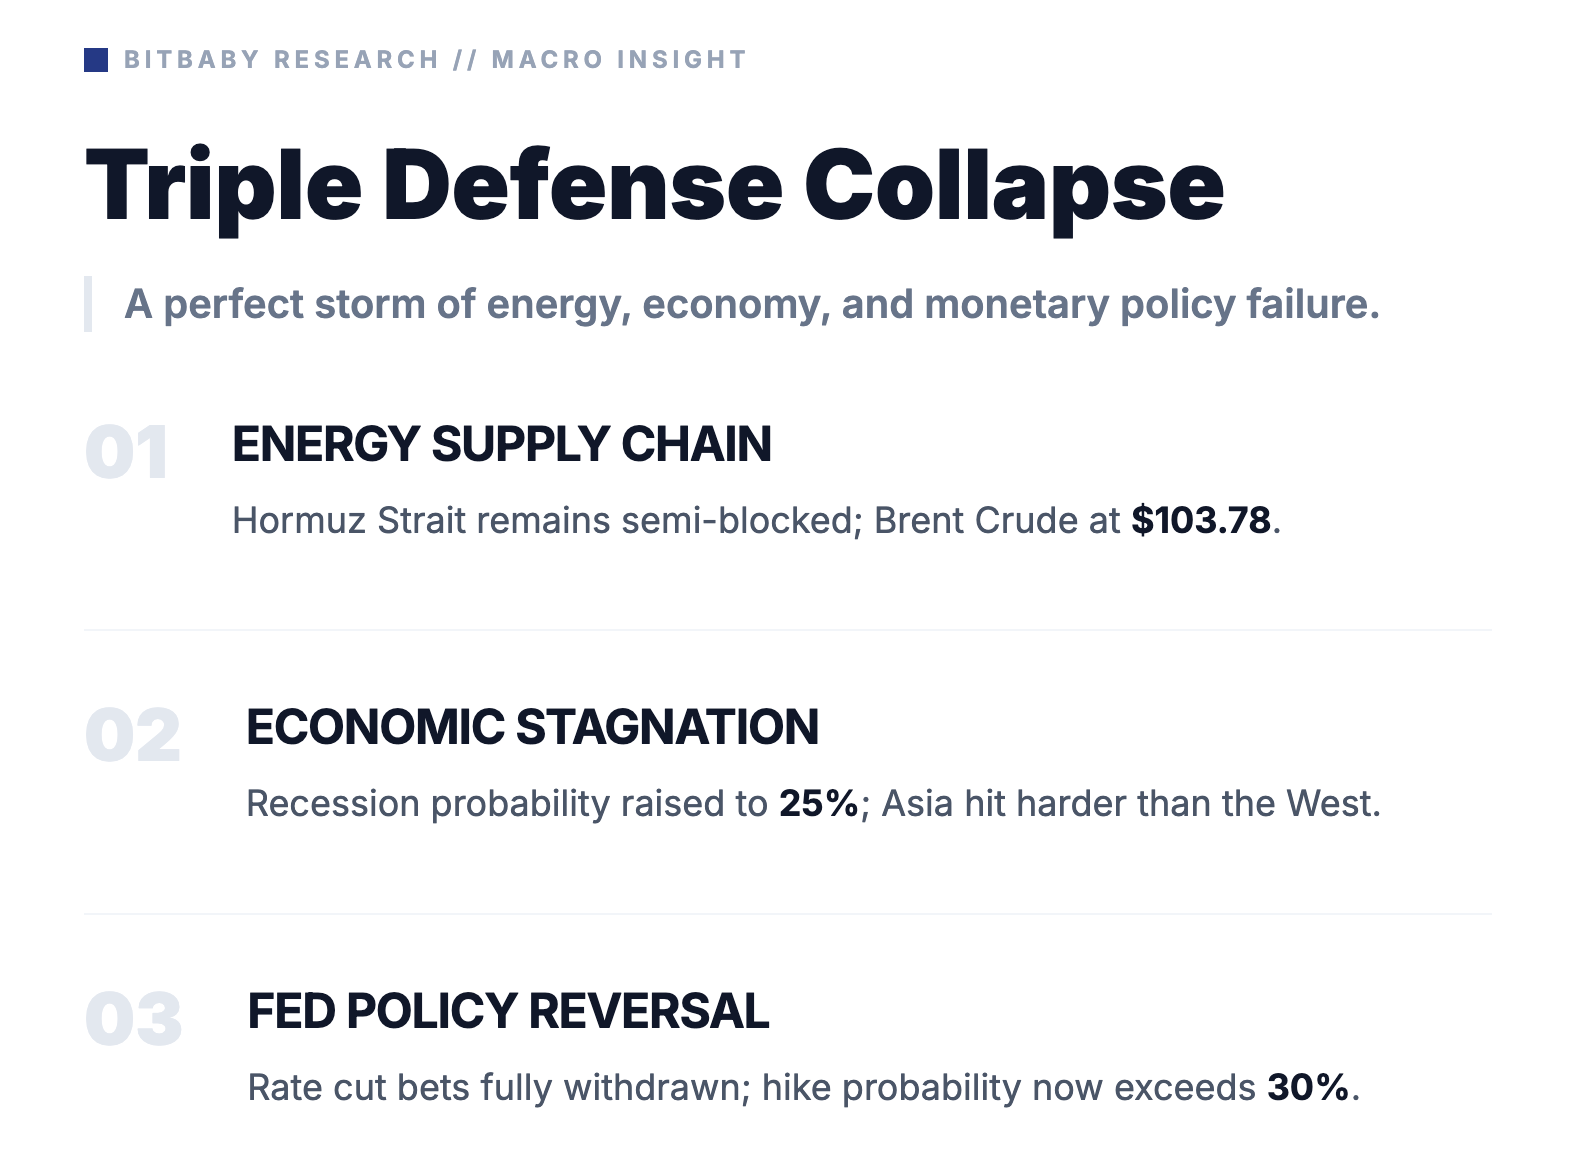
Brent crude up 43% in a single month, but oil price is the surface, not the most dangerous part of this crisis
The Strait of Hormuz remains in semi-lockdown. Asia depends on it for nearly 70% of its oil supply and is taking far more damage than the West
Markets started 2026 pricing in two rate cuts. According to CME FedWatch data as of March 27, 2026, the probability of a rate hike by year-end has crossed 30%
Goldman Sachs raised recession odds from 20% to 25%. BMO Chief Economist Douglas Porter stated that if the shock lasts beyond 6 weeks, its impact on inflation and growth will no longer be temporary
Trump's April 6 strike deadline and the Strait of Hormuz "transit fee" model are the real drivers of short-term oil prices, not the daily headlines
Why Three Fault Lines Breaking at Once Is a Historic-Level Event
1973: The First Oil Crisis Oil surged nearly 300% in four months. The US fell into recession, inflation hit double digits, and unemployment rose at the same time. The lesson: when energy costs spiral out of control, no asset class is safe.
1978: The Iranian Revolution Triggers the Second Oil Crisis The Fed was forced to raise rates to nearly 20% to bring inflation down. The cost was the severe recession of 1981 and a generation of investors scarred by the memory of a full rate hike cycle.
2008: Oil Hits $147 All-Time High Global financial markets collapsed in the second half of that year. Oil was not the only reason, but it was the final push that sent an already fragile system over the edge.
It is now 2026. Day 30. Brent at $103.78.(As of March 27)
Three Breakdowns, Layered
Board 1: Energy — What Everyone Sees vs. What They're Missing
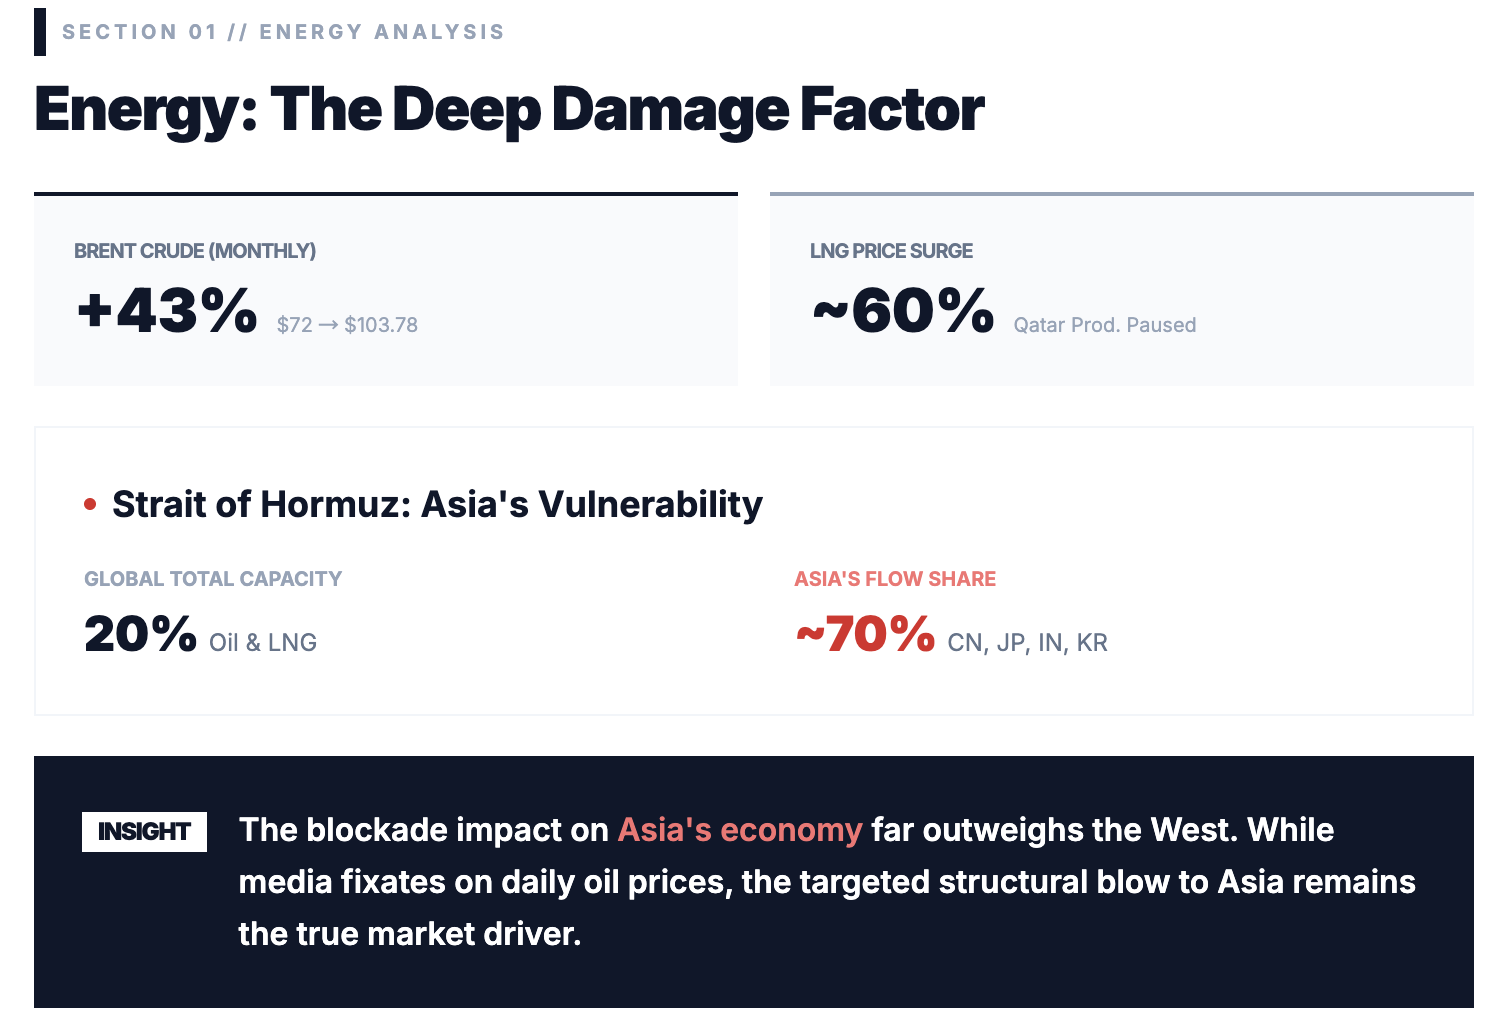
Bitbaby Research take: every additional day this strait stays closed, Asia pays a price that far exceeds what the West is facing.
Brent crude up 43% in one month ($72 to $103.78). LNG up nearly 60%. On March 2, QatarEnergy suspended LNG production after an Iranian drone strike.
Qatar supplies 20% of global LNG. That gap does not close in a matter of days.
The Strait of Hormuz carries 20% of the world's oil and 20% of its LNG. Iran is currently allowing non-hostile tankers to pass after paying a fee, with over 20 vessels having transited, but global shipping companies still rate it as a high-risk corridor and volumes are far from pre-war levels.
China, India, Japan, and South Korea together account for nearly 70% of the oil that passes through the strait. This number alone explains why Asian markets have fallen harder than anyone expected. It has barely appeared in Western headlines.
Board 2: Markets — Numbers That Have Entered People's Daily Lives
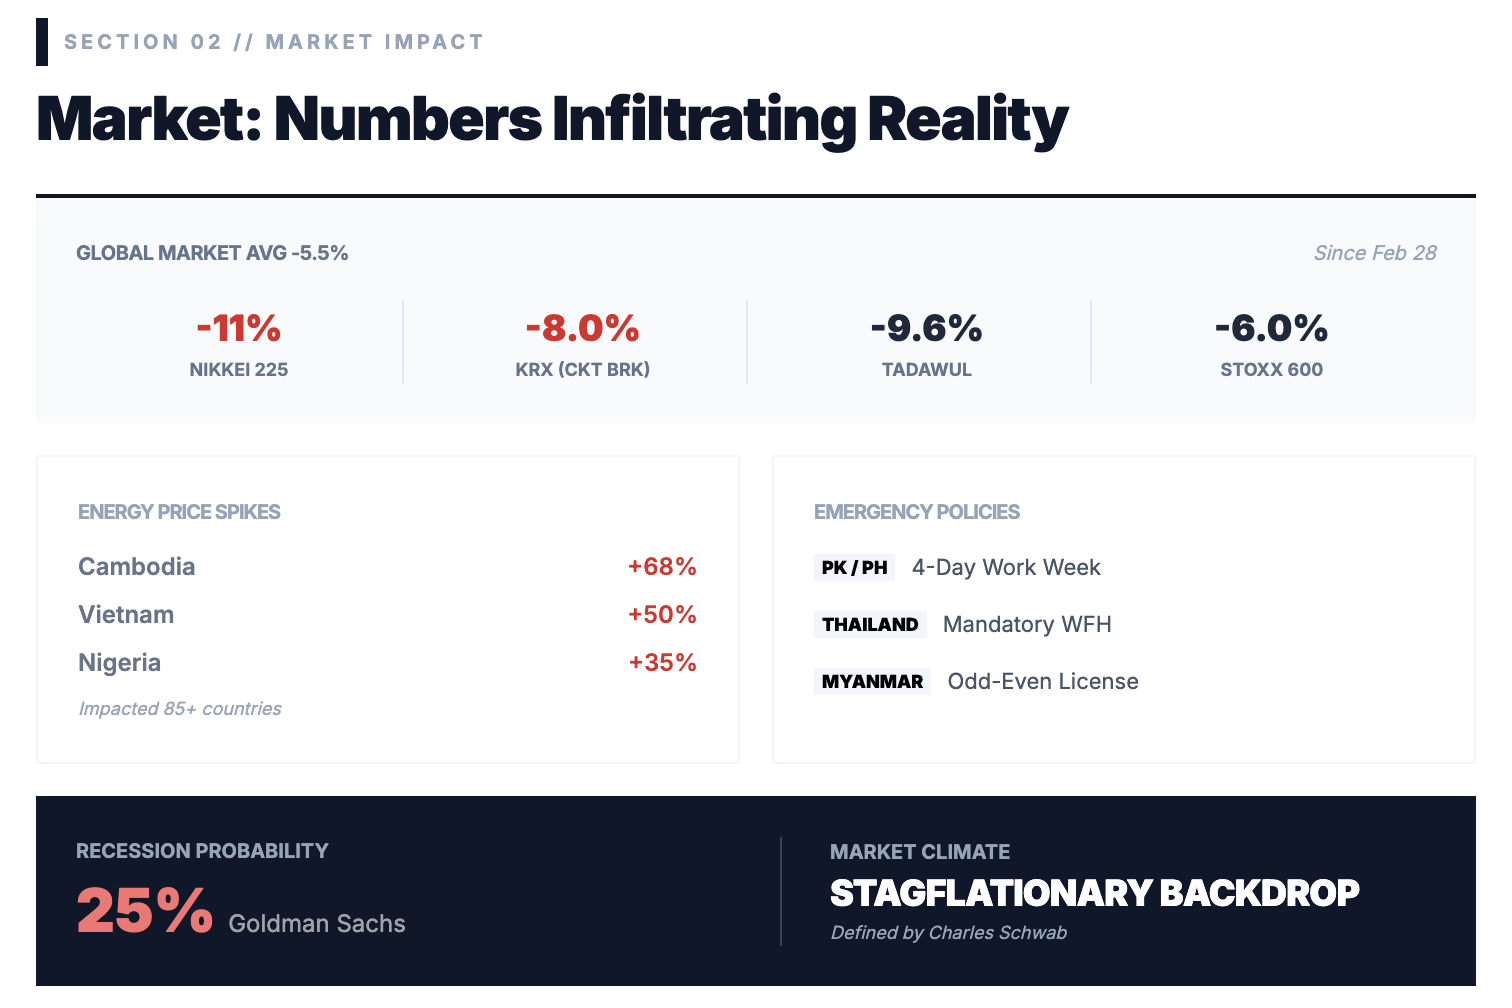
Bitbaby Research take: this is no longer just financial market volatility. It has become something ordinary people feel every day, across dozens of countries.
Global equities have fallen an average of 5.5% since February 28, but Asia has been hit harder. Japan's Nikkei 225 down 11%. South Korea down 8% and triggering circuit breakers, with the Korean won approaching 1,500 per dollar. Saudi Arabia's Tadawul down 9.6%. London's FTSE 100 down 5.3%. Europe's STOXX 600 down 6%.
At least 85 countries have seen fuel prices rise. Cambodia up 68%. Vietnam up 50%. Nigeria up 35%. Pakistan and the Philippines have moved to four-day work weeks. Thailand made work from home mandatory for government employees. Myanmar introduced odd-even day driving rules.
Goldman Sachs raised its recession probability from 20% to 25%. Schwab's Head of Macro Research Kevin Gordon described the current environment directly as a stagflationary backdrop.
BMO Private Wealth Chief Market Strategist Carol Schleif noted that if oil and rates both keep rising together, the damage to economic growth becomes direct and hard to reverse.
Board 3: The Fed — The Most Underpriced Variable
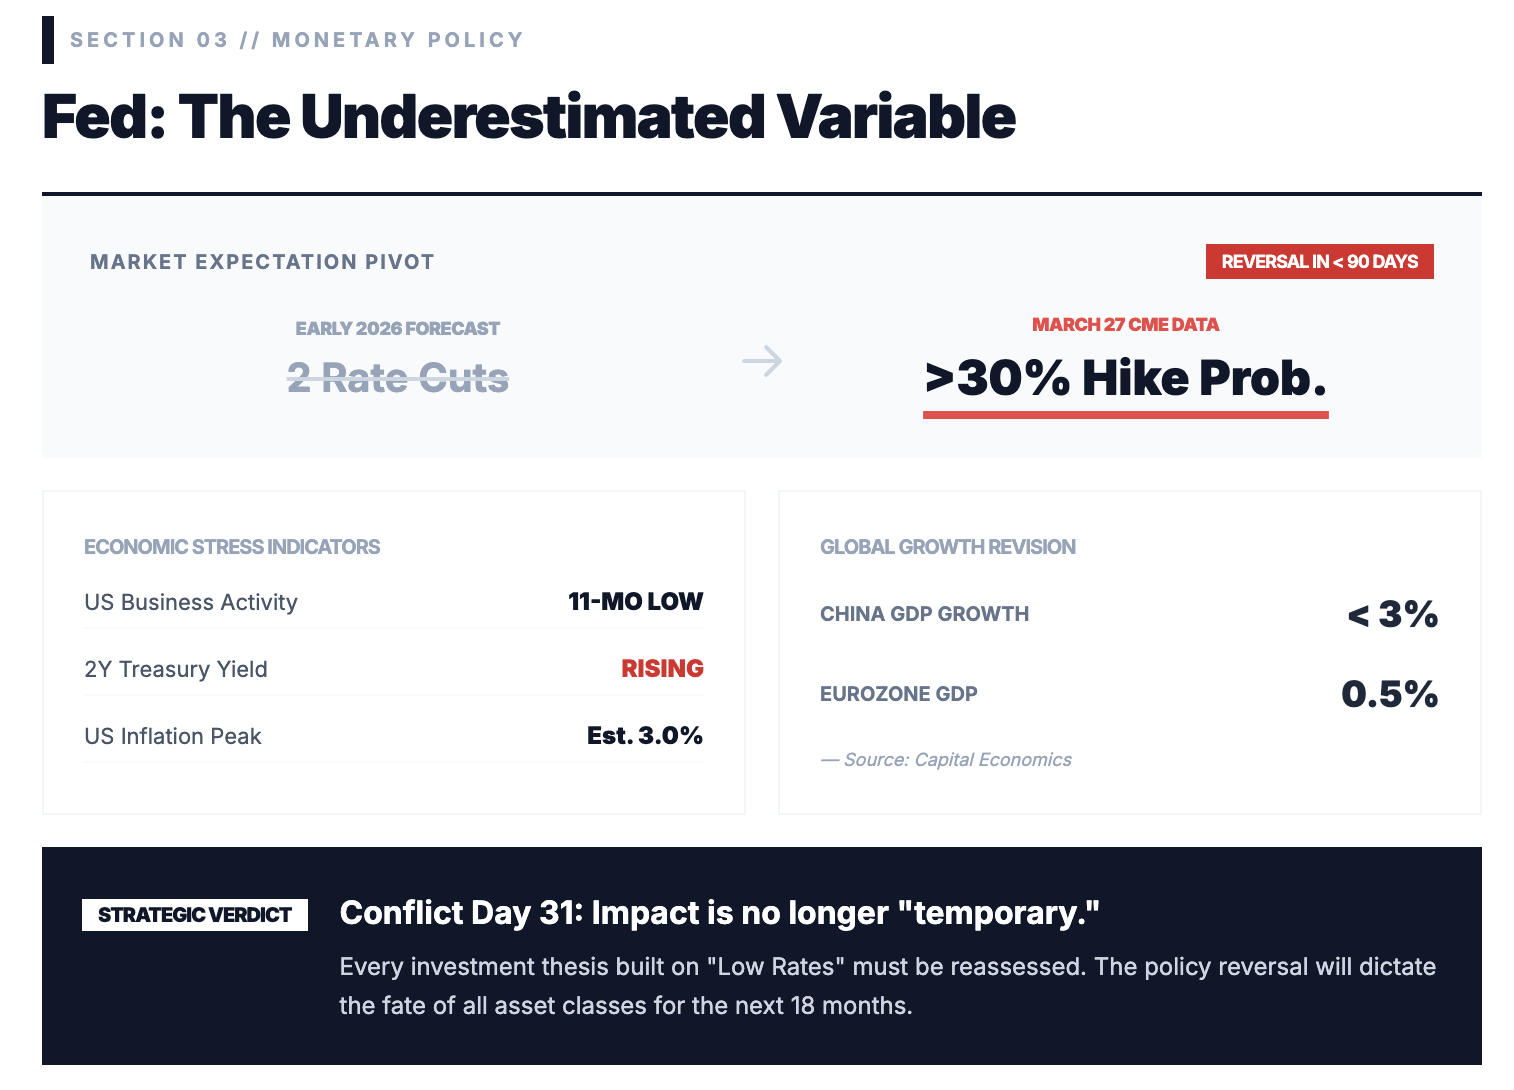
Bitbaby Research take: the shift in monetary policy direction is what will determine the fate of every asset class over the next 18 months.
At the start of 2026, markets were pricing in two rate cuts for the year. According to CME FedWatch data as of March 27, 2026, the probability of a rate hike by year-end has crossed 30%. Traders have completely dropped all rate cut bets. From two cuts to a possible hike, in under 90 days.
US business activity fell to an 11-month low in March. The 2-year Treasury auction came in weak, pushing yields higher. Capital Economics Chief Economist Neil Shearing noted in his latest report that if the conflict extends for several months, eurozone GDP growth will slow to 0.5%, China's growth could fall below 3%, and US inflation is projected to peak at 3%.
BMO Chief Economist Douglas Porter stated clearly that if the shock lasts beyond 2 to 6 weeks, the impact on inflation and economic activity will no longer be temporary.
The shock has already lasted 30 days.
Any investment strategy that was built on the assumption that low rates would continue needs to be reassessed right now.
Two Blind Spots the Financial Media Isn't Covering
Short Term (Next 2 to 4 Weeks): April 6 and the Transit Fee Model
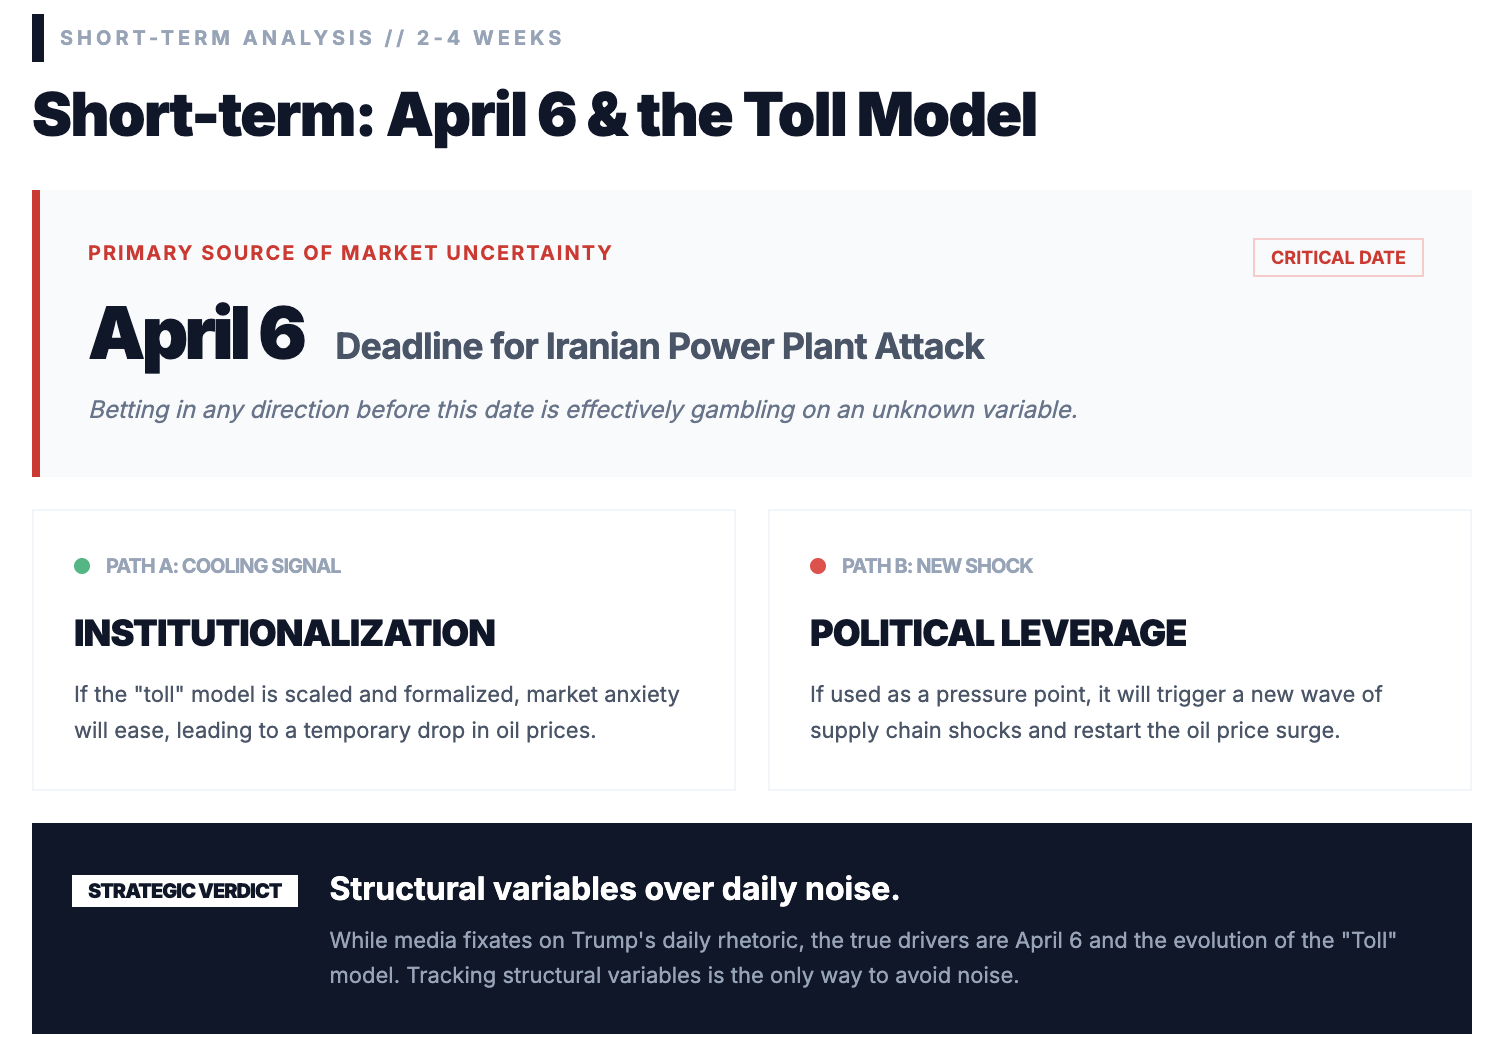
Trump has already delayed the strike deadline on Iranian power plants twice. The latest puts it at April 6. This is the biggest single source of market uncertainty right now. Any directional bet made before that date is a bet on an unknown outcome.
The Strait of Hormuz transit fee model deserves even closer attention. If it expands and becomes the new normal, it is a signal of de-escalation and oil could pull back. If it becomes a political tool that Iran can tighten at any moment, it is the trigger for the next wave of disruption.
These two variables are what actually drive oil prices. Far fewer people are tracking them than are tracking Trump's daily posts.
Medium to Long Term (Next 18 to 24 Months): Capital Is Already Voting With Its Feet
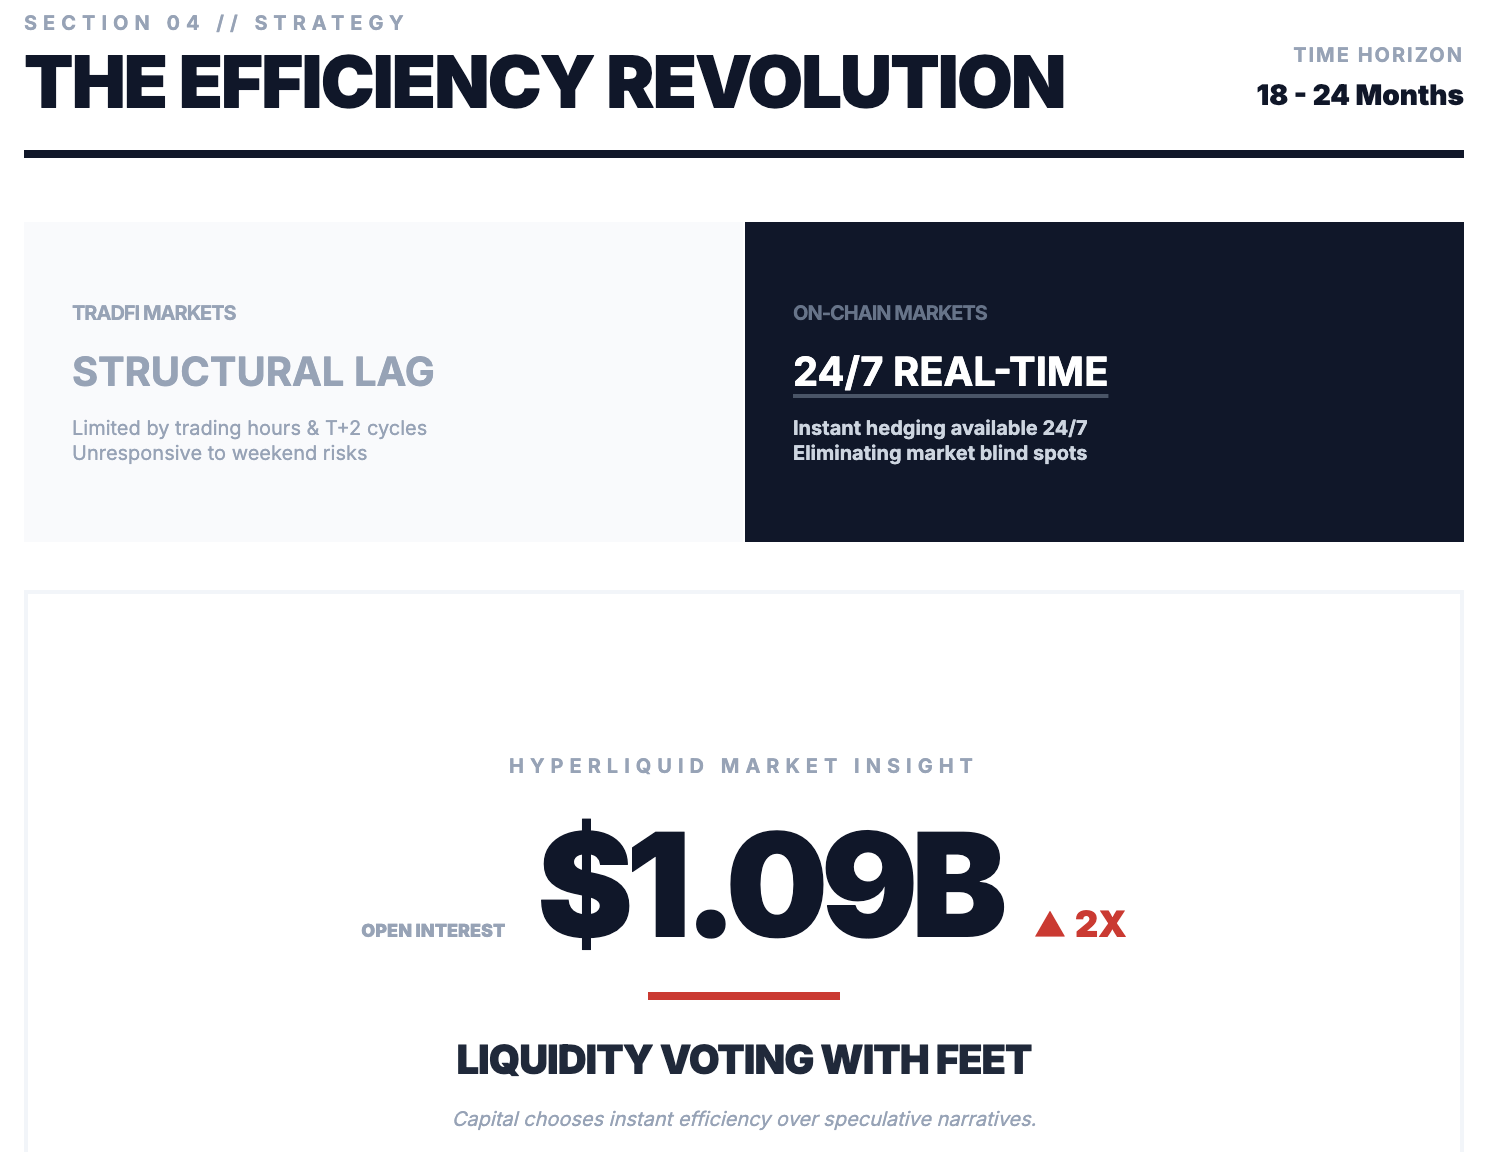
Once stagflation sets in, historical data shows it takes an average of 18 to 24 months to exit. During that window, traditional markets have one structural weakness that gets worse over time: they are too slow.
Exchanges have opening and closing hours. Central bank policy changes require scheduled meetings. Settlement takes T+2. When a risk event happens at 2am on a Saturday, traditional market participants can only watch until Monday open.
Capital is already responding. Over the past month, open interest on Hyperliquid's onchain HIP-3 markets went from $620 million to $1.09 billion, nearly doubling. Gold, crude oil, and equity index perpetual contracts onchain hit new volume records on the weekends when geopolitical events escalated.
Capital didn't flow there because of belief in a crypto story.
It flowed there because it needed a tool that could react at any hour, under any conditions.This is not a crypto market promoting itself. This is global capital, under pressure, choosing its own direction.
One question worth sitting with:
With energy supply chains, global economic momentum, and Fed policy all breaking down at the same time, which variable do you think is most severely underpriced in today's markets, and why?