Understanding Trends - Crypto Academy / S5W1 - Homework Post for @reminiscence01

Hello guys!
I welcome everyone to a brand new season at the cryptoacademy. Season five promises to be even bigger and better than the previous season which ended on a high note.
This week we explored a lecture topic titled "understanding trends". Led by professor reminiscence01 we learnt how to apply the characteristics of trends as an effective technical analysis tool for making better trade decisions in our trading adventures.
This homework post was therefore, created in fulfillment of the tasks outlined in professor reminiscence01 lecture post.
Here we go!

Task 1a: What do you understand by a Trending market?
A Trending market is one which the price of a commodity on a chart moves in one direction, either up or down, rather than hovering around a specific region by bouncing off support and resistance levels as seen in a ranging market.
Note: The phenomenon of trends in a market is as a result of the effect of the forces of demand and supply on the price of the commodity being traded.
There are basically two types of trends experienced in every market, and they include;
- Uptrend
- Downtrend
Uptrend: This is signified on the market chart by the price of a commodity closing at higher-highs and higher-lows.
Downtrend: This is signified on the market chart by the price of a commodity closing at lower- highs and lower-lows.
Task 1b: What is a bullish and a bearish trend? (Screenshot required)
Bullish trend
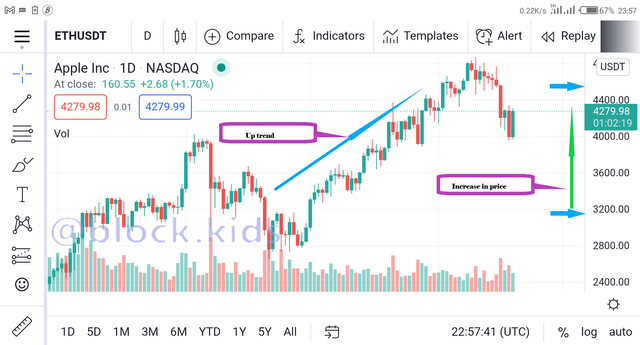
A Bullish trend is a form of market structure which is signified by the observation of an Uptrend on the market chart.
This is to say that on the chart you will see the price of a commodity closing at higher-highs and higher-lows.
The market at this period is fueled by the psychology of "greed" which drives the forces of demand and supply.
In essence, there will be a surplus in demand for the commodity and an insufficient supply of that same commodity which will be characterized by a greater number of buyers and a far lesser number of sellers.
Hence, a bullish trend scenario will cause the price of the commodity /asset to rise. At this period, holders of this commodity/asset who wish to make a bit of profit immediately might decide to sell off some of their stakes in the market.
An example of the bullish trend is shown in the screenshot below.
 Source :screenshot
Bearish trend
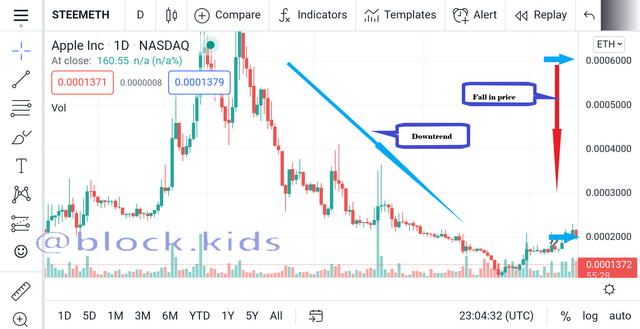
A Bearish trend is a form of market structure which is signified by the observation of a downtrend on the market chart.
This is to say that on the chart you will see the price of a commodity closing at lower-highs and lower-lows.
The market at this period is fueled by the psychology of "fear" which drives the forces of demand and supply.
In essence, there will be a surplus in supply of the commodity and a scarce demand of that same commodity and this will be characterized by a greater number of sellers and a far lesser number of buyers.
Hence, a Bearish trend scenario will cause the price of the commodity /asset to fall. At this period, investors can decide to buy some quantity of this commodity/asset in order to have some stake in the market with the hope of yielding some profit in the future
An example of the Bearish trend is shown in the screenshot below.
 Source :screenshot
Task 2: Explain the following trend identification and give an example of each of them. (Original screenshot needed from your chart). Do this for a bullish and a bearish trend.
- Market Structure
- Trendlines
Being able to identify trend in a market is vital for making accurate and wise trading decisions which will in turn probably lead to a profitable trade. In this section two major methods of identifying trends will be discussed. These two methods include;
- Market structure
- Trendlines
Market Structure
Studying the Market structure (price action) is a method or tool used by traders to identify what direction or the asset's price is moving towards.
In a Trending market the market structure can be further used to identify if the trend is bullish or bearish in nature
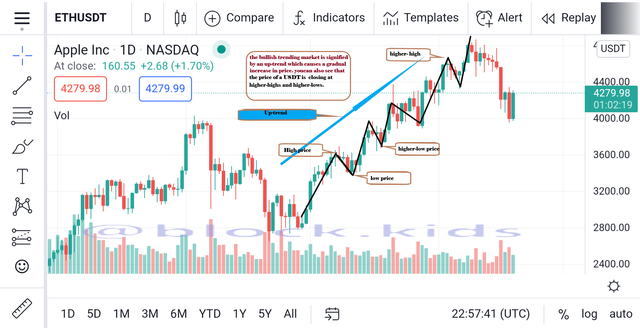
For a bullish trend we will tend to see an Uptrend on the market chart which is characterized by price closing at higher-highs and higher-lows despite minor retracement in price movements.
The bullish market structure also leads to a gradual and persistent rise in the price of the asset.
The bullish market sees an overall increase in price, however, from time to time the market experiences an occasional drop in price in the form of retracements. This allows traders take profits while opening up an avenue for buyer to acquire assets at a relatively cheaper price, thus, creating an opportunity to push the price of the commodity even higher.
The screenshot below shows an example of a bullish market structure
 Source :screenshot
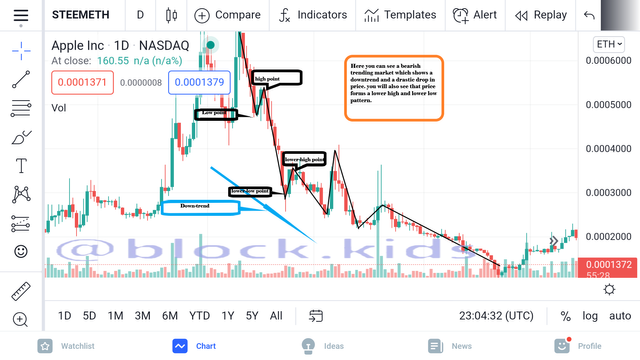
However, for a Bearish trend we will tend to see a downtrend on the market chart which is characterized by price closing at lower- highs and lower-lows despite minor retracement in price movements.
The bearish market structure also leads to a gradual and persistent fall in the price of the asset.
The bearish market sees an overall decrease in price, however, from time to time the market experiences an occasional rise in price in the form of retracements. This allows traders prevent excessive loss while opening up an avenue for sellers to take profits from sales by selling at relatively higher prices , thus, creating an opportunity to drive the price even lower.
The screenshot below shows an example of a bearish market structure.
 Source :screenshot
Trend lines
Trendlines simply refers to a diagonal line which is drawn between a minimum of three or more price pivot points on the market chart.
The Trendline is one of the major tool used by traders to identify the trend pattern governing the market at any given moment. In addition, trendlines can also be described as a dynamic support or resistance level.
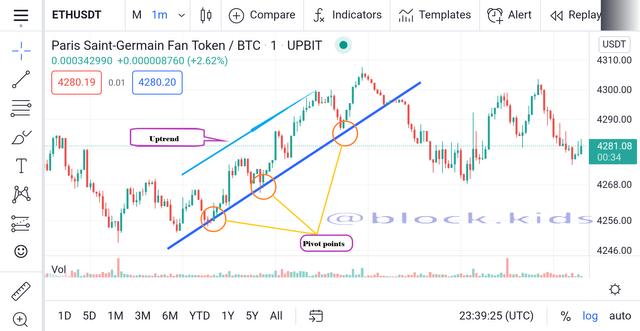
For a bullish market, the trend line is drawn below the price action, through a minimum of three pivot point where price reacts and rises. Points along the bullish trend line can serve as an entry position for traders to keep maximizing profits from the trend until price breaks the trendline.
Below is a screenshot example of a bullish trend line in use.
 Source :screenshot
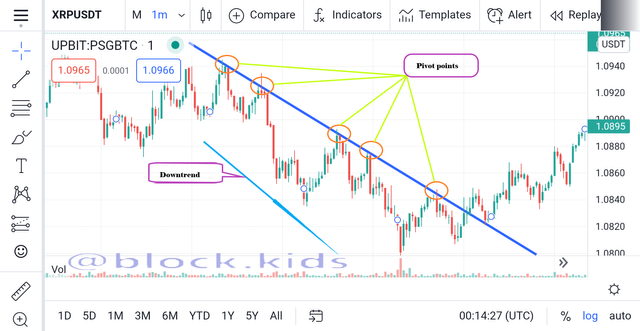
Contrastingly, for a bearish market, the trend line is drawn above the price action, through a minimum of three pivot point where price reacts and falls. Points along the bearish trend line can serve as an entry position for traders to minimize losses from the bearish trend until price breaks the trendline.
Below is a screenshot example of a bearish trend line in use.
 Source :screenshot
Task 3: Explain trend continuation and how to spot them using market structure and trendlines. (Screenshot needed). Do this for both bullish and bearish trends.
In order to maximize profits from trading using trends, traders should be able to tell if a trend will continue or reverse.
Trend continuation simply refers to signals which support that the trend governing price action is more likely to continue without reversing.
Keeping in mind that price does not rise or fall on a straight line, rather, it does so in a zig-zag pattern and the trend continuation signals occur within the waves of these zig-zag patterns
However, traders apply various indicators to locate these trend continuation signals. Some of these trend continuation signals could be located through studying indicators like;
- Market structure
- Trendlines
Using Market structure to locate trend continuation signals
When studying market structure to locate trend continuation signals, we have to take note of the retracements of price on the chart.
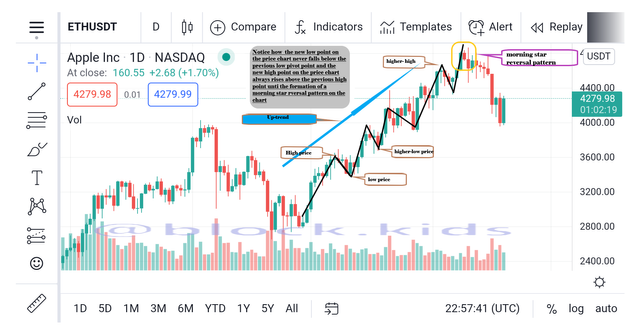
For bullish trend continuation signals to be confirmed there are series of conditions that have to be satisfied and these conditions include;
The new low point on the price chart must not fall below the previous low pivot point.
The new high point on the price chart must rise above the previous high point.
However, a strong bullish trend continuation signal can be noted when the new low pivot point is higher than the previous price peak.
Examples of these conditions are illustrated in the screenshot of the trading chart below
 Source :screenshot
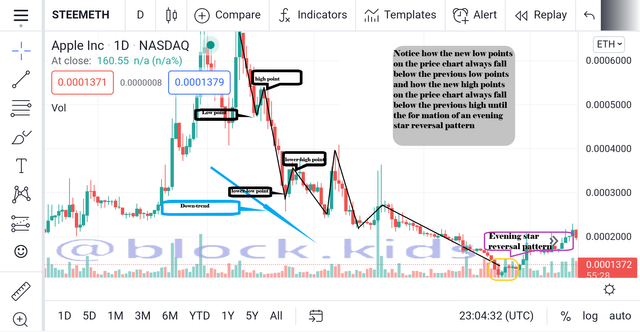
Similarly, for bearish trend continuation signals to be confirmed there are series of conditions which also need to be satisfied and these conditions include;
The new low point on the price chart must fall below the previous low point.
The new high point on the price chart must not rise above the previous high.
However, a strong bearish trend continuation signal can be noted when the new high pivot point is lower than the previous low point.
Examples of these conditions are illustrated in the screenshot of the trading chart below
 Source :screenshot
Using Trendlines to indicate trend continuation signals
Using Trendlines to locate trend continuation signals is less complex than studying the market structure. This is because one a trend line is drawn on a trending market (either bullish or bearish), price retraces back to the trendline and then bounces off before continuing the original trend. Whenever price breaks the trendline at any point is a violation of the already on-going trend and can also indicate a trend reversal signal
An illustration of using trendlines to indicate bullish trend continuation signals is shown in the screenshot below
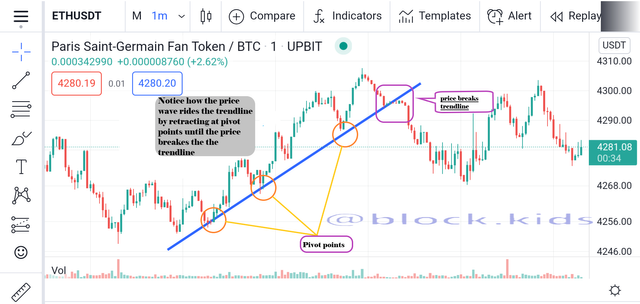 Source :screenshot
An illustration of using trendlines to indicate bearish trend continuation signals is shown in the screenshot below
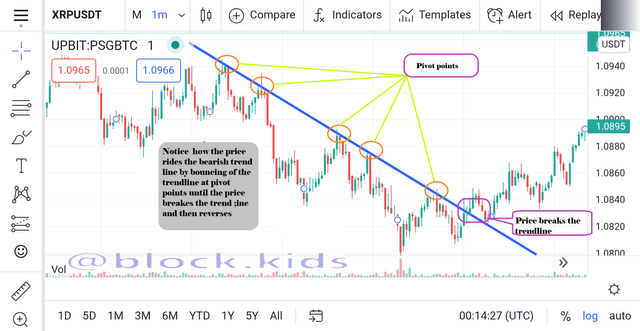 Source :screenshot
Task 4: Pick up any crypto-asset chart and answer the following questions -
i) Is the market trending?
ii) What is the current market trend? (Use the chart to back up your answers).
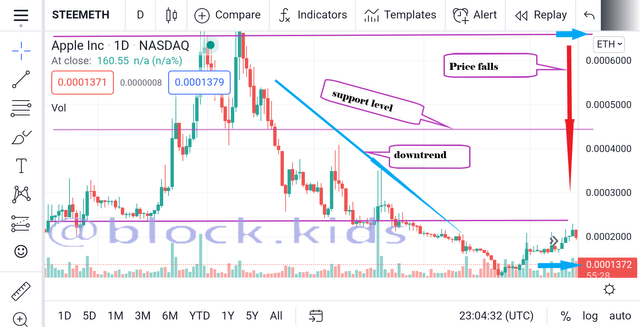
In this section I will be analyzing the STEEM/ETH crypto pair. A screenshot of the crypto pair as at the time of preparing this post is shown below.
 Source :screenshot
From the screenshot of the trading view crypto chart above, we can see that price has just broken a recently formed support level and is moving in a downward direction rapidly. Therefore, it is safe to say that the market is trending as it is not bouncing of both support and resistance levels (ranging).
Furthermore, because of the predominant downtrend (price of ETH is closing at consecutive lower- highs and lower-lows) and red candlesticks the crypto pair can be said to be undergoing a bearish trend/market. This conclusion can even be further confirmed by the reduction in price from 0.0007ETH to 0.00013ETH.
Conclusion
Trading can be fun and profitable if a trader understands how trends affect the price action in a market.
Understanding trends is so much more than knowing if the price of a commodity is increasing or decreasing, rather it goes deeper to help traders understand the psychology behind the bullish and bearish market structure.
With a perfect understanding of trends, traders can better indicate if a trend will continue or reverse and this will go a long way to help traders make more profit and cut losses during trades.
Being part of this week's lecture has been really exciting and educative and I hope subsequent weeks will be even more exciting.
Hello @block.kids , I’m glad you participated in the 1st week Season 5 of the Beginner’s class at the Steemit Crypto Academy. Your grades in this task are as follows:
Observations:
That's correct. But a trader needs to be careful before making any trading decision using the trendline.
Recommendation / Feedback:
Thank you for participating in this homework task.