SteemCryptoAcademy Season 4 Week 4 - Homework Post for Professor @Kouba | Trading with Williams % R Indicator
Hello, steemians welcome to my blog once again. In regards to the lecture of prof @kouba, where we studied one of the indicators named William % R. I would be attending the following question to preview my knowledge of the lecture. Before I begin, I want to say a big thank you to the prof for taking us on a div into the course. Let's begin below.
Introduction To William % R - The Calculation, Settings & How It Works

As the name implies, it is an indicator that was developed by Larry Williams with the intention of comparing the closing price of markets to the high-low range over a given time frame. Williams % R also known as Williams Percent Range (WPR) is a moving indicator that can be used to calculate an entry point in the market, it moves from 0 - 100 in the measurement of overbought and oversold section. Let's have a look at how WPR looks like a BTC/USDT market chart.
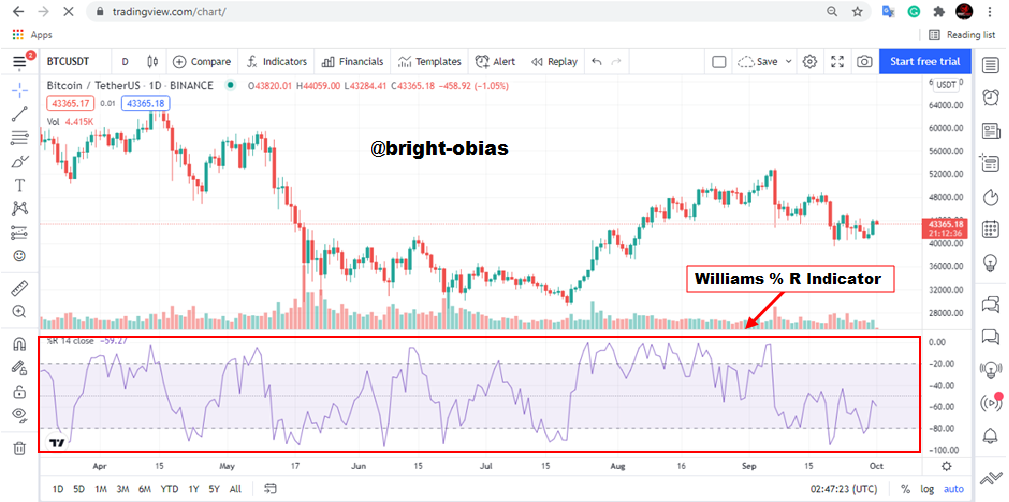
How does WPR indicate the price of a crypto asset? The indicator tells a trader the exact section at which the price of an asset is being traded by making use of the highest high of the last 14 periods of the market, that is if a price of an asset is in between the section of -20 and 0, it will indicate an overbought section, on the other hand, if it is -80 and -100 it tells the trader that the market is now in oversold range.
As explained earlier, you can see from the above chart the indication of the overbought & oversold section. The indicator calculates the overbought by taking the value of -20 above and takes the value of -80 below as the oversold section. Let's see how it is been calculated below.
Calculations In Williams % R Indicator
WPR indicator is very similar to Stochastic oscillator and they are mostly used in the same way but with a different calculation. Let's see the formula used in calculating the Williams % R indicator in the screenshot below.
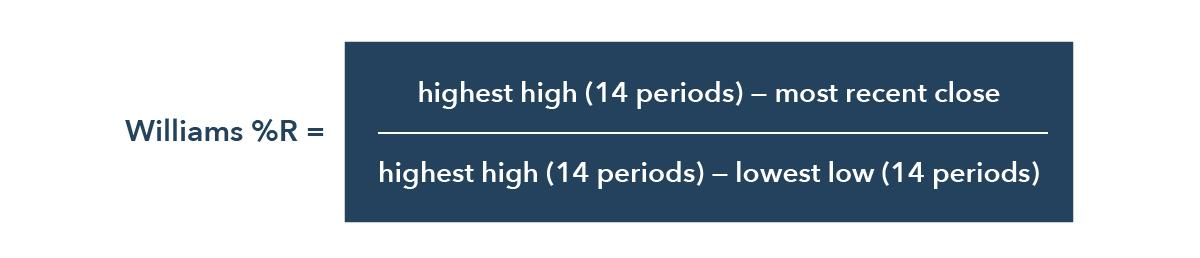
From the above formula, the highest high represents the highest price in the lookback periods which is mostly seen as 14 periods(days), the close represents the most recent closing price, and the lowest low stands for the lowest price in the lookback periods which is also at the 14 periods(days)
Now, let's take an observation of a maximum price of $8 where the closing price is at $10 and the minimum price is taken at $2 in the last 14 periods(days). The following calculation would be made.
Williams %R = ( 8 - 2 ) / ( 10 - 2 ) × -100
Williams %R = ( 6 / 8 ) × -100
Williams %R = 0.75 × -100
Williams %R = -75%
From the above calculations, an investor/trader can easily understand the price movement of the asset because the indicator moves from 0 to -100 where -20 and above is seen as an overbought section and -80 below is seen as an oversold section, thus giving the trader/investor signal on when to place a trade.
Williams %R Indicator Best Settings
Setting the WPR indicator depends on the type of trade as required by the trader whether long-term or short-term. However, by default, it is highly recommended you make used of the default setting as seen below.
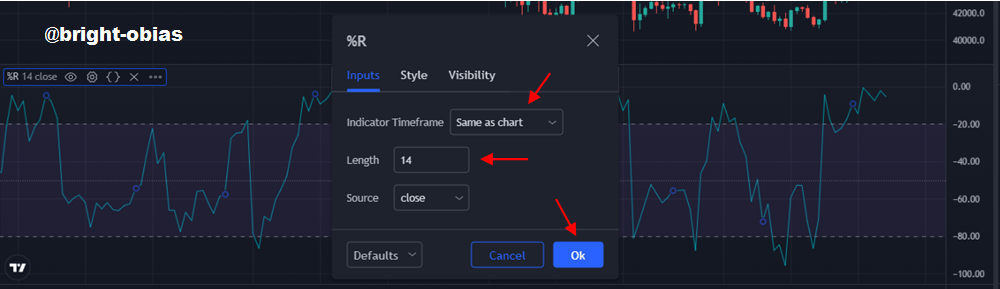
The above image depicts the default setting for the WPR indicator, it is the best setting because it helps traders to track the movement of price in the market. The settings are thus:
- Length = 14
- Upper Level = -20
- Middle Level = -50
- Lower Level = -80
Interpretation To Overbought & Oversold Section With Williams %R Indicator
Interpretation of the overbought and oversold section of Williams %R indicator depends on your understanding of how it works. Knowing full well that the indicator moves in the oscillation of 0 to -100 with -20 to -80 as the important zone.
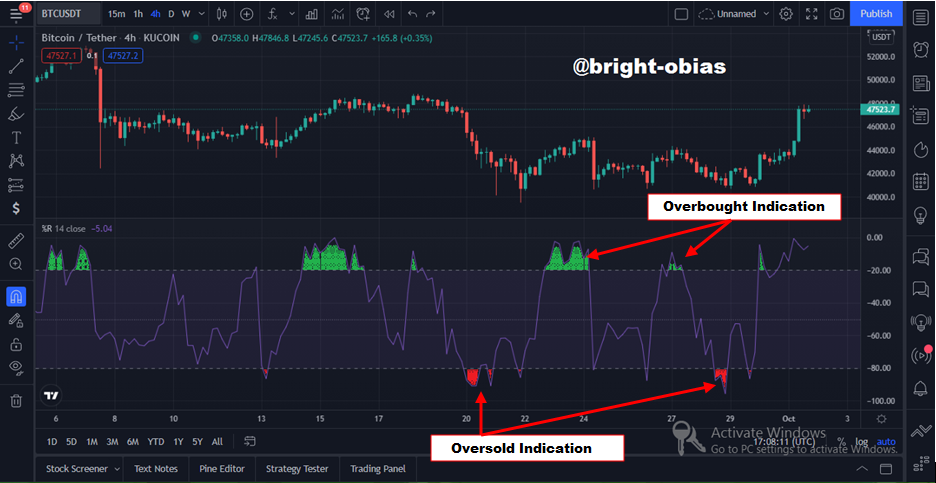
Now based on the default setting, it moves in accordance with the length (14 lengths by default ), and -20 above tells the trader that the market is now in the overbought section, while the -80 below alerts the trader of an oversold section. Let see the below BTC/USDT chart.
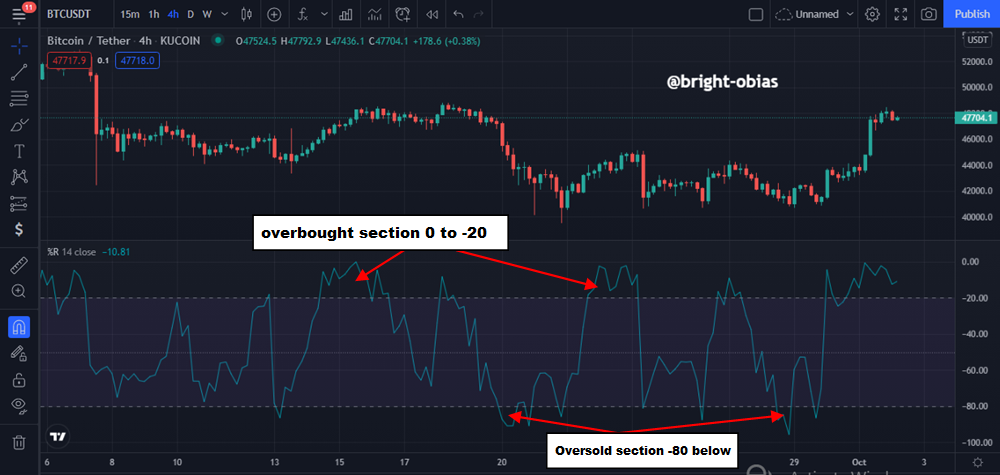
From the above screenshot, you can see the Williams %R indicator is installed on the BTC/USDT 4hrs Market Chart signaling the overbought & and oversold zone. Taking a close look at the image, you will detect the % of 0 to -20 as the overbought section and -80 to -100 as the oversold zone.
Note, the above chart is on the default setting of the WPR, it can be changed depending on the type of trader ( long-term, short-term, and Interday Trading ). Looking at the chart, you will also observe that as the Williams %R indicated an overbought section there was a drop in price and an increase in price when it touched the oversold section.
What are "failure swings" and how do you define it using The Williams %R?
Failure swings as the name implies are the movement of WPR indicator that could not swing in the direction in which it is meant to swing. It normally happens in two-phase of the Williams % R indicator. Sometimes, it happens as a result of a low trend of a particular market direction. Below are two aspects that failure swing normally occurs in the WPR indicator.
- In a Bullish Trend
Bullish Trend is when the market seems to be increasing in price. As I have elaborated earlier, the WPR indicator can be used to detect a bullish trend by indicating an oversold section telling a trader/investor that a bullish reversal is likely to occur. Let's take a look at the screenshot below where the failure swing occurred.
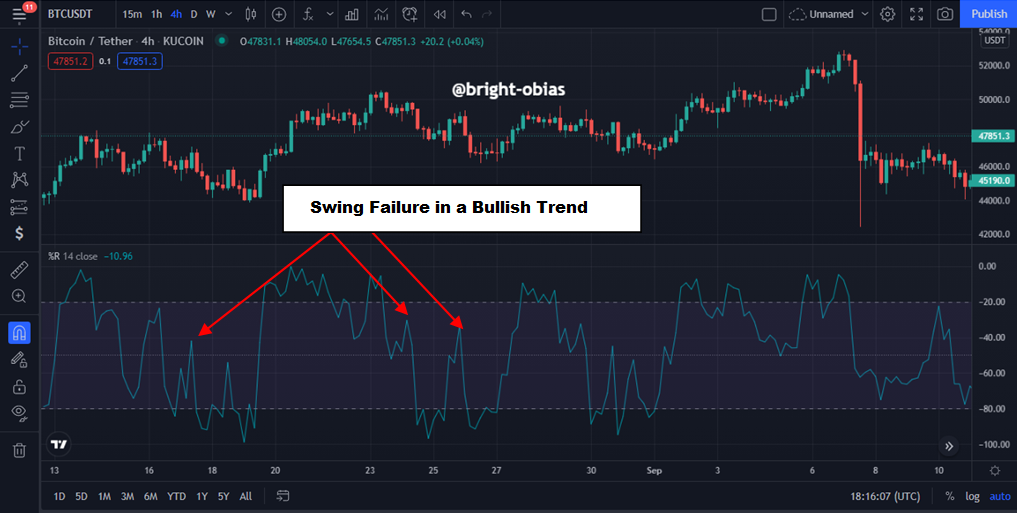
The above image depicts a swing in the WPR that could not cross the -20 section, because it could not swing over that section, it then became a failure swing in the bullish market.
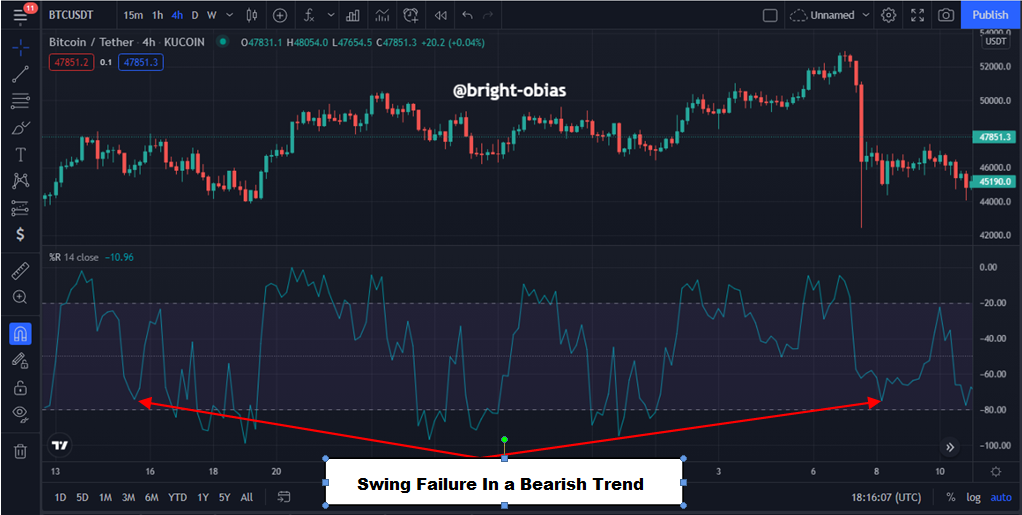
- In Bearish Trend
It also occurs in a Bearish Trend where the swing fails to go below the -80 section in the WPR and as a result, swing back to its level without going below the -80 section will be seen as a failure swing. You can refer to the screenshot below for a better understanding.
How to use bearish and bullish divergence with the Williams %R indicator?
When talking about Bullish and bearish divergence, it actually means the nearest price movement which does not usually occur. But if in a trading chart the WPR indicates a divergence, it gives the trader an opportunity of profiting from the market. Let's take a look at the two-phase of Divergence ( Bullish and Bearish Divergence )
- The Bearish Divergence
The Bearish Diversion is when a market is moving in a downtrend direction while the Williams % R indicates an opposite direction. In this kind of action, It is when traders will take the opportunity of selling their assets because the divergence depicts a clear view of weak buyers in the market.
Hello @bright-obias,
Thank you for participating in the 4th Week Crypto Course in its 4th season and for your efforts to complete the suggested tasks, you deserve a Total|5/10 rating, according to the following scale:
My review :
Even though you did not complete the assignment, the answers you provided enable you to get an average rating.
Thanks again for your effort, and we look forward to reading your next work.
Sincerely,@kouba01
Hello bright, I've been good through the crypto academy and haven't found anybody's post as original and amazing like yours, you inspire me and looking forward to joining the academy someday.
Thank you so much for coming around, looking forward to your upcoming crypto academy task...