[Crypto Trading with Price Action] - Crypto Academy / S6W2- Homework Post for @reminiscence01
Hello fellow steemians, this is the second week of season 6 of the steemit crypto academy. This week's lecture was delivered by professor @reminiscene01. This week's lecture was on Crypto Trading with Price Action. And after understanding this lecture I decided to try my hands on the given task.
1. Explain your understanding of price action.
Before traders can open market positions, it is important that they apply both fundamental analysis and also technical analysis. Some traders only rely on the fundamental analysis to take market positions but this is not the best way to go about it.
Technical analysis is needed to determine the supply and demand in the market, as well as the support and resistance levels in the market. These factors help us to implement proper risk management and we can't do this with fundamental analysis unless we employ technical analysis.
The price action helps to determine the support and resistance levels, demand and supply in the market at a particular point in time like I indicated above already.
Good buy signals and sell signals can be identified by the use of the price action strategy. The price action can also help us to apply proper risk management during our analysis in the market.
By the use of the price action, we can also identify the quantity of volume entering the market at a particular point in time and also identify the point of stop loss and take profit as well. The price action also helps traders to know the actual structure of the market at a given time.
The chart below can be used to demonstrate it clearly.
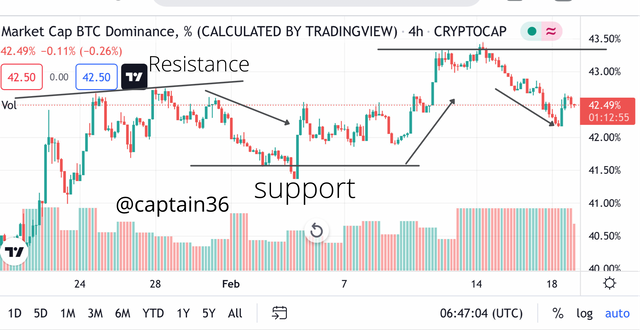
Looking at the chart above, we can see that the support and resistance levels of the price have been marked on the chart and we can see clearly that the price bounces off when it hits either the support or resistance levels.
When the price hits the support level, it makes an upward movement afterwards and similarly when the price hits a resistance level, it bounces and makes a downward movement afterwards and this proves the significance of the support and resistance levels in technical analysis.

2. What is the importance of price action? Will you choose any other form of technical analysis apart from price action? Give reasons for your answer.
Like we discussed already, price action is very relevant in crypto trading and has so many importance. In this section we will be discussing some of the importance of price action.
The price action helps traders to know the general structure of the market as well as other vital price data in the market. Like we discussed earlier, the price action can help us identify support and resistance levels as well. It helps us identify some trends that are formed in the market and so likely price reversals that might take place in the market.
With aid of price action, the buy signals and sell signals can be seen clearly by traders and this will aid them to take the right entry and exit positions in the market. With these points identified successfully, traders can therefore go ahead to place their orders with the correct stop loss and take profit points and this will assist them to practice proper risk management.
The price action is also very relevant because traders can rely on it to filter out false signals in the market when there is some kind of fluctuation in the market. It ensures that traders can read the chart without any form of difficulties because the noise in the market is reduced and this makes reading of prices very smooth.
Personally, I think I will choose price action over any type of technical analysis because of the overwhelming importance of price action in predicting the prices of assets. I prefer the use of price action because it makes it much easier to identify the entry and exit points in the market.
As we discussed above already, the price action helps us to also identify support and resistance levels and also the various trends in the market as well as the price reversals in the market. These are some of the reasons I prefer the use of price action to anything else.

3. Explain the Japanese candlestick chart and its importance in technical analysis. Would you prefer any other technical chart apart from the candlestick chart?
Crypto charts are very important in technical analysis. They help traders to be able to follow the trend of assets in order to make reasonable predictions. There are different types of charts but in this section our attention will be on the Japanese Candlestick Chart.
The respect movement of the sellers and buyers in the market can be noticed by the use of these price charts. By observing these charts, traders can also be able to know the recent supply and demand in the market as well as being able to also determine certain levels such as the support and resistance levels.
Like I said, our interest in this section is to discuss the Japanese candlestick. However we must note that there are other charts such as the line chart, Bar chart, Hollow chart etc which we will not be discussing today.
The Japanese Candlestick is the most popularly used chart by most traders. Most traders prefer this chart because it is very simple to use. It also helps in identifying the demand and supply in the market at a particular point in time.
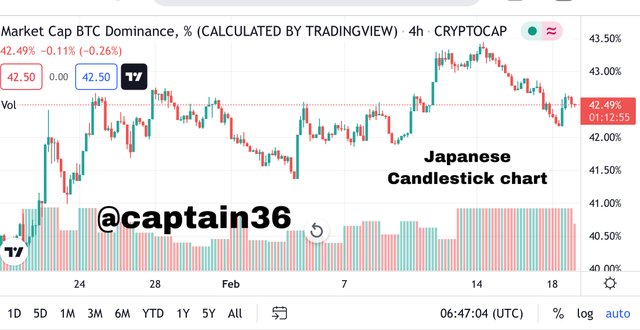
Looking at the chart above, we can see that the chart is made up of red and green candles. The red candles represent a bearish area which indicates a sell signal whilst the green candles on the other hand represent a bullish area which depicts a buy signal.
The green candles occur when there is higher demand in the market than supply. When these green candles are seen, this area is referred to as the bullish area or buy area. On the other hand, red candles occur when there is high supply in the market than demand. When these red candles are seen, this area is referred to as the bearish area or sell area.
Source
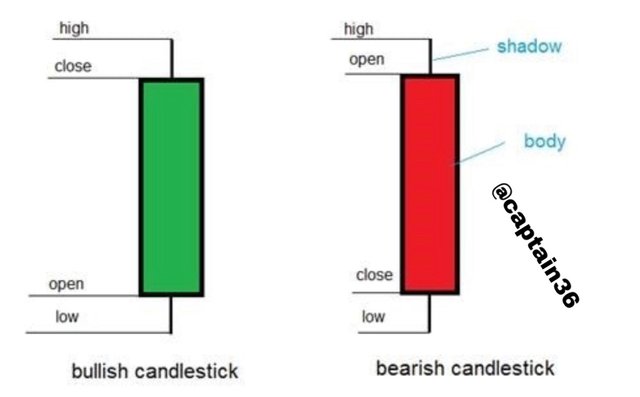
The Japanese candlestick appears in red and green as I said already. As shown in the image below, the bullish candle is represented with green color whilst the bearish candle is represented with red color. Each candle consists of the lower part, higher part and the body as well. The candles have parts which are the High, Open, Close, and Low.
Importance of Japanese Candlesticks
The Japanese candlestick is important to traders because it is very easy to use. Traders can simply look at the color of the chart and then know the direction in which the price is moving. When a trader sees a lot of green candles at a particular area, it is an indication that there is a bullish trend and likewise when a trader sees a lot of red candles within a certain area, it shows that there is a bearish trend.
The structure of the market can be easily comprehended by traders when they use the Japanese candlestick. The supply and demand portions are easily identified by traders when using the Japanese candlestick.
The Japanese candlestick remains very easy to use when combined with other technical indicators. This is not the case in other charts which are complicated to use when combined with other technical indicators.
When there is a trend reversal in the candlestick, it is easier to notice as compared to other charts.
The Japanese candlestick is able to identify the dominant force in the market as to whether it is sellers or buyers that are dominating the market at a particular point in time.
Would you prefer other chart pattern?
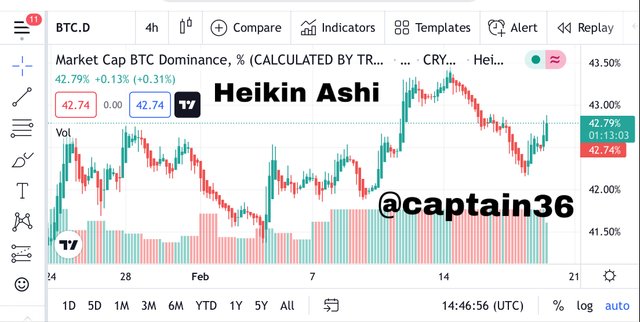
The Japanese candlestick is very convenient to use but I also prefer to use the Heikin Ashi Candles as well. Similarly, this candle can also help in identifying market trends very easily.
This chart also helps to reduce noise in the market which will help traders to be able to identify signals correctly. An example of the Heikin Ashi candle is shown in the chart below.

4. What do you understand by multi-timeframe analysis? State the importance of multi-timeframe analysis.
Multi-timeframe analysis means predicting the market movement as well as the correct entry point of a market by applying different timeframes within the chart.
For traders to determine their entry points and also the right trends in the market, the traders apply different timeframes.
For instance if traders want to determine the direction of a trend, they can use longer timeframes. And also when a trader wants to identify the specific entry point or a specific exit point, the trader can use a shorter timeframe.
Every trader has a way of applying the multi-timeframe analysis. For instance, long term traders can use a monthly timeframe to identify the direction of the trend of the price and the same trader when he wants to identify the specific entry point can use a shorter timeframe.
In the case of scalp traders, when they want to determine the trend of the price they can use a one day timeframe but when it is time to identify the exact entry point, they can use a 10 mins or 15 mins timeframe to make an entry.
Importance of Multi-timeframe Analysis
Multi-timeframe analysis is very relevant in trading. In this section we are going to look at some of the importance of this multi-timeframe analysis.
The multi-timeframe analysis can be used to enter in to a market to make some profit in the market. This is because traders can use a longer timeframe to follow the direction of the trend and then also use a short timeframe to identify the correct entry point and also identify the stop loss. This will help the trader to minimize some losses and then make profit.
In times of fluctuation in the market, the multi-timeframe analysis can be used as a way of reducing noise in the market and this will allow traders to be able to make good analyses in the market. For instance a trader can use a longer timeframe to know the direction of a trend when the price is in the state of accumulation.
When using the multi-timeframe analysis, a trader can switch from one timeframe to another in order to confirm a signal that has been predicted by the trader earlier.
Like we discussed earlier, the multi-timeframe analysis can be used to identify the stop loss after entering a market. This will help traders to make proper management of risk and it will help them reduce losses and hence make some profit.

5. With the aid of a crypto chart, explain how we can get a better entry position and tight stop loss using multi-timeframe analysis. You can use any timeframe of your choice.
In the previous section we discussed a lot about the multi-timeframe. In this section we are going to use the multi-timeframe to get a good entry position.
Looking at the chart below, I decided to use a longer timeframe at the start.
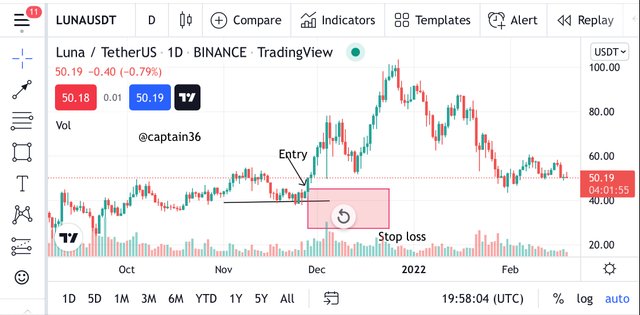
Looking at the chart above, I decided to use the daily timeframe. This timeframe is a longer timeframe. As we can see in the chart above, I have identified the support level and the price eventually made an uptrend after it hit this support level. After I identified the support level I also identified my entry point as well as the point of stop loss.
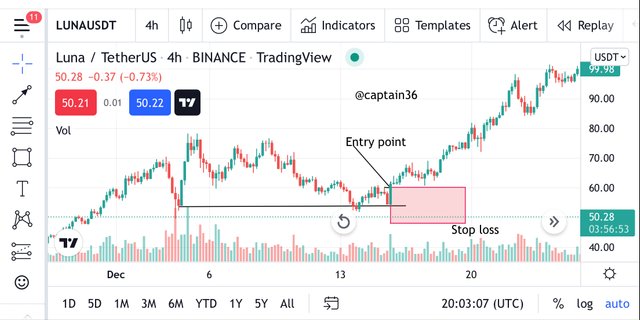
After I was done using the daily timeframe, it was time to use a shorter timeframe. This time I decided to use the 4 hour timeframe which is a short timeframe. The target is to use a shorter timeframe to confirm the signal of the daily timeframe we did earlier. Then I identified a very strong support level within the 4 hour timeframe which the price bounced off several times and made an uptrend. After this I identified the entry point and also was able to identify the stop loss. The entry point has gone ahead to confirm my initial point in the longer timeframe.
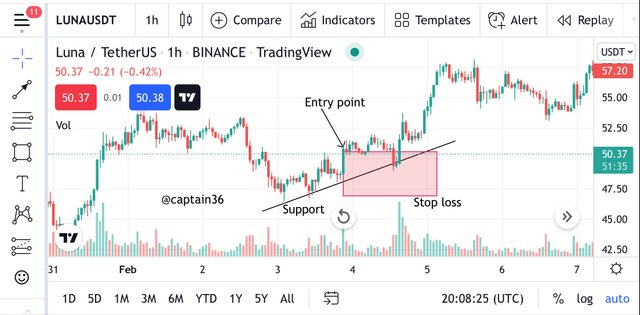
I then moved on to use a 1 hour timeframe for the same chart. This also went ahead to confirm my entry point after I marked the support level line at a point where the price bounced off several times and made an uptrend. The stop loss was also confirmed below the support level line in the 1 hour timeframe as well. I achieved accurate results here so I confirmed my entry point and there was no need to move to a shorter timeframe.

6. Carry out a multi-timeframe analysis on any crypto pair identifying support and resistance levels. Execute a buy or sell order using any demo account. (Explain your entry and exit strategies. Also, show proof of transaction).
LUNA/USDT Sell
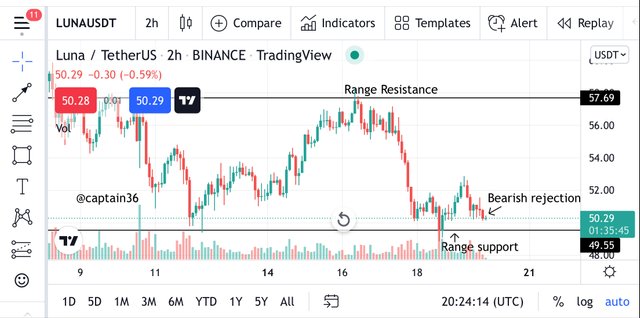
Looking at the chart above, the price in the region of $57.69 looks like the resistance level whilst the price in the region of $49 looks like the support level. Looking at the chart, the price was constantly approaching the resistance level and bounced off with a lot of bearish trends formed. It was a signal that sellers are about to dominate the market which will then lower the prices in the market. After these observations, I then decided to apply a lower timeframe to confirm the signal identified.
ETH/USDT 30 MINUTES
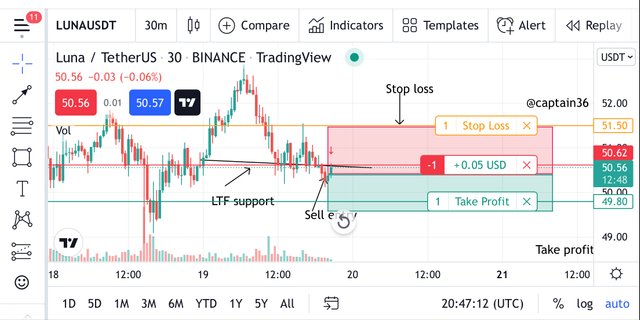
Looking at the 30 mins timeframe, we can observe that the support that was formed by the price was eventually broken and this was evident that the bearish trend was gaining momentum as we saw in the longer timeframe. The price can be seen breaking below the support level in the 30 mins timeframe.
After I confirmed the signal within the 30 mins timeframe, I implemented the breakout procedure and then placed a sell order at $50.55. I also placed my stop loss at $51.50 and also placed the take profit at $49.80. I used a risk-reward ratio of 1:1RR.
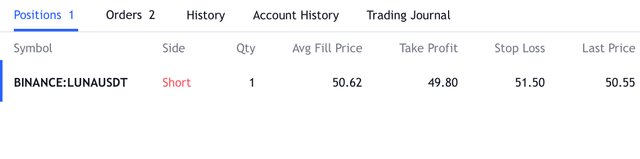
Trade order executed

Conclusion
All the possible strategies involved in price action has been discussed in the above article. The price action is very relevant in trading and it is very important for all traders to be able to master this strategy. The price action can be used in identifying useful components such as the support and resistance levels and can also be used to determine the amount of supply and demand in a market at a particular point in time.
Thank you once again @reminiscene01 for this detailed lecture.