Trading Strategy with Median Indicator - Steemit Crypto Academy |S6W4| - Homework Post for Professor @abdu.navi03 by @captain36
Hello everyone, this is week 4 of season 4 of the steemit crypto academy. This week’s lecture was on trading strategy with Median Indicator and the topic was delivered by professor @abdu.navi03. This lesson has made me understand how the median indicator works and can be used to generate signals in the crypto chart. After my comprehension I have decided to try my hands on the given task.


1-Explain your understanding with the median indicator.
When traders are engaged in technical analysis, they need technical indicators to be able to identify signals. The traders need these indicators in order to be able to identify trends in the market. One of the indicators that are used to identify the trends is the Median Indicator. The Median Indicator is a very unique type of trend-based indicator. This indicator measures the volatility of the market through the ATR and this helps to identify the trend in the market.
To help in determining the volatility of the price, the Median line is placed in between the ATR which is both above and below this median line. The EMA and the Median lines of the same length are compared to each other. After the comparison, the difference between the EMA and the Median line is used to know whether a market is on a downtrend or an uptrend when a cloud is formed on the indicator. Before we can see that the market is on an uptrend or downtrend, the clubs that are formed will change from purple to green and this is a good way to know the direction of the trend.
When there is a green cloud and the Median line moves above the EMA, we can conclude that the market is on an uptrend whilst on the other hand, when there is a purple cloud and the Median line moves below the EMA, we can conclude that the market is on a downtrend.

2-Parameters and Calculations of Median indicator. (Screenshot required)
To be able to generate indicators, we make mathematical combinations of the data points on the chart such as the highs and lows, the opening and closing price within a certain period of time. The median indicator uses a unique method as its mathematical expression. The Median Indicator applies the ATR alongside the Multiplier in order to position the upper band and the lower in their respective positions. The upper band is placed above the Median line whilst the lower band is placed below the Median line. The calculation involving the Median indicator is shown below.
Upper band = Median Length + (2 * ATR)
Lower band = Median Length - (2 * ATR)
The parameters are defined below;
- Median Length: The Median Length has a default value of 3. The Median length represents all the data points that are used in the calculation of the Median.
- ATR: The ATR has a default value of 14. The ATR represents the period uses when calculating the Median.
- ATR Multiplier: The ATR multiplier also has a default value of 2. When forming the upper band and the lower band, the ATR is usually multiplied by this multiplier.
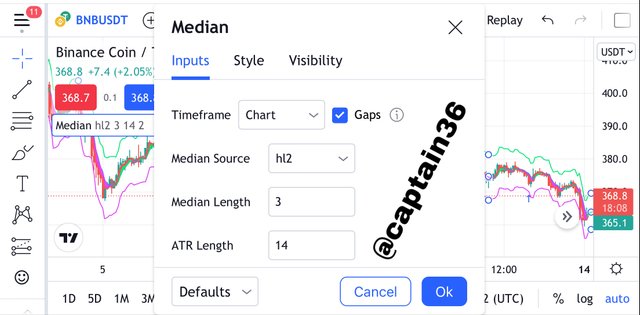
The default values can be modified when using the Median Indicator. But when the indicator is added initially these are the values that will first appear. Any trader using it can change these values depending on the trading style he prefers.
Screenshot from: Tradingview
The parameters of the median indicator can be see clearly in the chart above. The most delicate parts of the indicator are the ATR value and the Median length. These values play a significant role in the signals that will be generated by the Median Indicator. The indicator can give false signals if these values are inputted wrongly.
Screenshot from: Tradingview
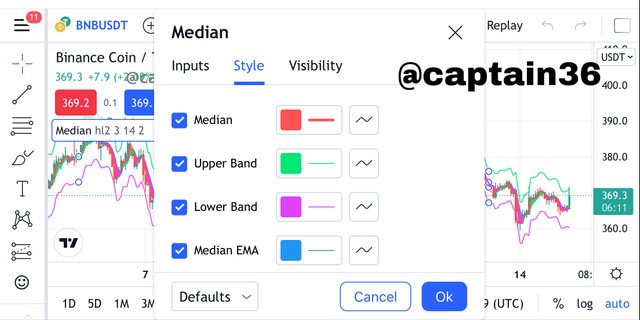
The above chart indicates the style aspect of the median indicator. The trader can use this section to change the look of the indicator. This style of the median indicator does not have any effect on the functioning of the indicator but the trader just set it to his preferred style.

3-Uptrend from Median indicator (screenshot required)
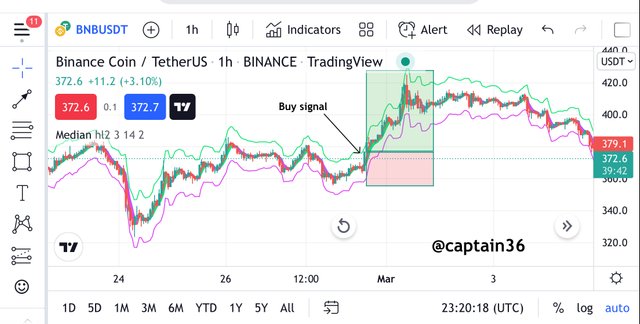
Like we discussed earlier, the Median Indicator is an indicator that is used to determine the trend of a price market. It performs a similar function as the moving average. A trend is seen as a bullish or bearish trend when the difference between the median line and the EMA of the same length forms a cloud. When the color of the cloud changes from purple to green and the Median line is above the EMA, it is an indication of an uptrend in the market. This behavior of the Median Indicator gives a signal of an uptrend in the market and for that reason traders can take a buy position in the market. The chart below demonstrates that;
Screenshot from: Tradingview
As we can see in the chart above, there was an indication of an uptrend. We can see that the cloud of the indicator changed from purple to green. This is a very good buy signal. So traders can take a buy position at this point.

4-Downtrend from Median Indicator (screenshot required)
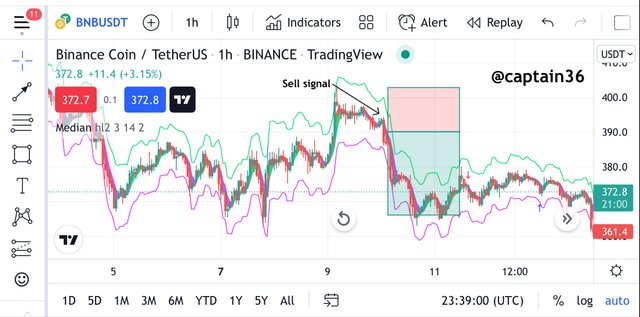
A trend is seen as a bullish or bearish trend when the difference between the median line and the EMA of the same length forms a cloud. When the color of the cloud is purple and the Median line is below the EMA, it is an indication of a downtrend in the market. This behavior of the Median Indicator gives a signal of a downtrend in the market and for that reason traders can take a sell position in the market. The chart below demonstrates that;
Screenshot from: Tradingview
The Median indicator changed from green to purple when the uptrend was over and a downtrend was about to start in the chart above. This change from green to purple signals a downward trend. Traders can therefore decide to place their sell orders in the market as the price is likely to fall at this point.

5-Identifying fake Signals with Median indicator(screenshot required)
The Median can be used to identify trends easily in the market when it is combined with other indicators. These indicators will confirm the trend that has been identified by the Median indicator. The Median indicator can be used alone to identify these trends but it is best used when it is combined with other indicators. So in this section I will combine the RSI indicator with the Median indicator.
The RSI indicator uses the overbought and oversold attributes to determine the state at which a market is at a particular point in time. Usually, when the price of an asset moves below the 30 RSI region it gives a signal of oversold and then a bullish trend is expected likewise when the price moves above the 70 RSI region, it is a signal of overbought and a bearish trend is expected to take place. The RSI indicator and the Median indicator must agree on the direction of the trend in order for the trader to be able to filter out false signals. When these two indicators give two contradictory signals, it's an indication that there is a false signal out there and traders must be careful. The chart below is used to demonstrate this;
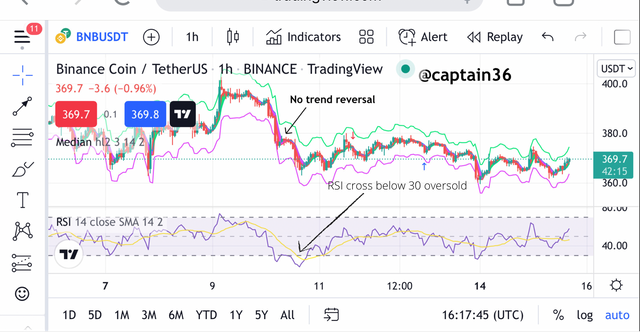
Screenshot from: Tradingview
Looking at the above chart, we can the RSI indicator showed an overbought signal when it moved below the 30 RSI level. This was suppose to be an indication of an uptrend in the market. But looking at the Median indicator, the cloud was still a purple color which is still indicating a downtrend in the market. The contradiction of these two signals generated shows that there is a false signal in the market and traders must try to avoid entering the market at this point to avoid being caught by these false signals.

6. Open two demo trades, long and short, with the help of a median indicator or combination that includes a median indicator (screenshot required)
Buy Trade BNBUSDT
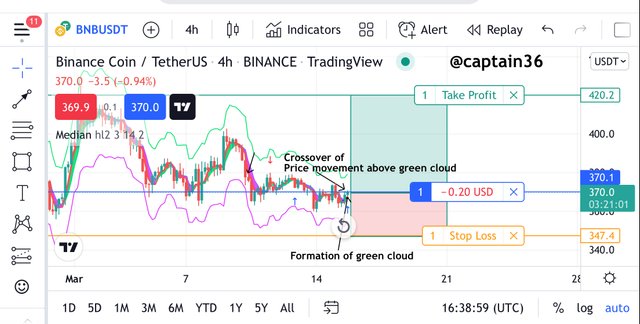
Screenshot from: Tradingview
Looking at the chart above, we could see the Median indicator was starting to form a green cloud at the lower point. This was an indication that buyers were about to take control of the market. So everything was pointing out that there is going to be a bullish reversal. So after a green candle was formed, I anticipated that there was going to be an uptrend that was going to continue from there.
So after this, I went on to execute my buy order at $370.0. Then I placed my stoploss at $347.4 and my take profit at $420.2. I then went on to execute my order at a Risk-Reward of 1:2 RR.
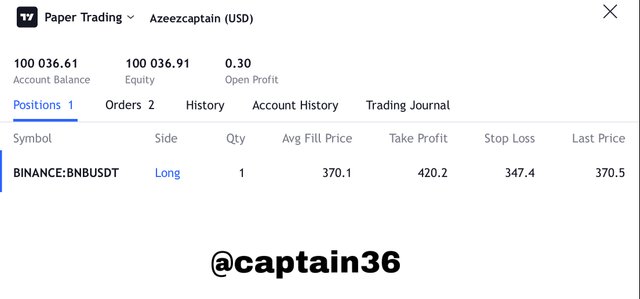
Screenshot from: Tradingview
Sell Trade HTUSDT
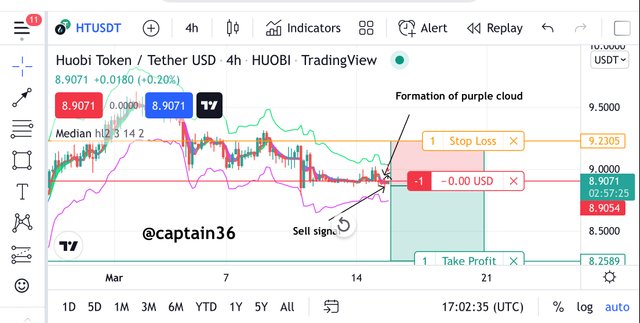
Screenshot from: Tradingview
Looking at the chart above, we could see the Median indicator was starting to form a purple cloud at the upper point of the chart. This was an indication that sellers were about to take control of the market. So everything was pointing out that there is going to be a bearish trend reversal. So after a red candle was formed, I anticipated that there was going to be a downtrend that was going to continue from there.
So after this, I went on to execute my sell order at $8.9071. Then I placed my stoploss at $9.2305 and my take profit at $8.2589. I then went on to execute my order at a Risk-Reward of 1:2 RR.

Screenshot from: Tradingview

Conclusion
In this lesson, we have learnt that the Median Indicator is a trend-based indicator that helps in determining the trend of a price of an asset at a particular point in time. The Median indicator helps to know whether a trend is bullish or bearish when the cloud changes from purple to green in the case of bullish or green to purple in the case of a bearish trend.
The Median Indicator, like any other indicator functions very well when it is combined with other indicators. Though it can operate alone but it is more appropriate to combine it with other indicators to obtain the optimum results.
Thank you once again professor @abdu.navi03 for this detailed lecture.