[Understanding Trends] - Crypto Academy / S5W1- Homework Post for @reminiscence01
Good day steemians, I would be answering the questions given by professor @reminiscence01 in his homework post titled Understanding Trends.

What do you understand by a Trending market? What is a bullish and a bearish trend? (screenshot required)
A market that has a series of irregular changes in the prices of assets is said to be Trending. The prices either go high, low or maintain a steady point for a given time and this happens continually on the chart which gives it a rather zigzag look.
Markets could trend upwards or downwards. An Upwards market trend indicates fluctuations of an asset with an average tendency of closing at a higher price while Downwards market trend indicates fluctuations of an asset with an average tendency of closing at lower a price despite its movements.
Trending markets are useful indicators for technical analysts, forex traders, and investors seeking to venture into the securities market. They study the price pattern and movement of these securities and use it to predict or ascertain when to invest and make profits.
Following the directions of a trending market line, it provides a benchmark for an asset price chart which assists in forming an indicator for future market trends of the asset, and the ability to understand these trends by the market participants can lead to profitable investment returns.
Identifying bullish and bearish trends
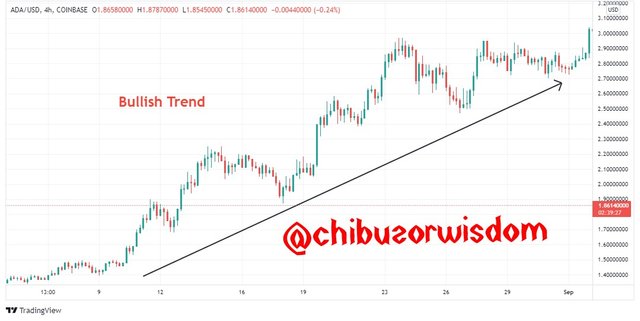
Bullish Trend
When the prices of stocks and securities in the forex trading market keep going in an upwards direction, indicating an economic boom, over a given time frame, it’s said to be a Bullish Trend.
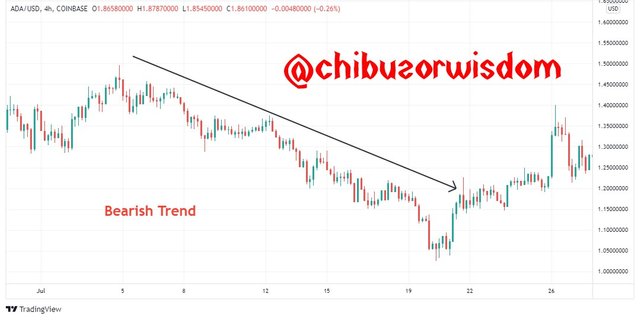
Bearish Trend
When the prices of stocks and securities in the forex trading market keep going in a downwards direction, indicating an economic recession, over a given time frame, it’s said to be a Bearish Trend.
.jpeg)
Explain the following trend identification and give an example of each of them. (Original screenshot needed from your chart). Do this for a bullish and a bearish trend. i) Market Structure. ii) Trendlines
Market structure
Market structure is used by crypto traders to identify or ascertain sit's present state that is whether the market trend is upwards, downwards, or on an average level. Of all the charts available, the candlestick chart presents the highest chance of understanding the market and how the price fluctuates. The whole crypto revolves around the upwards, downwards, or ranging movements of the prices of assets in the market.
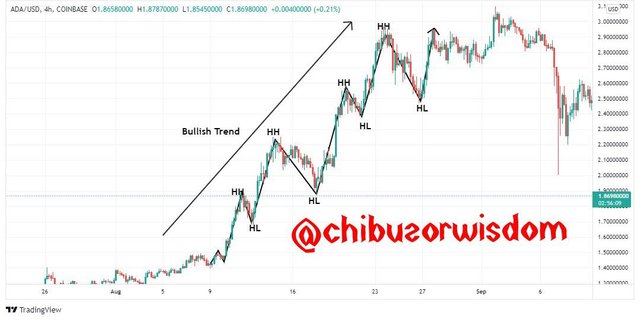
Bullish Market Structure
A bullish market structure is one in which we see the higher-ups and higher-downs. It indicates the failure of trading of assets below and above the previous low-point and high-point respectively. The prices of assets keep moving upwards due to the presence of numerous buyers which is an Uptrend or Bullish Trend.
When traders understand this market structure, it gives them an edge on deciding the best entry and exit points. The formation of the bullish trend is also based on the activities of traders who know when to stop trading in other for the price to keep going high until it reaches its highest-high than its previous highest point.
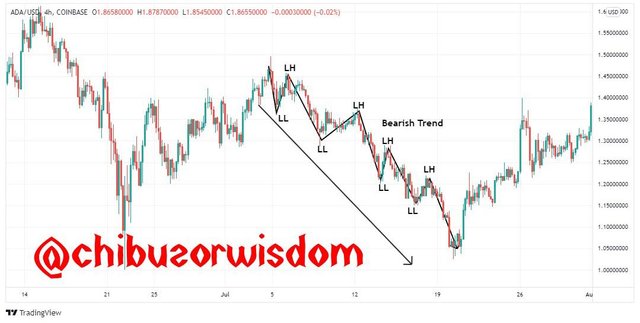
Bearish Market Structure
A bearish market structure is one in which we see the market form lower-ups and lower-downs. It indicates the failure of trading of assets above and below the previous low-point and high-point respectively. The prices of assets keep moving downwards due to the presence of numerous sellers which is a Downtrend or Bearish Trend.
When traders understand this market structure, it gives them an edge on deciding the best entry and exit points. The formation of the bearish trend is also based on the activities of traders who are known to stop trading in other for the price to keep going down until it reaches its highest low.
.jpeg)
Trendlines
A trendline is onis by traders to know the particular movement of the market. For an uptrend, it can be drawn using two low points while for the downtrend, it's drawn using two high points. A shift in the direction of particular trendlines indicates a break in the trendline.
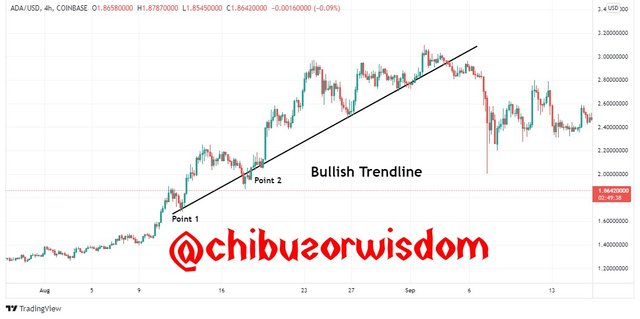
Bullish Trendlines
In a bullish trendline, assets are traded above their current trendline. Prices of assets come back to their current trend each time it reaches their trendline. This is a good spot for traders to enter and take advantage of the position till it breaks.
.jpeg)
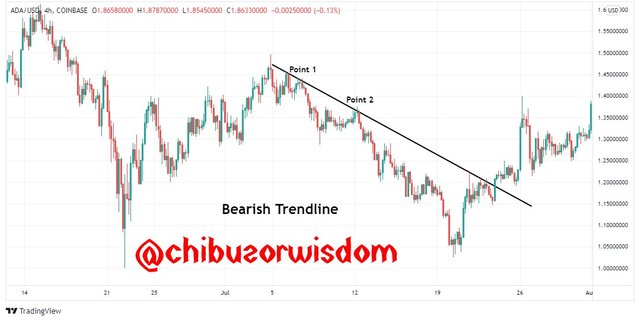
Bearish Trendlines
In a bearish trendline, assets are traded below their current trendline. Prices of assets come back to their current trend each time it reaches their trendline. This gives traders a suitable sense of direction and they're advised to take advantage of the position till it breaks as prices here are rejected.
Explain trend continuation and how to spot them using market structure and trendlines. (Screenshot needed). Do this for both bullish and bearish trends
Trend Continuation
The market chart shows a zigzag movement that results from traders taking their profits in other to allow the price of the asset continues moving in a forward direction. This is known as trend continuation and a good knowledge of this will help traders discover if a particular trend will continue or break.
Spotting Trend continuation pattern using market structure
For a bullish trend continuation pattern using market structure, the following notable points should be considered:
The current low point should not be lower than its previous low.
The current high point should be higher than its previous high.
For a bearish trend continuation pattern using market structure, the following notable points should be considered:
The current high point should not reach its previous low point.
The current low point should be lower than its previous low point.
Spotting Trend continuation pattern using Trendlines
In other, for this to be successful, the trendline should not be broken. Once there is a breach, this can lead to a reversal. Bullish and Bearish Trend continuation pattern using Trendlines can be explained and spotted below
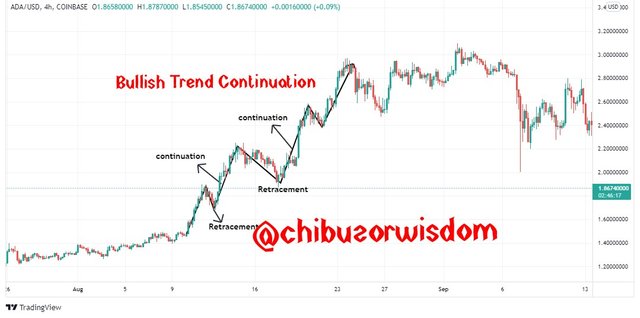
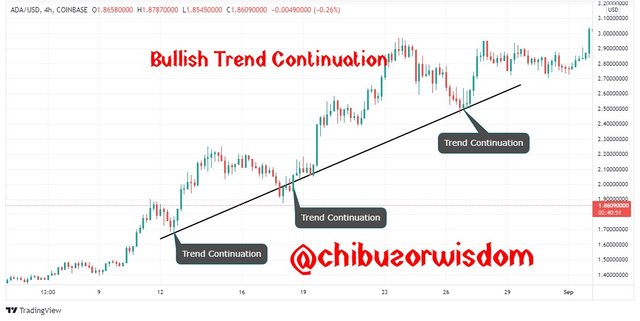
Bullish Trend
In the case of a bullish trend continuation, the trendline serves as a support level in the chart below.
.jpeg)
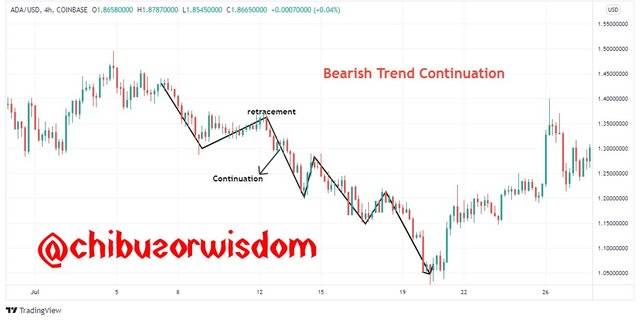
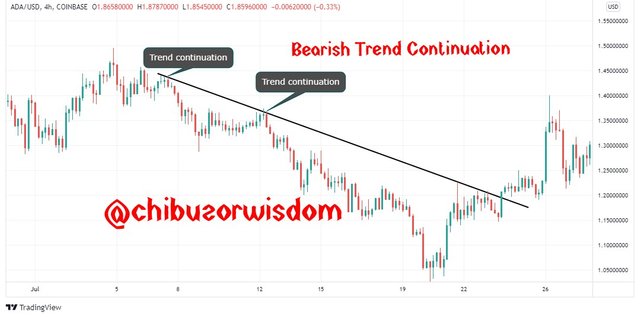
Bearish Trend
In the case of a bearish trend continuation, the trendline serves as a resistance level in the chart below.
Pick up any crypto-asset chart and answer the following questions -Is the market trending? What is the current market trend? (Use the chart to back up your answers
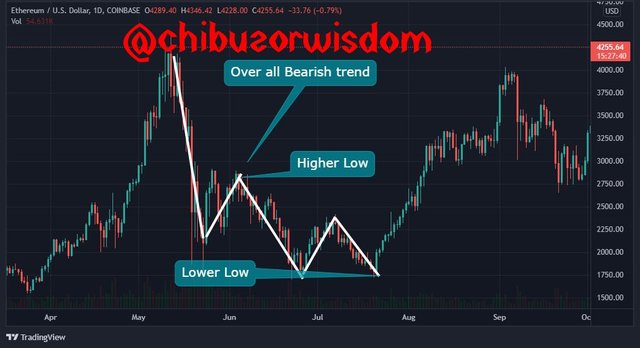
From the crypto-asset pair above the current market is in a bearish trend. It's creating higher lows and lower highs. It's safe to say that the market is trending.
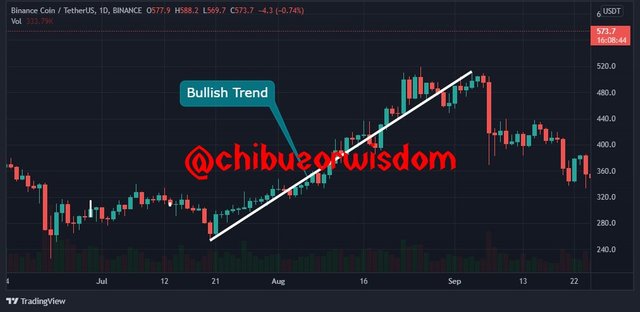
From the crypto-asset pair above the current market is in a bullish trend because it was an uptrend from it supports. Technical analysts however shouldn't make decisions by just analysing one chart, series of candlestick charts should be evaluated in other to fully understand the current market trend.
Conclusion
The first thing an investor or trader should know is the market trends. Understanding this trends gives them direction on how to trade by either maintaining a good entry position or by exiting as at when due. The crypto market is a global place and as such assets keeps fluctuating in prices and it's up to technical analysts to use these trendlines and market structure in making better decisions cause the market chart is either going upwards, downwards or maintaining an average or ranging position.
Hello @chibuzorwisdom, I’m glad you participated in the 1st week Season 5 of the Beginner’s class at the Steemit Crypto Academy. Your grades in this task are as follows:
Observations:
Relate your studies only on the crypto market. This is Crypto Academy.
Recommendation / Feedback:
Thank you for participating in this homework task.