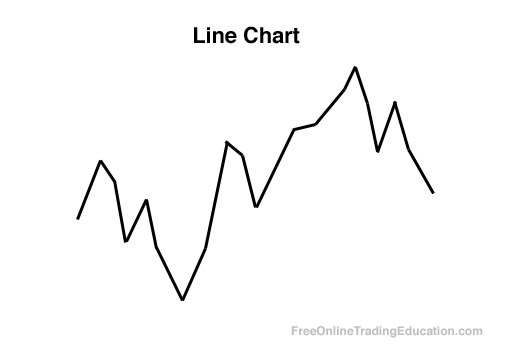
Effective Trading Strategy using Line Charts ]-Steemit Crypto Academy | S6W1 | Homework Post for @dilchamo
Line charts are great for trend analysis.
Basically a series of lines are drawn that show the movement of price.
It’s interesting to know that a price line chart is only that. It’s not a lie detector. It can inform a trader what’s going to happen next, but it’s useless to know if something’s really going to happen. It will give you some intuition about the market in a given time frame.
Line chart is a visualization type for cryptocurrency trading.
Line charts have a unique style that is easy to visualize, so they are great for making visualizations of the current trending market.
Line charts are also interactive, meaning users can see the data on a specific line without knowing any special rules to follow.
It shows prices of a cryptocurrency in general; how well the cryptocurrency is doing.
The line charts is used to understand how the cryptocurrency market has been performing.
It shows the dynamics of how the market works, and it’s a good tool to understand the market.
It just shows you the price trajectory in general, and not the market price.
Line charts can help traders to understand the current state of the market.
It is used to sight the future price movement in a cryptocurrency, depending on the trend.
Q2: How to Identify Support and Resistance levels using Line Charts (Demonstrate with screenshots)
Taking a look at the btc/USDT chart on binance, we can see that technical support currently comes in at the $43,700 and $43,800 level, and resistance sits at the $43,850 level. In the event that support can climb higher and surpass resistance then a bullish target should become apparent as seen on the screenshot.
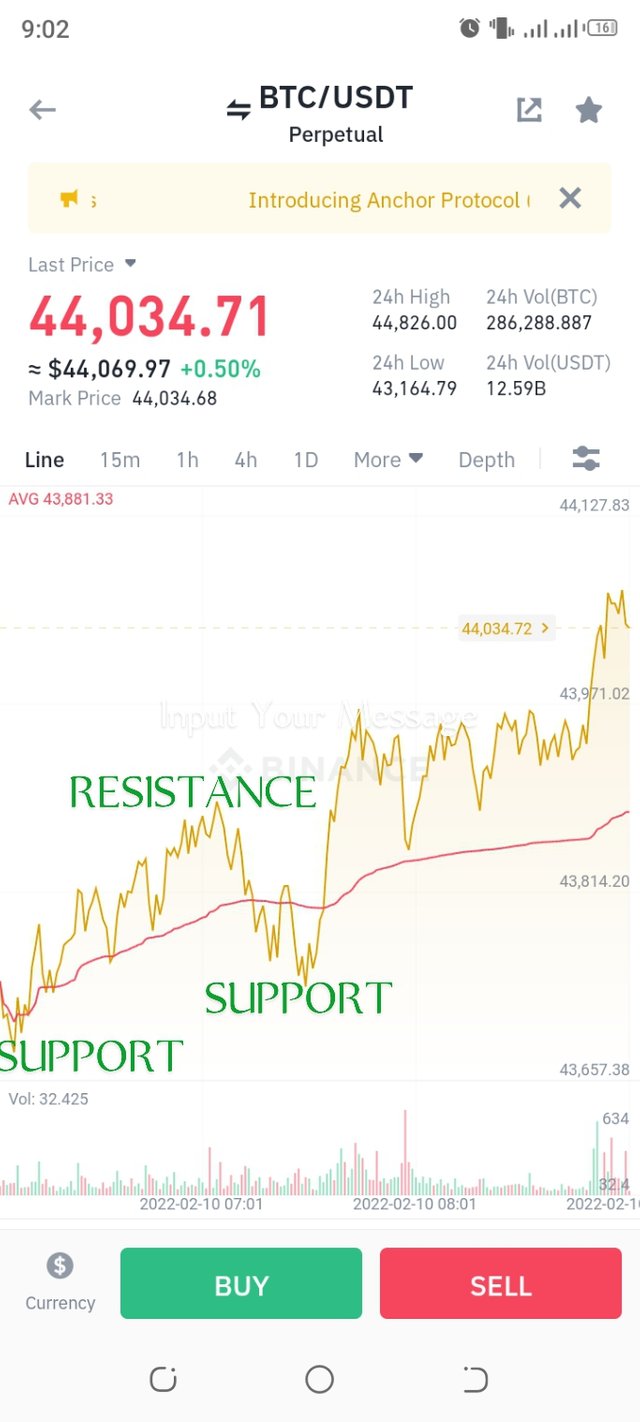
Screenshot from Binance
In addition, the Stochastics is currently indicating that the bulls are in charge at the time being with readings showing an overbought reading. If this indicator turns down, or holds at current levels, it will invalidate the bullish bullish move.
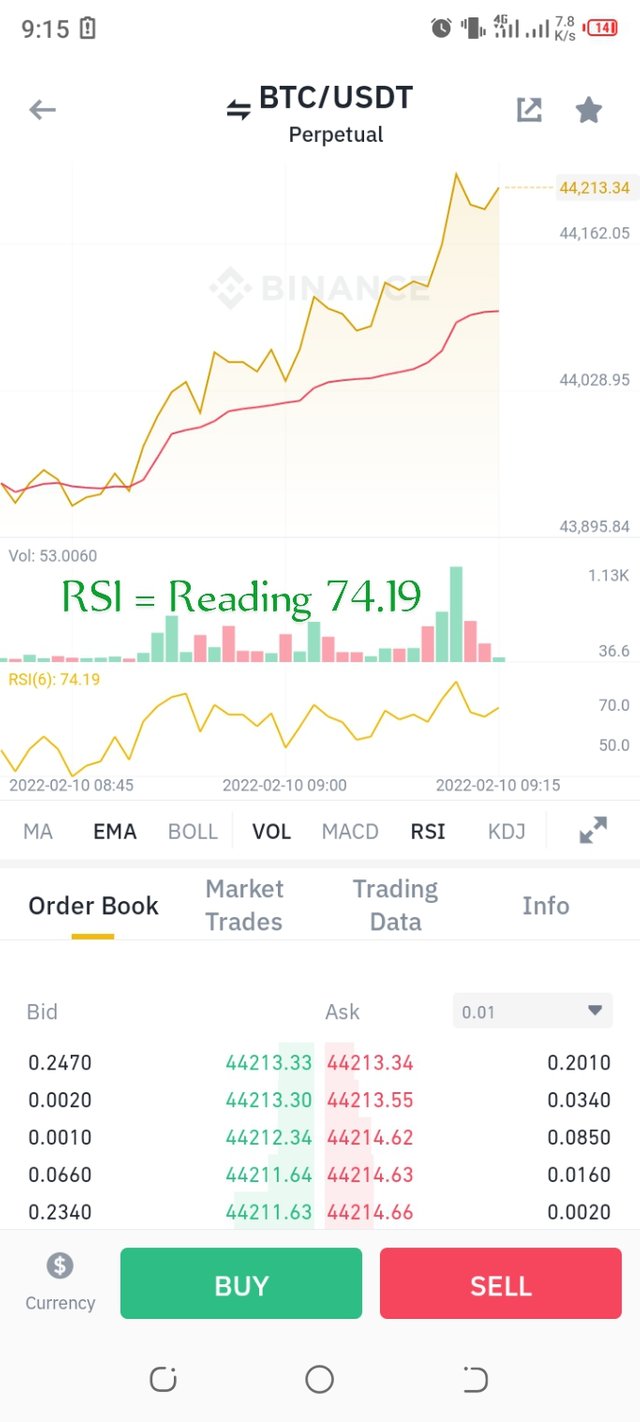
Screenshot from Binance
By using the RSI as a reference point, we can see that btc is currently trading at overbought levels. This signals that there is a risk of a pull back on the horizon, with a pull back to the $43,850 level in the near-term a possibility.
Q3: Differentiate between line charts and Candlestick charts.( Demonstrate with screenshots)
Even though they look very similar to the user, they are different techniques.
To highlight the differences: In line charts we are specifying a data point, and in candlestick charts we are specifying the top and bottom.
Line charts can show the distribution of values with fixed points or without fixed points, but you can only see the top of the chart.
Candlestick charts show a tree-like structure. The points have clear boundaries with a limited width. The tree structure makes it easy to see the changes between values.
in candlestick, a trader select a color of the chart, otherwise you’ll see a whitish line with no information.
You have to determine the minimum width the chart can be for candlestick.
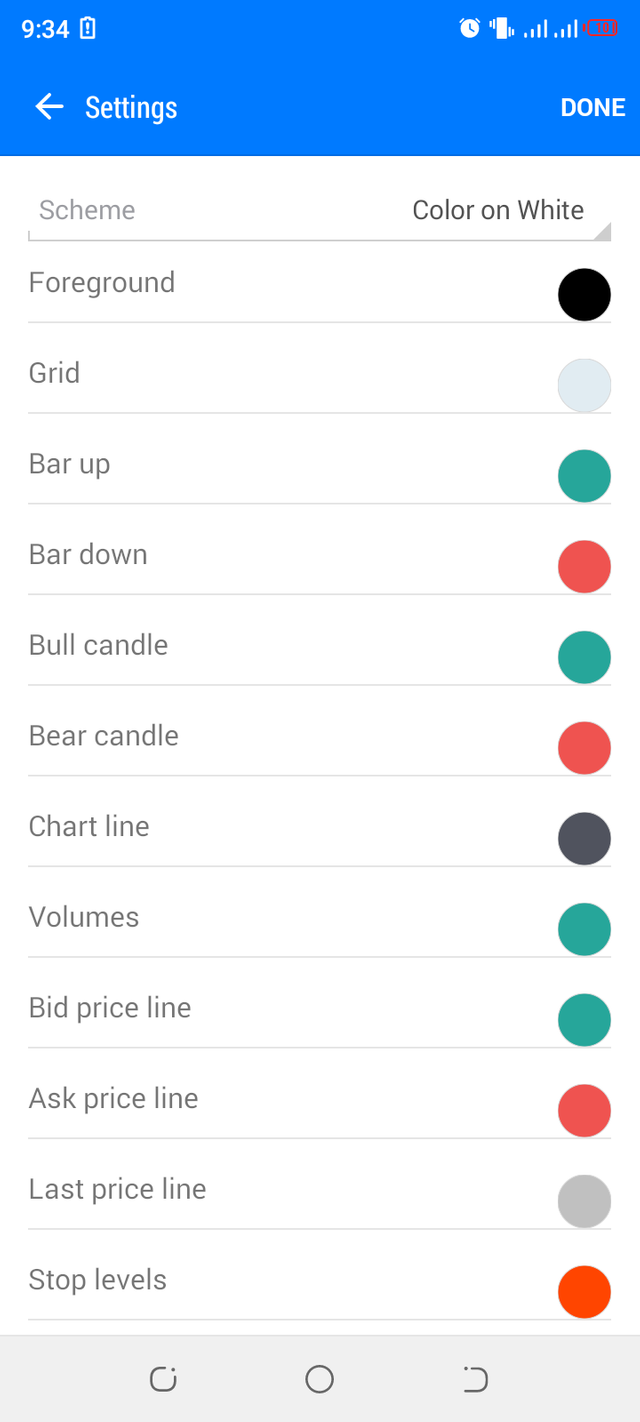
Screenshot on the settings of Candlestick color on MT5
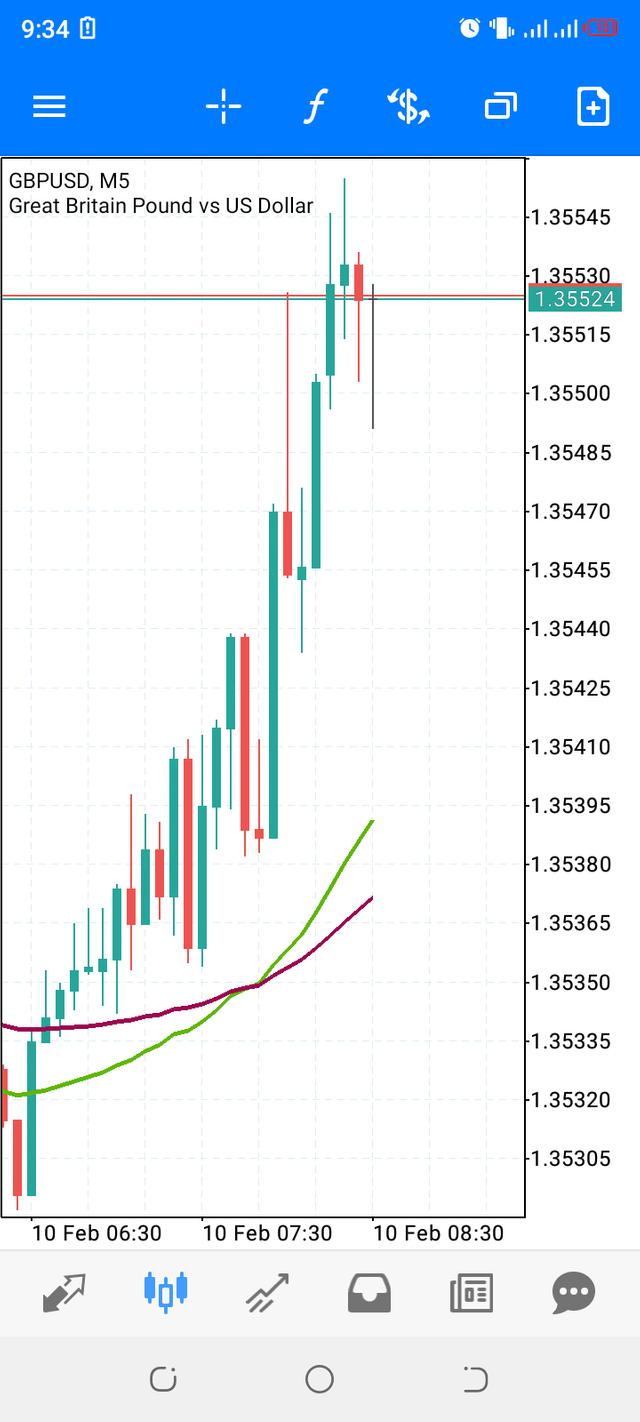
Screenshot on the output from the settings of Candlestick color on MT5
Q5: Prove your Understanding of Bullish and Bearish Trading opportunities using Line charts. (Demonstrate with screenshots)
Buy Opportunity
Support and resistance are relatively in line, so this is a great time to open a buy position. That said, when support is decreasing, it's a little bit of a warning sign for the next 5-10 minutes, but buying is still recommended at these levels.
Support and resistance is pretty different, so beware of this. Sellers of the particular crypto will emerge and the prices will fall sharply. If the price is higher than the average, you should take profits. If the price is lower than average, you should place a stop loss. Note that you can also buy on this drop, but you will still be exposed to huge losses if the shares continue to fall.
Sell Opportunities
Support and resistance is out of sync, which means it is the perfect time to close the position. After a great run, there is a lot of resistance and there is even a good possibility that more will be sold over the next week or so.
.png)
| ADVANTAGES | DISADVANTAGES |
|---|---|
| Line charts offer additional visual detail, such as the areas above, below, and around each bar. | All data points within your chart can be used as bars and the result of those charts is typically considered a line chart. This approach can make the chart difficult to read due to the large number of lines you have to work with. |
| It communicate information faster | It's continues line might be misleading |
| Is a popular choice because the chart type is widely accepted and understood in most countries around the world. | Even if there is a nice graph displayed, the user has no easy way to interact with it. |
Conclusion
line charts are free to the traders, and the common rule is to find a single line that trendlines the entire chart.
Every major or minor trendline in cryptocurrency market history indicates a price. The line chart is used to predict future trends. It’s a line chart, and it’s helpful if you need to know the price of the cryptocurrency, and how it’s performing in the future. Usually it’s used to predict which trendlines the market is going to follow.

