Ultimate oscillator indicator- Steemit Crypto Academy- S5W8-Homework post for @utsavsaxena11.
.png)
Hello and welcome to my entry on steemit crypto academy. I'm pleased to have you read my entry on Intermidiate course prepared by
@utsavsaxena11
Q 1:
What do you understand by ultimate oscillator indicator. How to calculate ultimate oscillator value for a particular candle or time frame. Give real example using chart pattern, show complete calculation with accurate result.
Ultimate Oscillator was developed to reduce the trading signals which comes almost all the time from other Oscillators that doesn't last. It's condition produces few trade signals and it considered considered to be working perfectly in the market.
The indicator uses 7, 14 and 28 time period to explain the different time frames in the trending market.
How to calculate the Ultimate Oscillator
Before the use of any indicator in the market, it is good to understand the tool, because in the market "ignorance is not an excuse". I will take you through on how to calculate the indicator.
Formulas
- BP: Which stands for Buying Pressure is calculated as thus the reading of the previous or prior close minused from the present low.
- TR: True Range, has its explanation as minus the previous or prior low or lower from the present high or higher.
- The average is gotten from the adding the value of the said BP with a given periods.
- To get the accurate calculation for the steps. below.
First each of the periods has a particular weight apportioned to it eg, 7 is been carried by 4, 14 is been carried by 2 and 28 is been carried by 1. Add all the periods together then times it by 100.
.jpeg)
Q2 :
How to identify trends in the market using ultimate oscillator. What is the difference between ultimate oscillator and slow stochastic oscillator.
To identify the trends in the market using ultimate Oscillators may not be easy for a start but on the long run, it will be easily identified.
- Ultimate Oscillator is an indicator with three different lines representing the three time frames as mentioned above.
- It's reading above the horizontal line, measuring 70 means the market has over bought and it's reading below the horizontal line, 30 tell the traders that the market has over bought.
- The essence of this indicator is to filter the false divergence of the trend thereby given some cool signal.
With the illustration above, it is now easy to identif
Different between ultimate oscillator and slow stochastic oscillator.
| ULTIMATE OSCILLATOR | SLOW STOCHASTIC OSCILLATOR. |
|---|---|
| The Ultimate Oscillator makes due with three time frames | It uses only one time frame |
| The calculation is based on the three time frame | The calculation is based on one time frame |
| Signal line could be added | It is not added. |
Q 3:
How to identify divergence in the market using ultimate oscillator, if we are unable to identify divergence easily than which indicator will help us to identify divergence in the market.
To identify divergence of the market with Ultimate Oscillator there are few things that must happen.
A strong bullish or bearish candlestick must form.
There must be a reading above 70 and a reading below 30.
Q4:
what is the 3 step- approach method through which one can take entry and exit from the market. Show real example of entry and exit from the market.
Sell divergence:
This divergence could be identified using three different steps
- The market price will be in an uptrend giving a series of higher high and lower high. Therefore it tells traders a possible reversal is about to happen.
- Divergence must be above the overbought line which is 70.
Buying Divergence:
- The market price will be in a downtrend giving a series of low and lower. Therefore it tells traders a possible reversal is about to happen.
- Divergence must be below the overbought line which is 30.
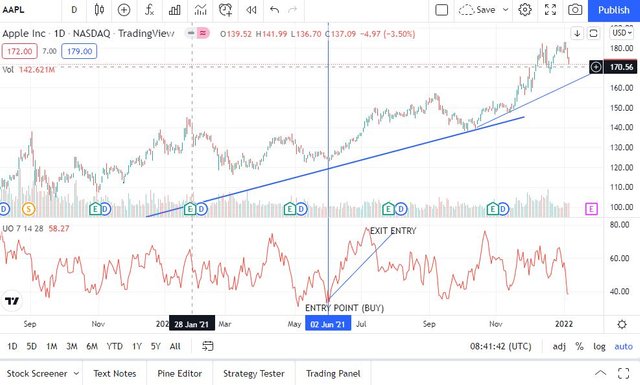
Screenshot from Tradingview
Q5:
What is your opinion about ultimate oscillator indicator. Which time frame will you prefer how to use ultimate oscillator and why?
Ultimate Oscillator is an indicator that gives potential information in the execution of trade.
The indicator is very different from other other Oscillators from the time frames it uses, the different approach in calculation, the divergence it provides.
From the time In started researching about this indicator in order to understand this indicator, I became interested in it.
I will encourage follow traders to incorporate this kind of divergence in their trading espey day traders since it doesn't give much signal.
I will prefer to use this on 15 minutes as a scalper. The moves will provide lots of buying and selling signal to profit from.
Q6:
Conclusion
Learning this indicator has being an eye opener for me. It has enhanced and extended the understanding on how to trade more using the experience gotten here.
