Basic trading strategy using the Harmonic pattern AB=CD + Fibonacci - Crypto Academy / S4W2 - Homework post for [ lenonmc21]

Some people might be wondering, what is the word Harmonic doing in the crypto space, because maybe they have been used to the term Harmony when it comes to music. But lets also tell them that there Harmonic also it meaning in the cryptocurrency market.
Harmonic Trading is a technical analysis in a pure price action that deals with particular waving pattern that seems to repeat itself at a constant interval. Harmonic trading always an up and down movement, which the price makes in the market. Harmonic trading are mostly used to identify a trend that is about to reverse, which works well with the help of Fibonacci retracement levels. Harmonic trading assumes that trading patterns, just like many patterns repeat themselves.
Harmonic trading, in trading simply means that anything that goes up, must come down and anything that is in the ground can go up one day, that is the a price movement constantly repeat itself. The simply is that the bullish impulse where a trend begins, is equal to second bullish impulse and the two bullish impulse, there is always a retracement between the first impulse and the second.
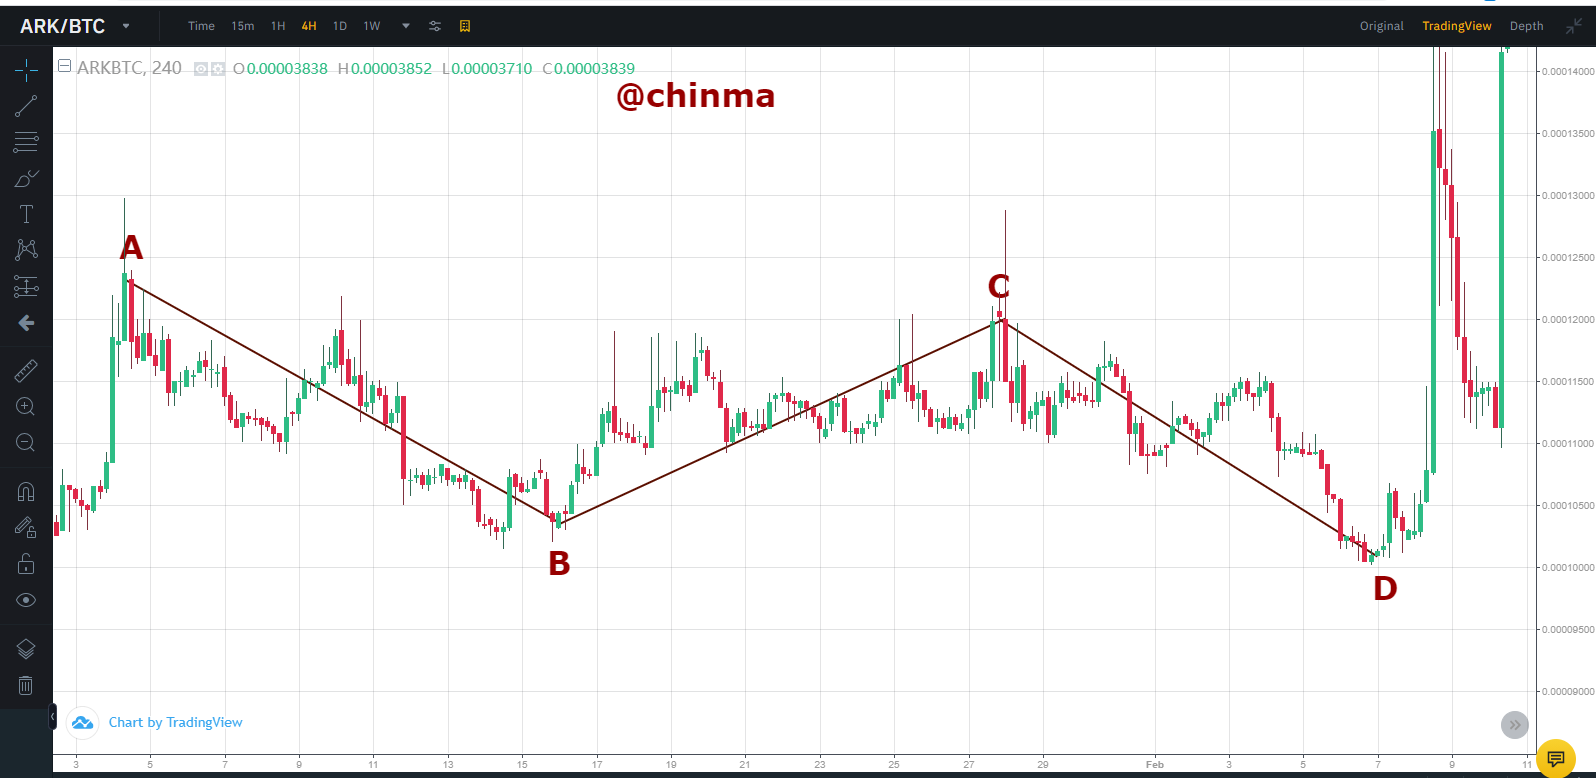
An example of the Harmonic trading can be seen below
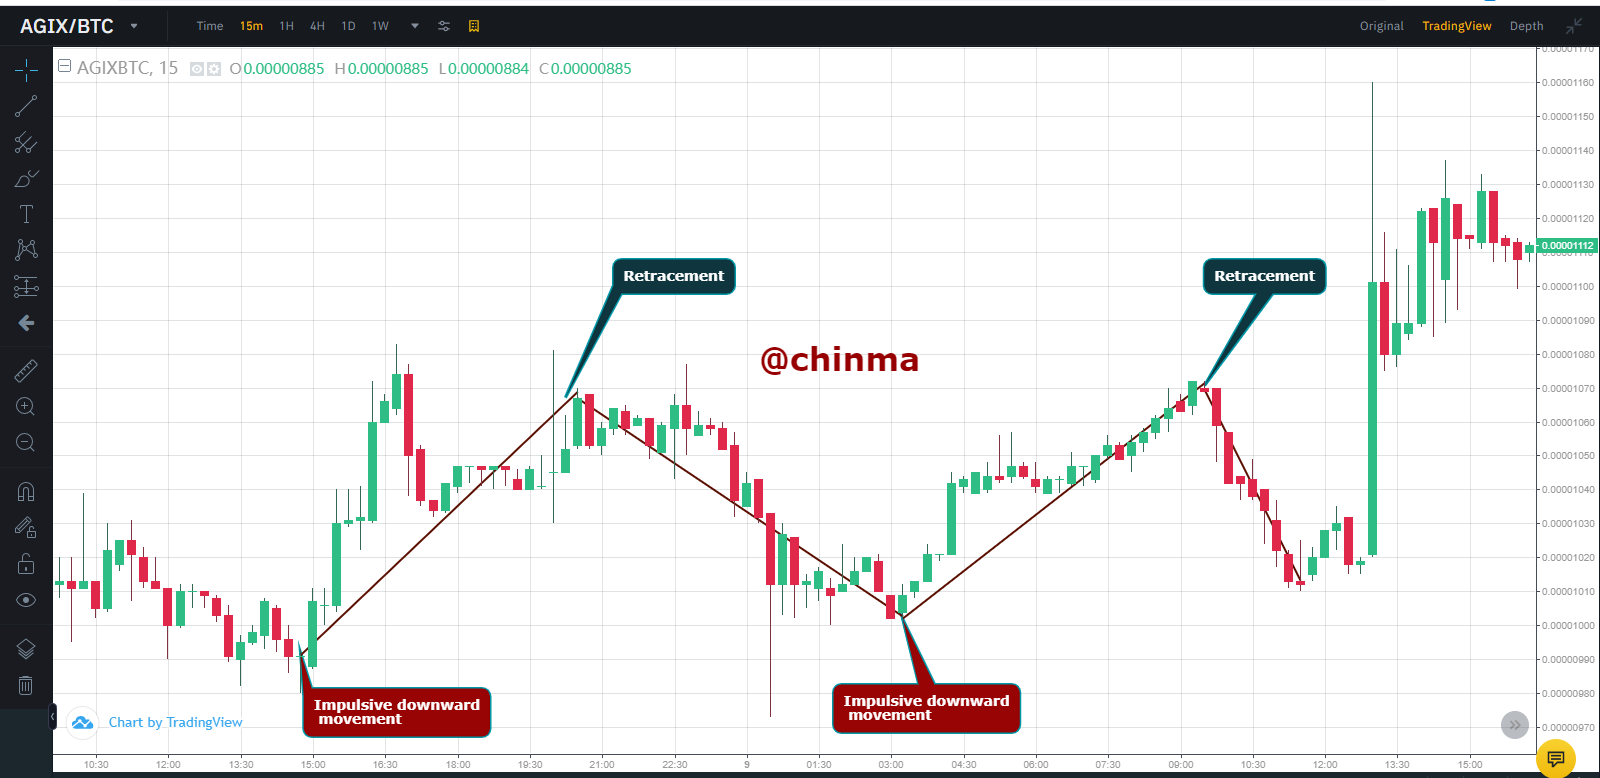
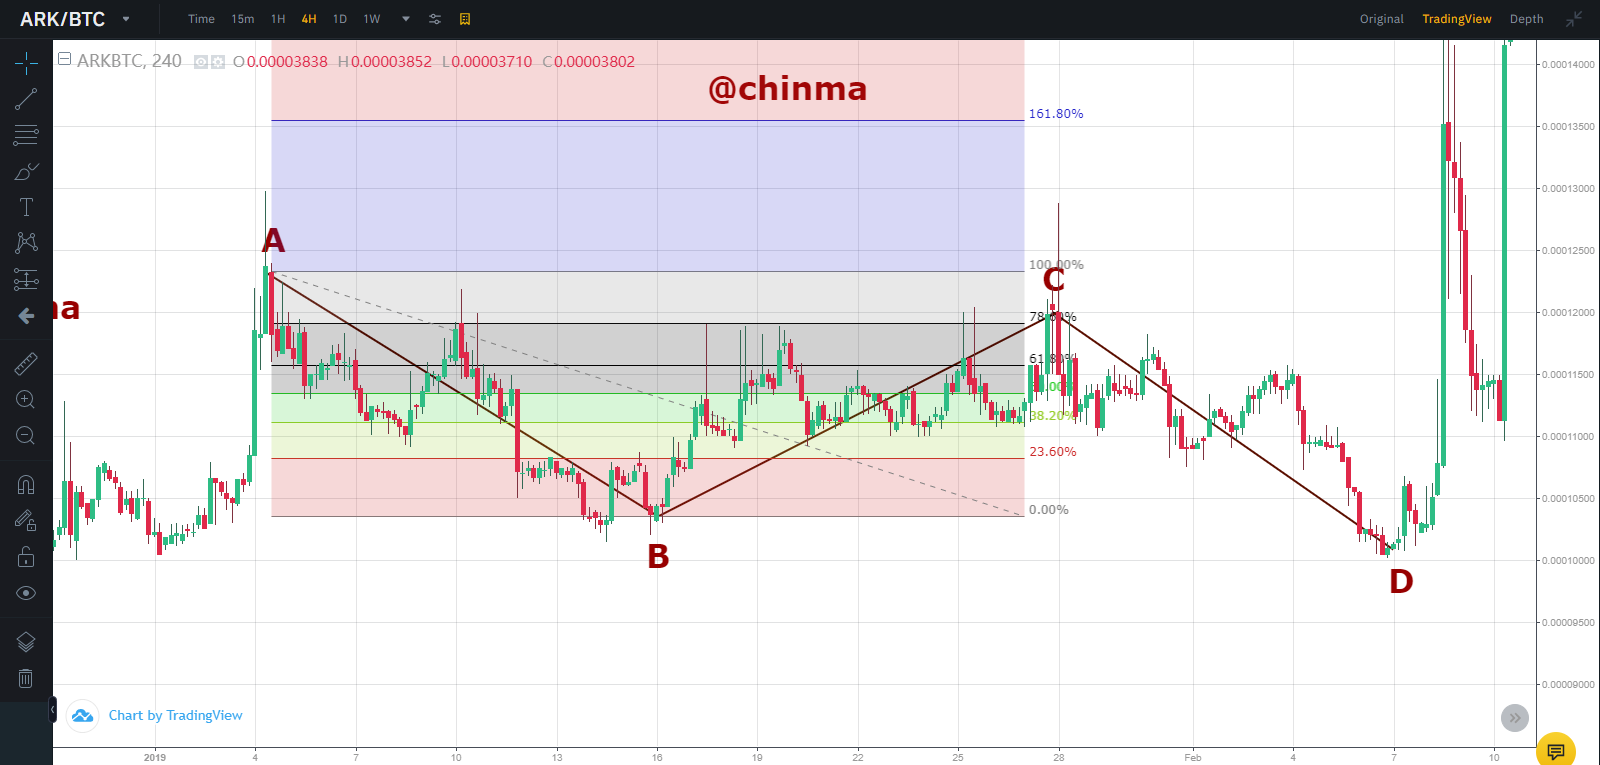
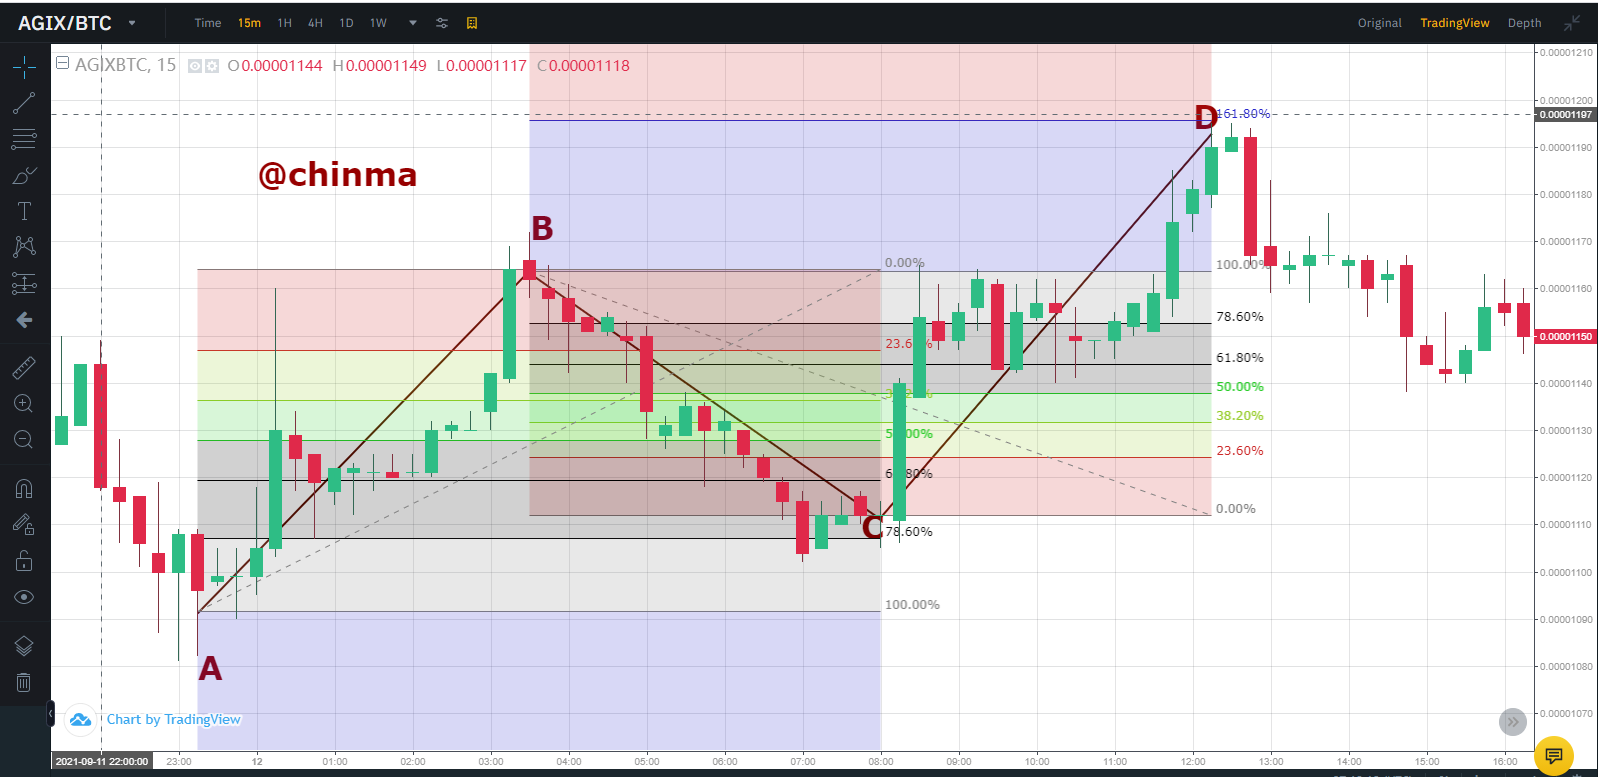
In the chart of AGIX/BTC in 15min time frame, we can see a bearish harmonic trading pattern
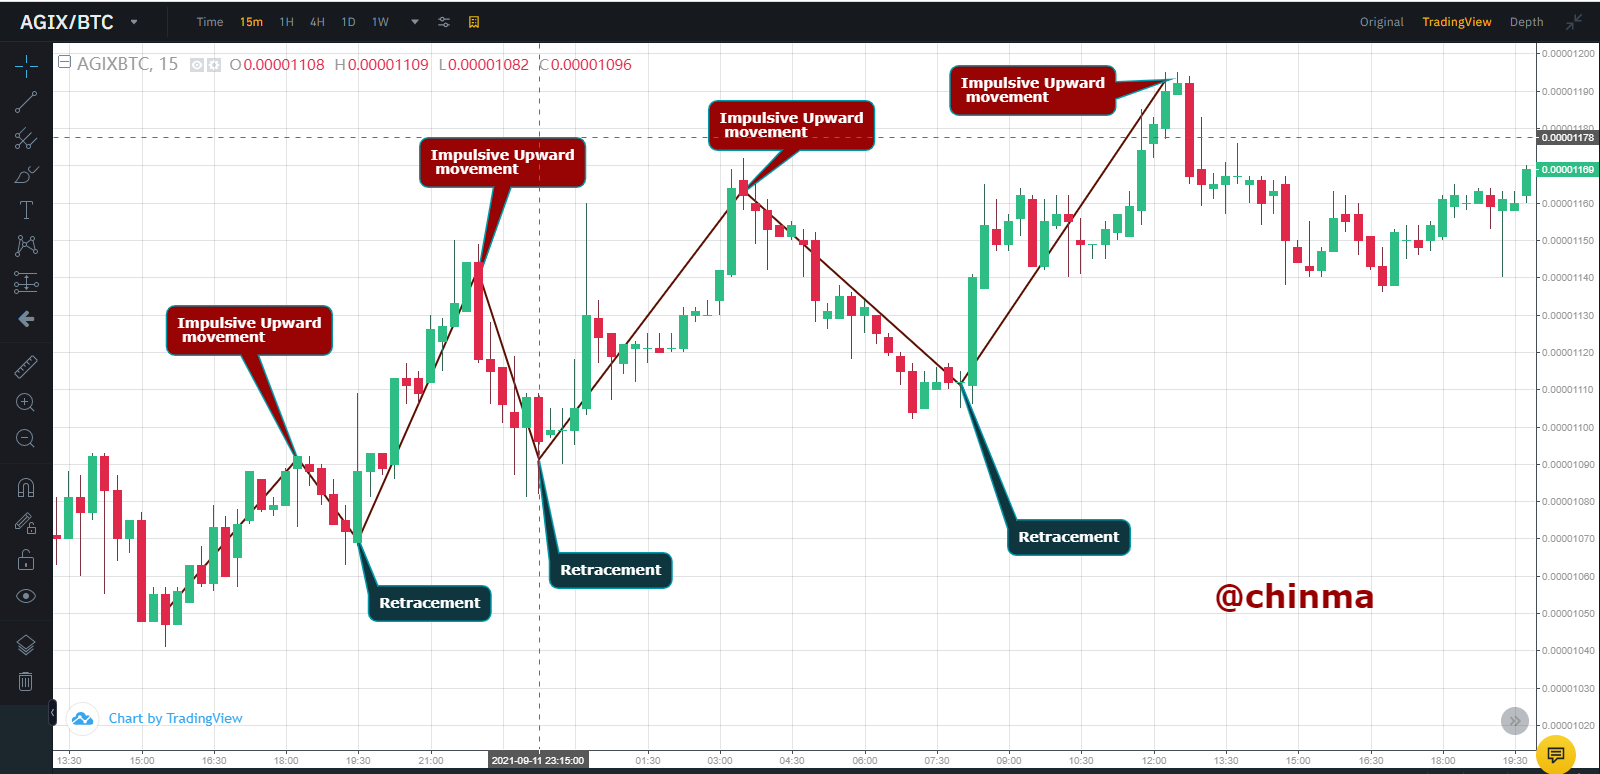
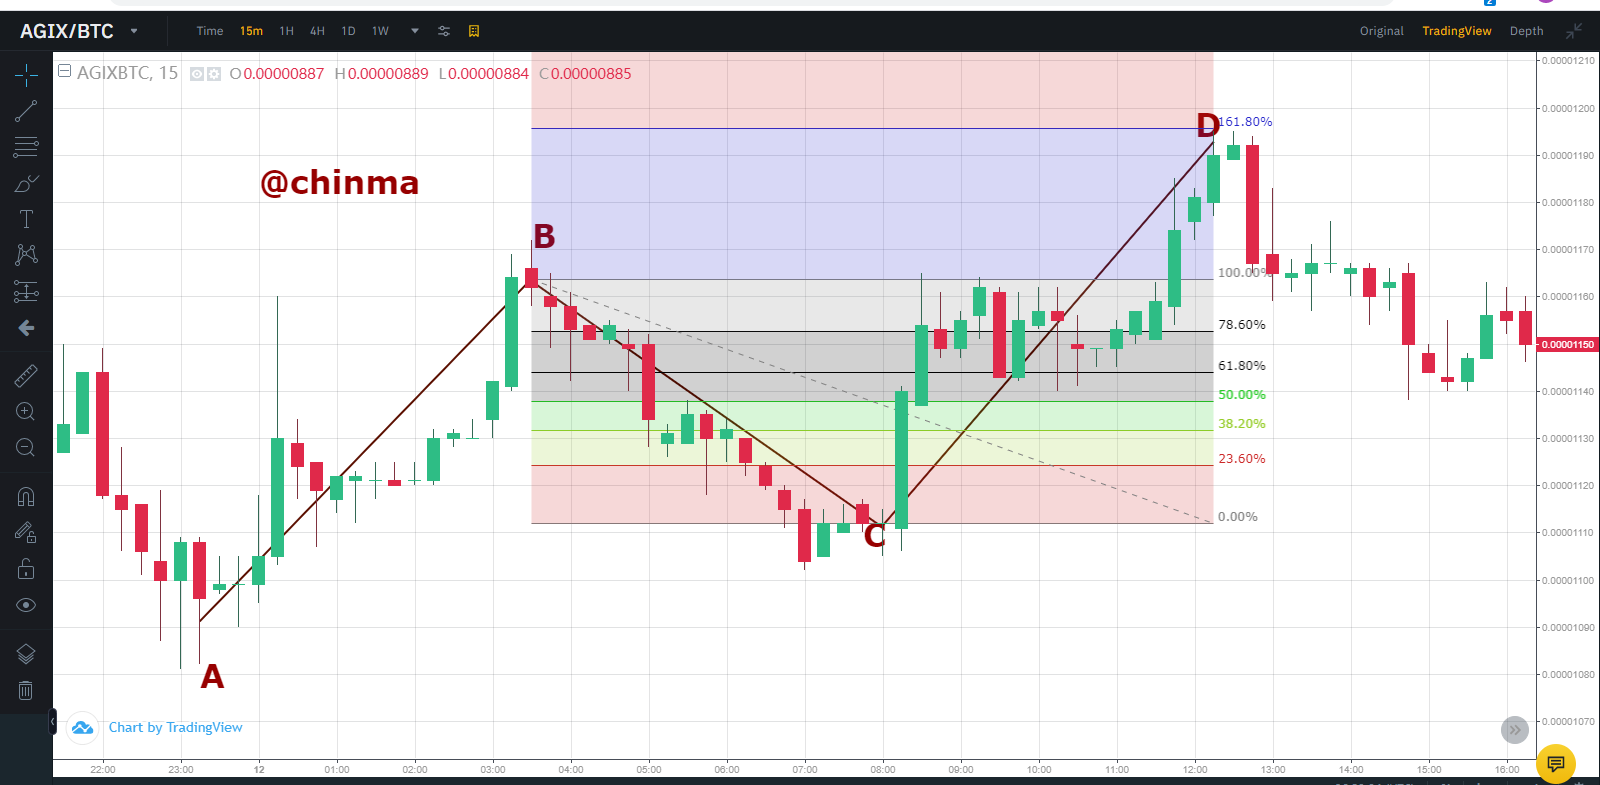
In the chart of AGIX/BTC in 15min time frame, we can see a bullish harmonic trading pattern

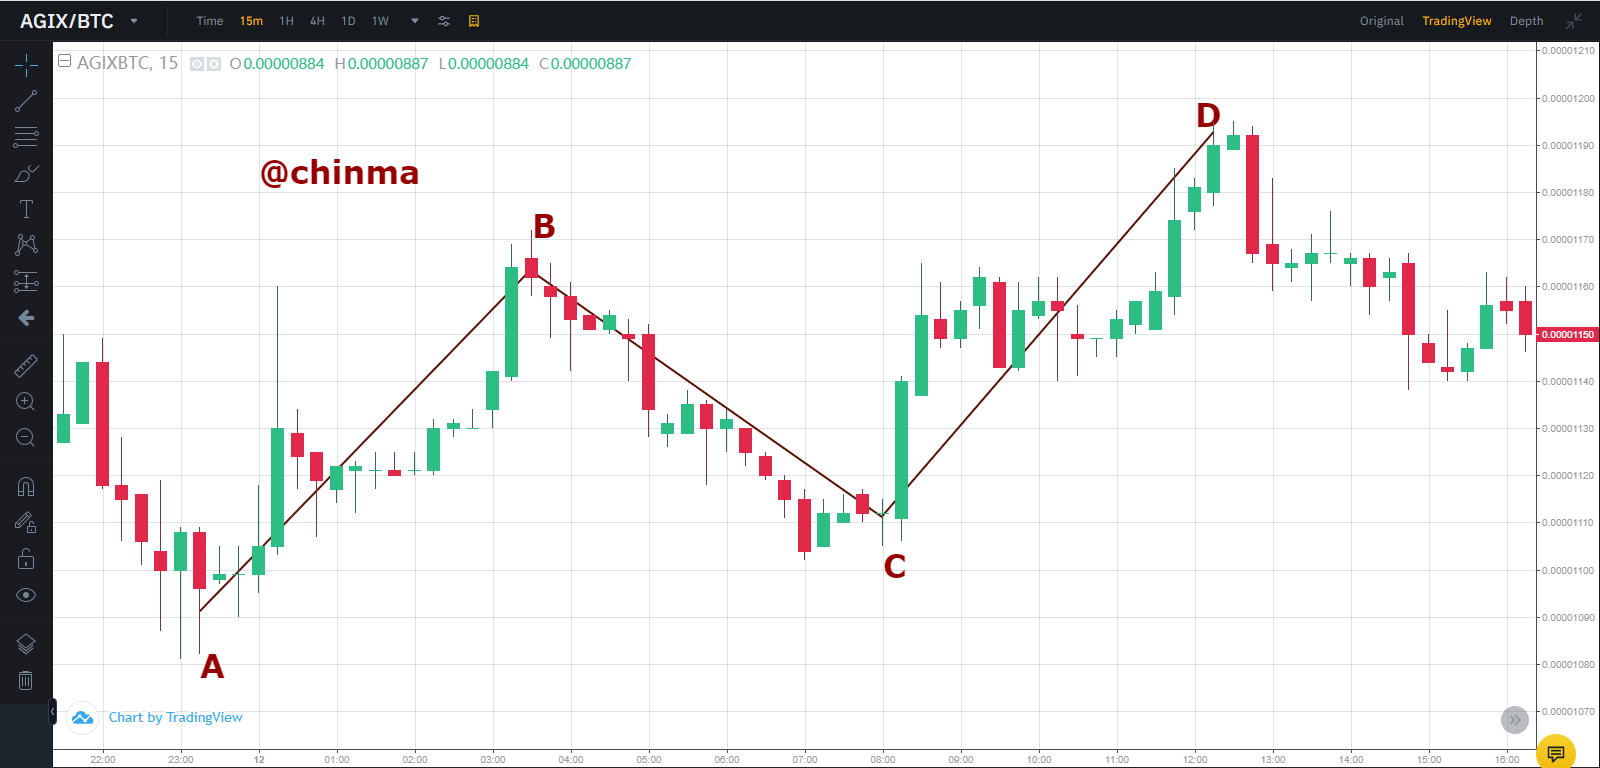
AB=CD pattern is a very important technical analysis which was discovered by H.M Gartley, which he based it on pure price action due to the pattern of the price that repeats itself over a period of time in the market. It can be used in the cryptocurrency market, forex market, stock market etc.
The AB=CD consist of 4 lines and 4 points which are called Points A, B, C and D, which mostly creates a wavy movement due to the trend of the market. Mostly, the AB=CD pattern is mostly used to identity the trend reversals. When the trend is on an uptrend and the pattern is formed , we should be expecting to sell if we have properly discovered and verified the pattern but if the trend is on a downtrend and the the pattern is located, verified also, we should be ready for a long buy.
Lets quickly examine how to properly identify a normal AB=CD pattern. The steps below can be to verify the if the AB=CD pattern is correct and it can be done with the help of the a very important technical indicator called the Fibonacci retracement .
Identification of the AB=CD pattern for a Bearish Movement
- Get your 4 lines and your 4 points which should consists of points A,B,C and D on an uptrend
- Which point A, should the first point and it should be at the lowest level
- Point B came into existence due to an impulsive bullish movement of the price. It should be higher than point A .
- Then point C, is formed due to price retracement, but it must be higher than point A but lower than point B
- Point D is the highest point of the AB=CD pattern, it is due to an impulsive bullish movement of the price and after this point, the trend normally reverses.
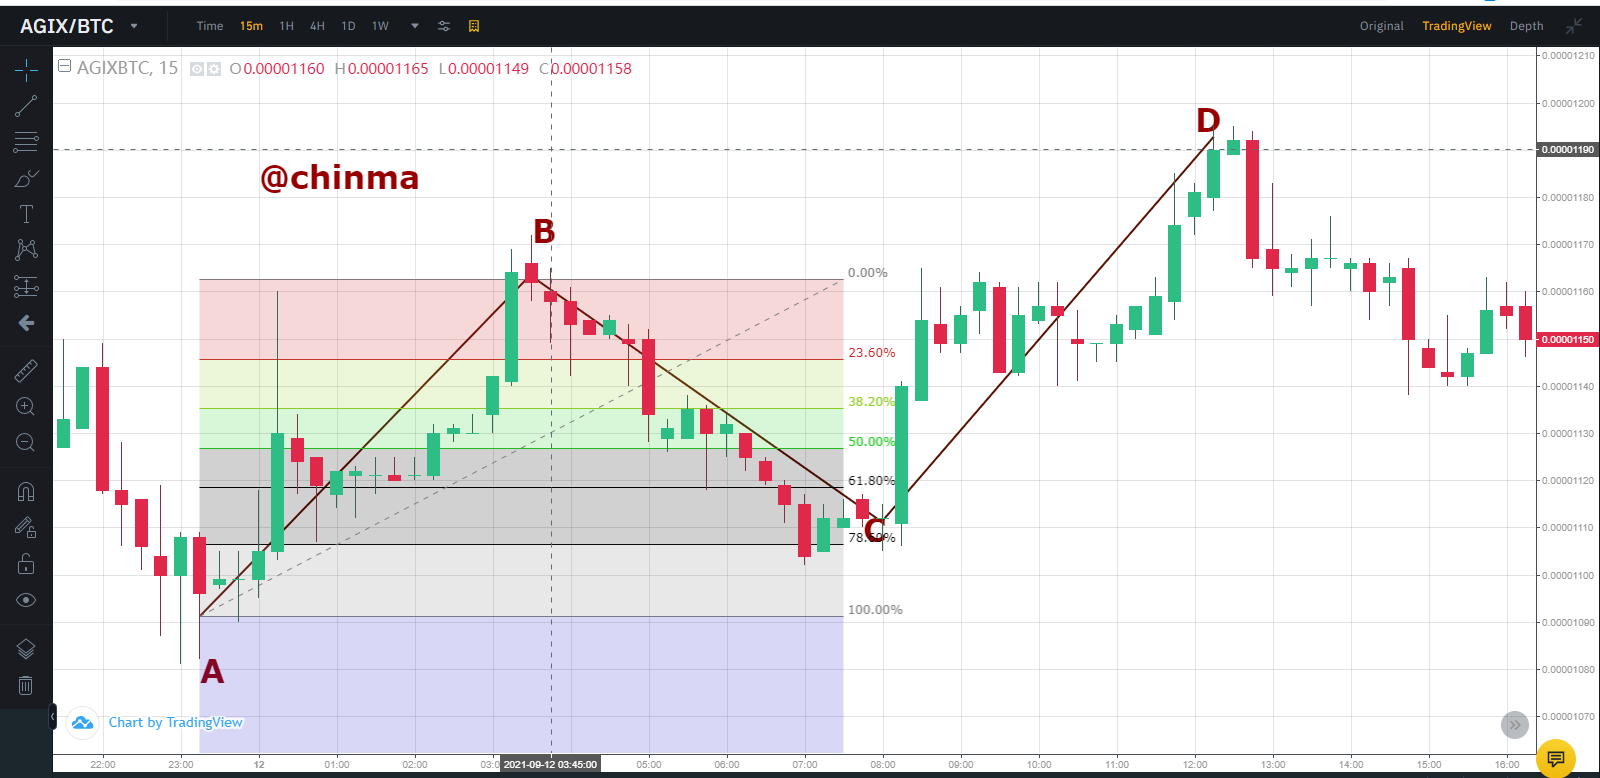
- Fibonacci should be introduced for proper indication. Using the Fibonacci Retracements tool we should measure from points A to B and if Point C lies between 61.8% and 78.6%.
- To further confirm the originality and authencity of the AB=CD pattern, You should also measure from points B to point C, From the measurement, if Point D lies between 127.2% and 161.8% then the pattern is accurate.
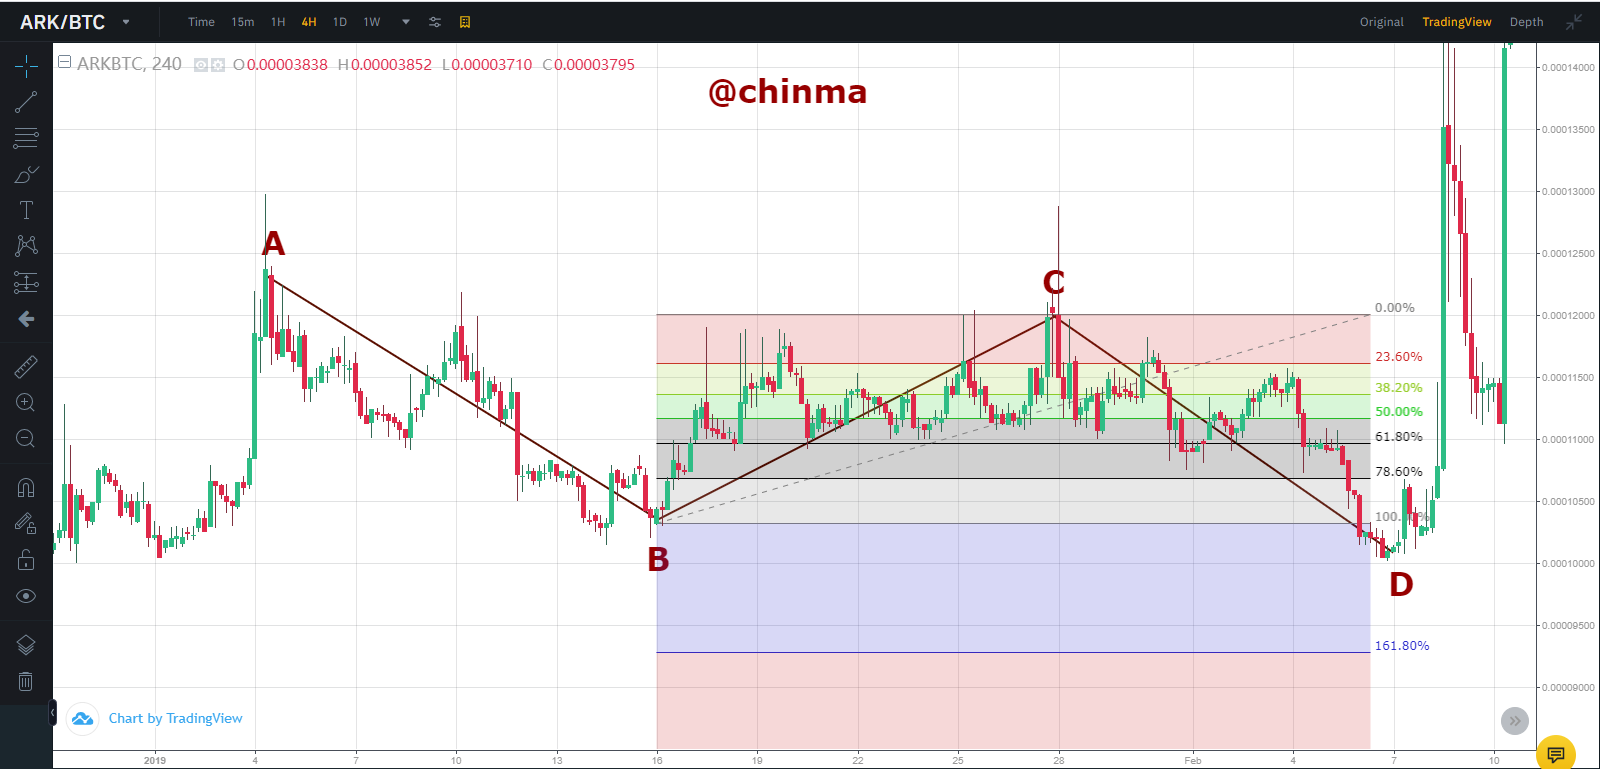
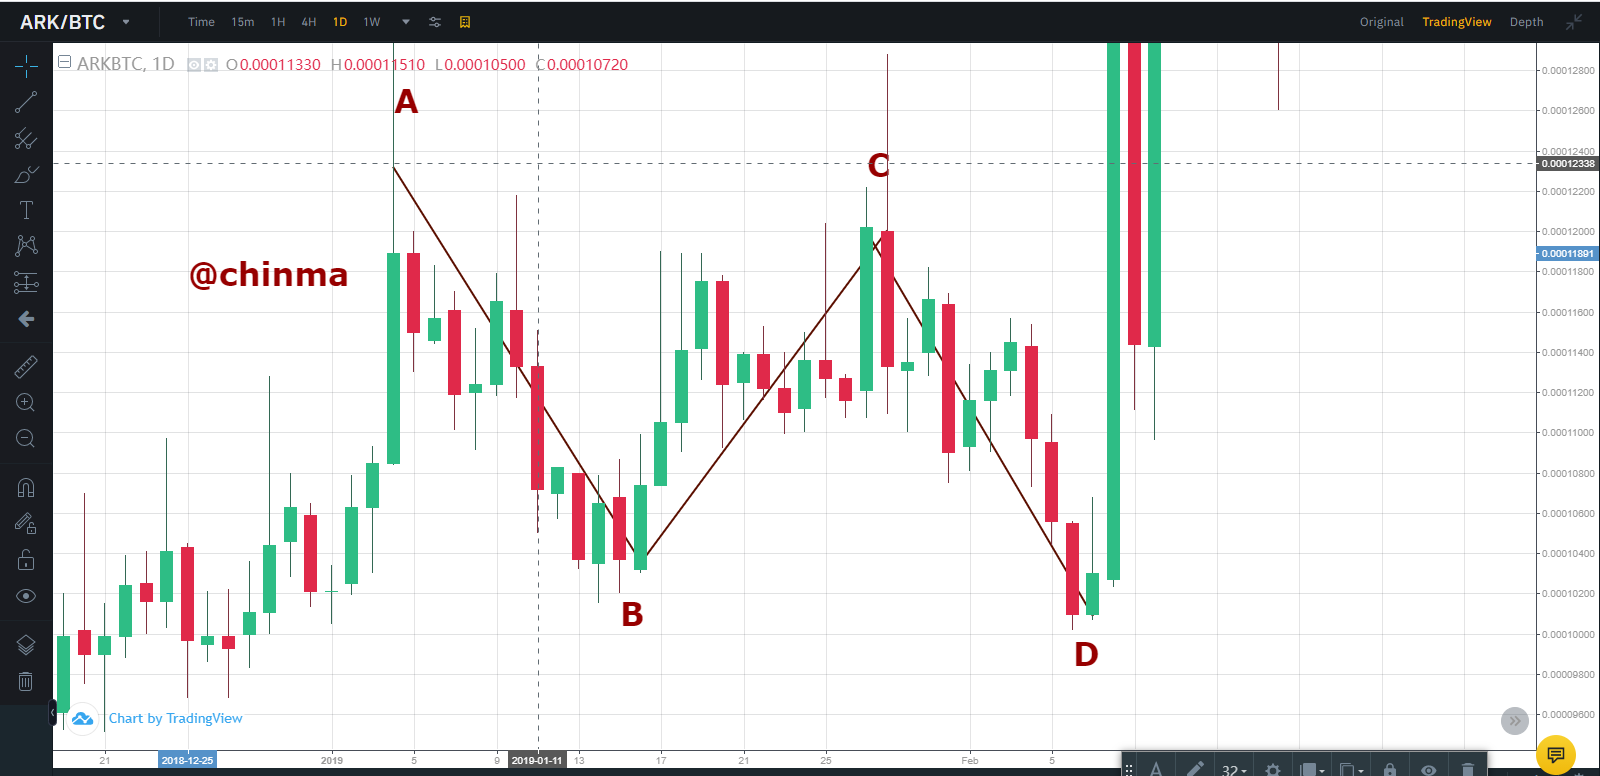
Identification of the AB=CD pattern for a Bullish Movement
- Get your 4 lines and your 4 points which should consists of points A,B,C and D on a downtrend.
- Which point A, should the first point and it should be at the highest level
- Point B came into existence due to an impulsive bearish movement of the price. It should be lower than point A .
- Then point C, is formed due to price retracement, but it must be lower than point A but higher than point B
- Point D is the lowest point of the AB=CD pattern, it is due to an impulsive bearish movement of the price and after this point, the trend normally reverses.
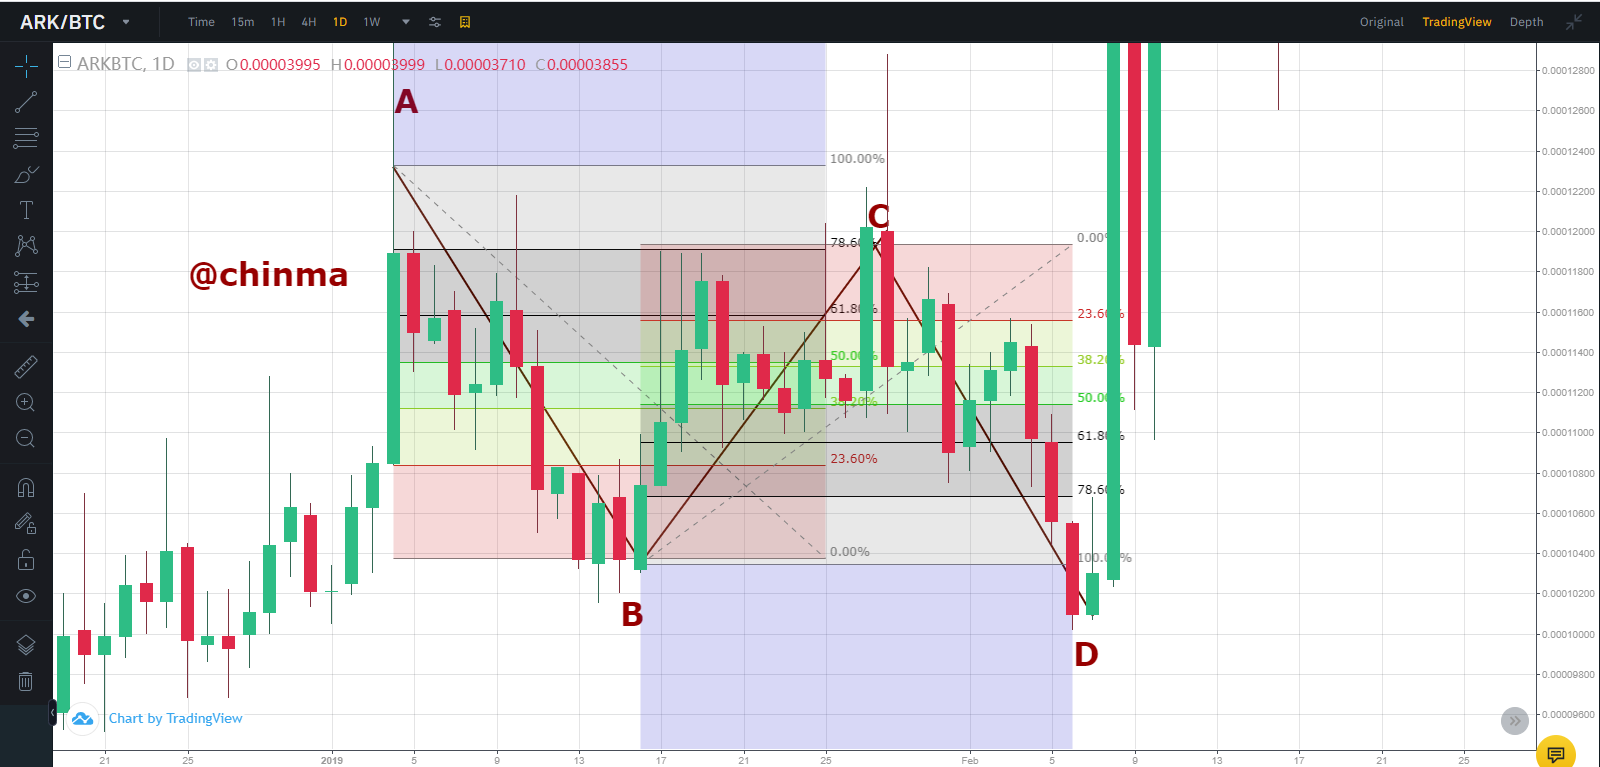
- Fibonacci should be introduced for proper indication. Using the Fibonacci Retracements tool we should measure from points A to B and if Point C lies between 61.8% and 78.6%.
- To further confirm the originality and authencity of the AB=CD pattern, You should also measure from points B to point C, From the measurement, if Point D lies between 127.2% and 161.8% then the pattern is accurate.
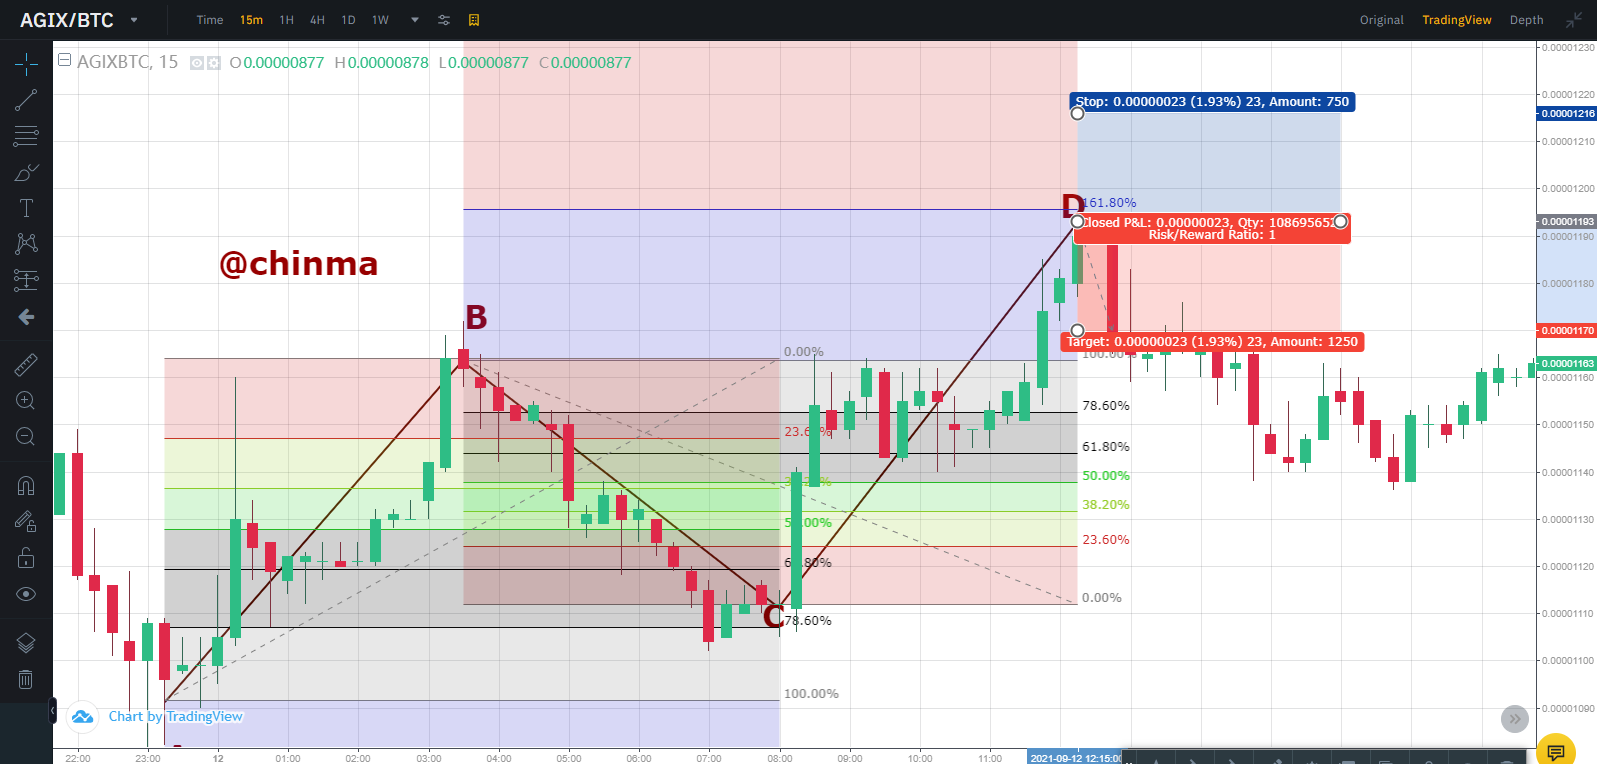
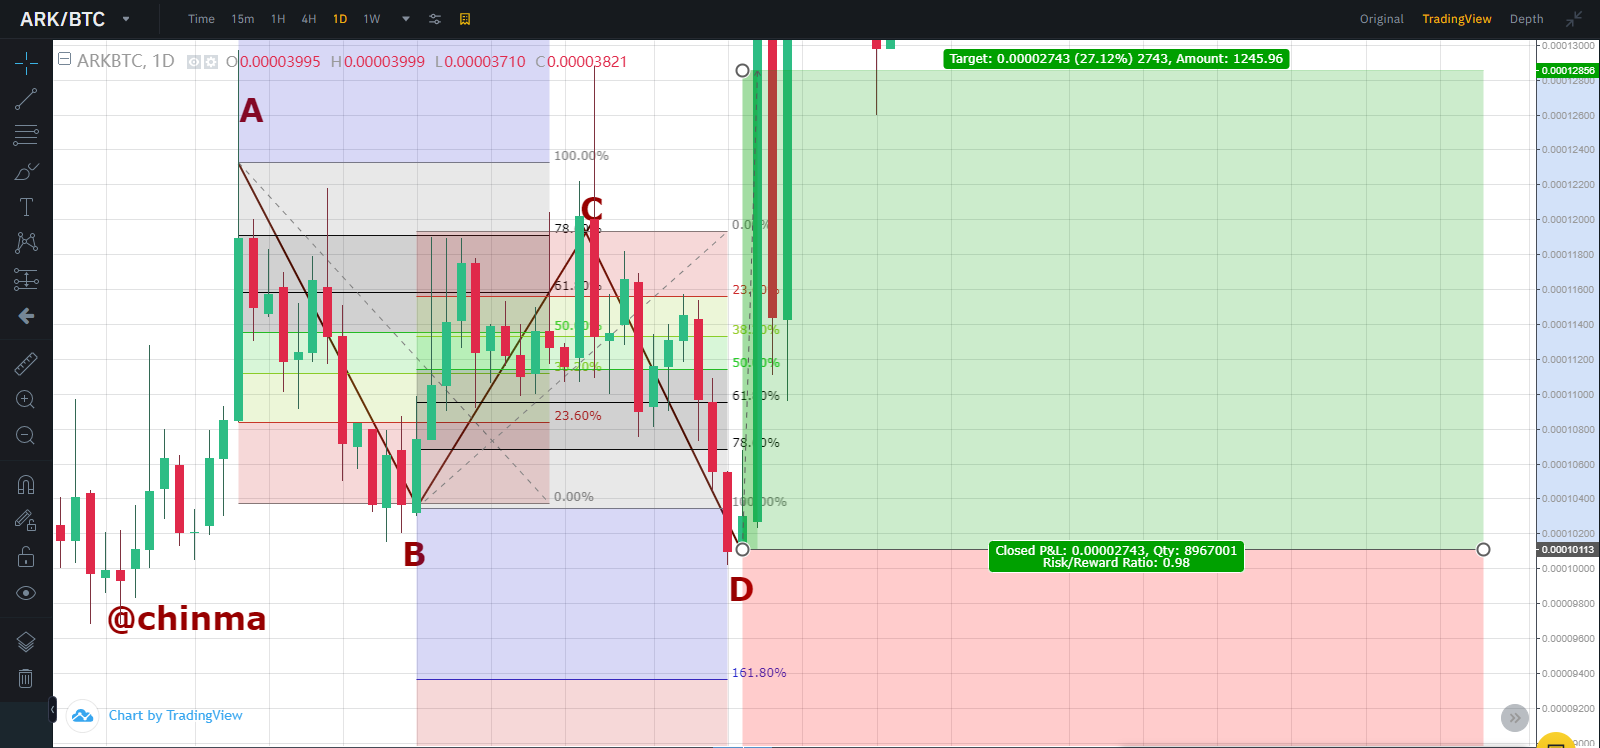
Using the AB=CD pattern and the Fibonacci retracement to place an Entry and Exit of a sell order trade
- Firstly, identify your Points A,B,C and D.
- Then, If Point D lies between the 127.2% and 161.8% from the fibonacci retracements level, the from that point you can enter a sell order from the trend to reverse
- You can also place your take profit and stop loss using the risk to ratio of 1:1 or manual exit the trade if you are satisfied with the profit or loss.
Using the Fibonacci retracement to properly check if the points A, B, C and D are correct, by measuring points A and B, from the measurement if point C lies between 61.8% and 78.6 and measure from points B to C, and from the measurement if point D lies between 127.2% and 161.8% then the 4 points are very correct.
Using the AB=CD pattern and the Fibonacci retracement to place an Entry and Exit of a Buy order trade
- Firstly, identify your Points A,B,C and D.
- Using the Fibonacci retracement to properly check if the points A, B, C and D are correct, by measuring points A and B, from the measurement if point C lies between 61.8% and 78.6 and measure from points B to C, and from the measurement if point D lies between 127.2% and 161.8% then the 4 points are very correct.
- Then, If Point D lies between the 127.2% and 161.8% from the Fibonacci retracements level, the from that point you can enter a sell order from the trend to reverse
- You can also place your take profit and stop loss using the risk to ratio of 1:1 or manual exit the trade if you are satisfied with the profit or loss.
I never knew this harmonic pattern can be used for trading, I thought it was just an ordinary pattern. But due to this topic I have learnt that harmonic pattern havve types such as the AB=CD pattern, which can be very useful when combined with the fibonacci retracement level. If all the rules are properly followed, you can become a very trader using just the AB=CD pattern with the Fibonacci retracement level.
Cc: @lenonmc21