Crypto Academy Season -3 Week3 - Homework Post for @lenonmc21
"Trends" is one word that you will hear about all the time in cryptocurrency trading. Trends is simply the behavior of a certain market. It is either the trend is an uptrend or a downtrend.
The cryptocurrency market is one filled with a lot of uncertainties , so the market rises and fall constantly albeit at some different degrees.
1) An uptrend
This is a situation whereby the price of a token is rising which may be as a result of investor confidence , during an uptrend, more and more people buy the asset with the hope that the price will continue to rise and he or she will make more profit
##2) A downtrend
This is the type of trend that tells us how the price of an asset is falling. This type of trend indicates that the asset is losing value and investors begin to sell their positions. It is worthy to note that the behavior of a trader to trend reversals is dependent on the trading strategy employed by the trader.
WHAT IS A TRENDLINE
A trendline is a line drawn on a candle stitch chart in such a way that it connects all the highs or all the lows or both. Trendlines are useful in that they show the range or limits of the price of a token .
This helps the trader to be able to predict or make decisions, like an entry and exit plan; it should be noted that even the trendline does not always give a sure prediction as , the market may break beyond those support and resistance levels and a new trendline needs to be drawn.
A trendline is a very good way to map out a cryptocurrency asset, because it gives the trader a sense of regularity in this very irregular world.
An uptrend line:
This is a line connecting the base of the candles in an uptrend, this line helps us to understand the rising behaviour of the token of interest ; as the price of a token most times dues not rise regularly. The uptrend line , just like the downtrend line is a straight line. This line helps a trader to make some trade important decisions like whether to sell, or buy more tokens.
How to draw an uptrend line
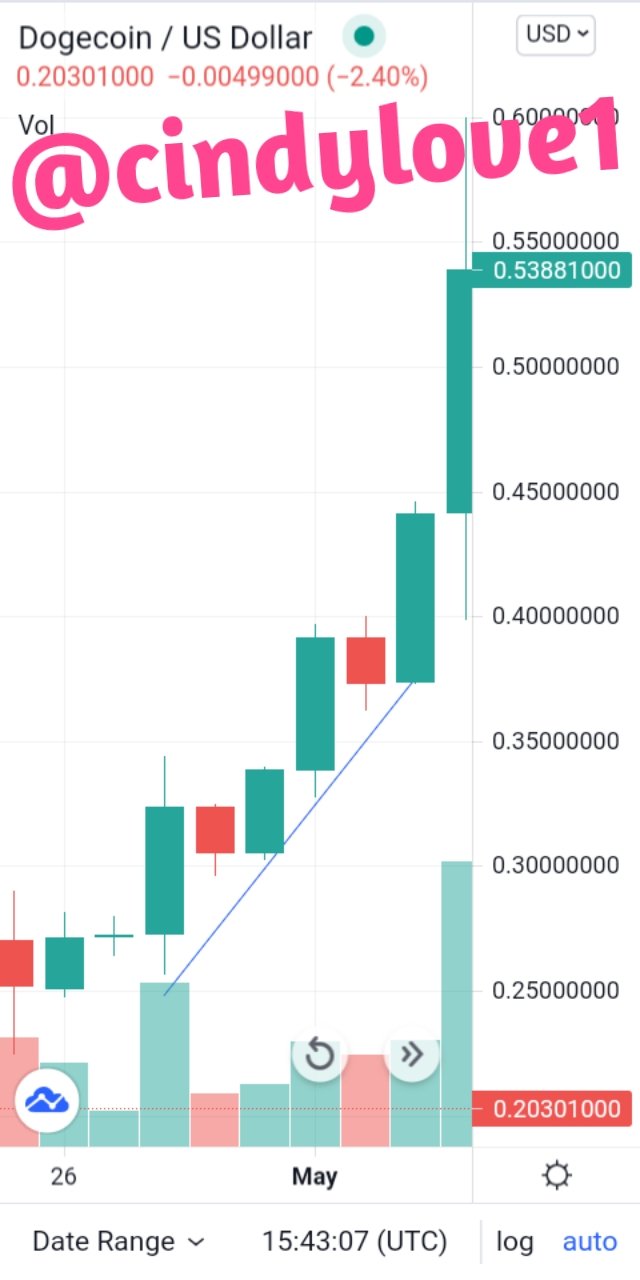
To draw an uptrend line, you need to open the candle chart of any asset, and click on the trendline icon. Now you locate an uptrend or bullish trend and draw your trendline, joining the lows of an uptrend.(using trading view)
A down trend line
This is a trendline that connects the peaks of the candles in a downtrend. This line is a straight line that helps a trader to understand the behaviour of a downtrend. It helps the trader in knowing how best to exploit the downtrend to his or her advantage.
A trader can decide to buy io n a downtrend and sell at a slight trend reversal ; this is more common in day trading as traders are only interested in profiting from small bearish runs.
How to draw a downtrend line.
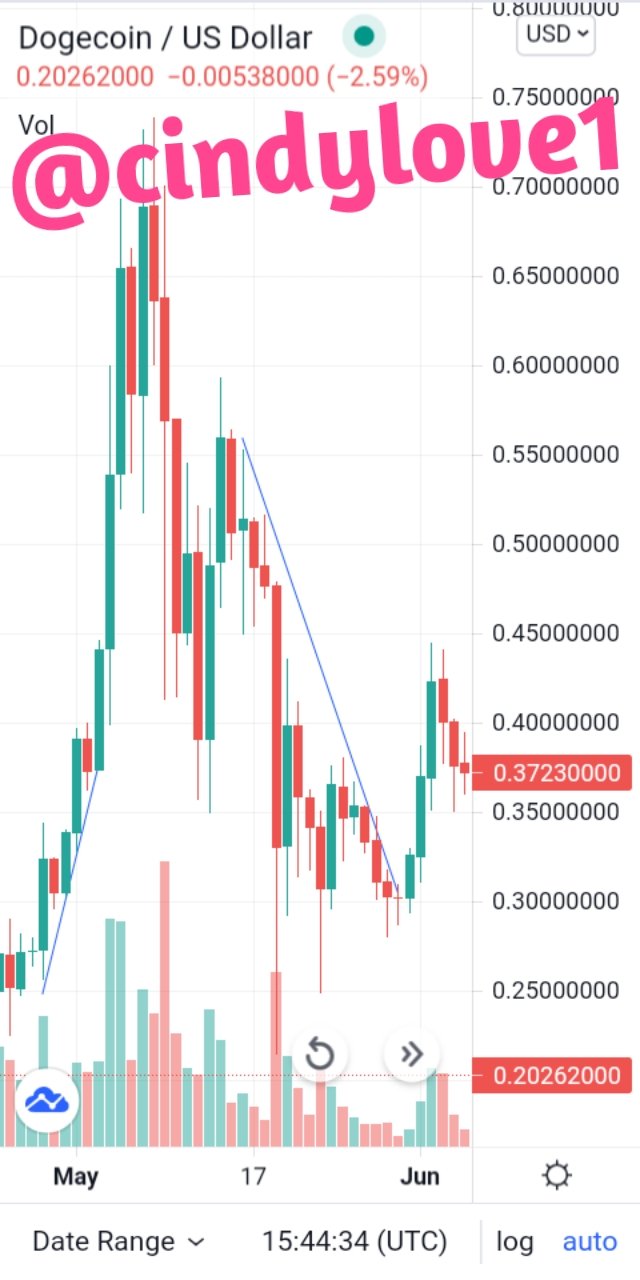
Locate a downtrend on any cryptocurrency asset candle chart, and connect the highs of the downtrend, using the trendline tool at the left hand corner.(using trading view)
Let's discuss a bit about the limitations of a trend line.
- Since it is based on technical analysis, it does not account for events like a pandemic or a real life retracted investment and so it can the trader can be completely caught off guard.
- It needs to be updated regularly as the trendlines can become inefficient with time due to sharp price changes or trend reversals.
Support and resistance zones
Support and resistance zones are used as guides that help a trader to plan when to buy and when to sell, these levels are not just selected but are set based on the previous behavior of the market. Generally the support level is set at the low of lows(lowest price) at some certain time frame ,and the resistance level is set at a previous high .
RESISTANCE:
This is the zone whereby the price of a token is expected to reverse or a trend reversal is expected after a protracted bullish run. A resistance zone is usually set at a previous high.
A careful attention to the charts will help the trader know when to sell his or her positions . It is advisable not to sell all ones positions because there is a chance the resistance level is broken and more bullish trends continue.
SUPPORT
This is the level whereby a bullish trend is anticipated after a long or sharp bearish trend. The support zone is usually at the base of such steep bearish trends.
A support zone is the best point to buy more positions or an entry point into a market. This zone helps the trader to have a concise plan as to how he or she will make transactions to maximize profits.
Some chart patterns
There are some models that cryptocurrency assets follow, although it is not always true, it has help in making the cryptocurrency market quite regular. Bellow are some of these chart patterns.
1) Elliot wave theory
The Elliott theory can be used to spot bullish and bearish trends in the cryptocurrency market by first observing the trends and comparing it to Elliots model . The Elliot wave theory makes it easy for a trader to know when to enter into a market( purchase coins) and when to exit the market( sell his coins) so as to make profit and avoid unnecessary losses.
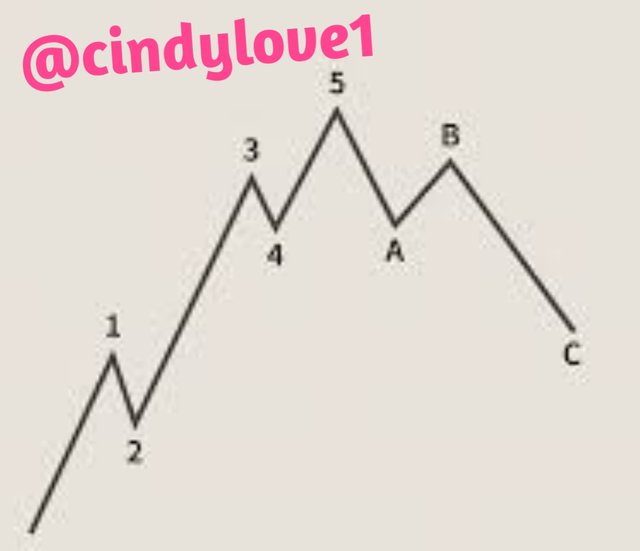
What is Elliott's model?
From the wave chart above ; a wave for a bullish trend, it can be seen that once an Elliot wave is spotted to have the above features. The Elliott theory classified the waves and gave then numbers ranging from 1 to 5 and also another group of waves that he represented using the alphabets a , b and c.
The Elliott theory classifies those trends that go with the trend( uptrend) , that is, the first five waves , as impulse ways and the last three waves , the ones that go against the uptrend as corrective waves.
On being more specific, of the first five waves in a bullish trend, Only wave 1 and 3 and 5 are actually impulse waves and the two waves in between are known as correction waves albeit to a small degree.Wave 2 corrects wave 1 and wave 4 corects wave 3. After wave 5 the next corrective wave tends to fall below the previous corrective waves( wave 2 and wave 4) and that is because it is not just correcting wave 5 but it is correcting the whole of the first five waves.
So after the first wave, there is a price reduction( probably due to investors selling their coins ) and then some other traders jump in the wagon and a price increase follows at wave 3 ; which is longer than the previous price increase, after which there is a price reduction , and a short lived price increase at wave 5 and that is followed by a long price fall and the second phase of the Elliott cycle begins and this is a bearish trend and also in this phase, any wave that follows the downtrend is an impulse wave and any trent that goes up or distorts this impulse wave is a correction wave and both phases make a cycle.
2)Double tops and bottoms :
This is another trend pattern that can be used to spot a trend reversal . A careful observation of a cryptocurrency chart will at some point reveal a model, but the main task is locating the model.
A double top tells a trader that a bearish trend is very likely to follow , so a trader sells his positions to avoid losses, but just like my personal model, one shouldn't sell all of his or her positions as the model may be broken and more bullish trend may follow.
A double button on the other hand tells a trader that a bullish trend is expected to follow and so a trader sets his or her support levels at this point and buy more coinsone needs to be careful here also and make sure the money invested is one which the trader can afford to loose ; as the cryptocurrency market is a very volatile one.