ANKR/USDT BUY&SELL S6T3- TEAM TRADING POST FOR FREDQUANTUM-KOUBA01 BY@CINNYMARTINS

The name and introduction of the project token, and which exchange can be traded on, project/technical/team background, etc.
For this operation, I choose to work with ANKR as one of the projects built on Polkadot.
Just like every other coin being a native token of another network
ANKR is also a native token built on the ANKR network. More to this is the fact that ANKR is a DeFi platform on the polkadot Blockchain. This means that the platform is Decentralised and provides its users with a level of convinience.
One of the relevance of the project is that it tends to build a resource efficient framework within the Blockchain as well as a user friendly infrastructure for businesses possibly because it is a web3 compatible API so that the ongoing barrier to business adoption is being addressed through a novel Blockchain solution hence, decentralizing the internet to accommodate as many users as possible relying on cloud computing resources.
Through this medium, delivery of service is facilitated through the internet with tools and applications like networking, servers, softwares, databases, storage etc.
So, rather than storing files on a local hard drive, cloud-based storage ensures those files are being stored in a remote database.
The ANKR project was launched in 2017 as a Blockchain-based DeFi infrastructure and web 3 platform that facilitates cross-chain Staking. The project was powered by ETH-based token and its main aim is to furnish easy access to webs and also increase efficiency in the Blockchain Blockchain foundation.
Host of businesses around the globe are using cloud computing to increase deployment and maximize efficiency. ANKR is also a good computing platform gagded by the Blockchain. It is existence of the Blockchain that adds increased velocity, more inclusivity and transparency to the system.
The ANKR team believes that idle computing power can replace cloud service providers (CSPs) like IBM cloud, Microsoft Azure, Amazon's AWS. So, facilitating this idea, they went further to create a system where businesses and people worldwide can utilize idle computing power of others. Beyond this, ANKR went as far as providing an underlying base to power the internet of things as well as more emerging economies.
ANKR is also a gateway to web-3 infrastructureand this come this seen with the increased speed at which consumers, businesses and developers are connected to the Internet.
One of the difficulties associated with a node is that it requires a high level of skill to run it but the ANKR platform solved this by allowing other entities lend their computing resources to ANKR and they (ANKR) in turn provide these resources to parties who wish to operate a node. Afterwards, those who lend their computing resources are rewarded through the ANKR platform.
ANKR has so many plans and projects to be taken up in the nearest future and few of the associated projects are:
Making nodes available and staking more accessible: Due to high entry barriers, staking nodes are not always accessible for regular users. So, ANKR has therefore included in their mission to terminate those technical entry barriers by building easy node deployment applications which will enable even nin technical users to run any node of their choice. So, one of the intended projects of the platform is to deliver best experience for stalkers as well as provide API services for developers.
Integrate more DeFi products: The network seeks to boost their ecosystem by collaborating more with projects that complete their ecosystem with their DeFi services. And many more.
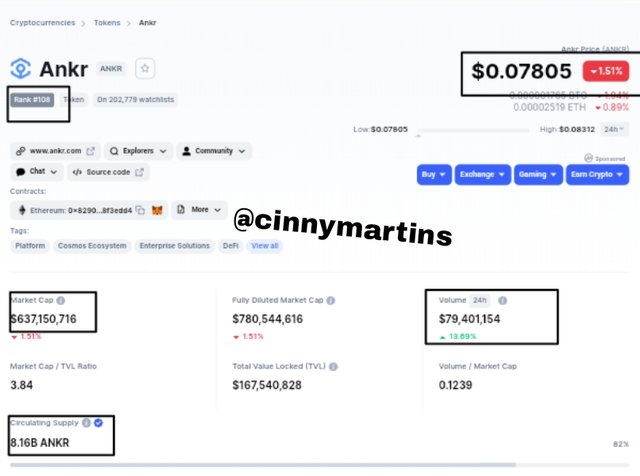
As at the day of writing, ANKR has the following details on coinmarketcap:
Ranking -108
Market cap - $637,150,716
Circulating supply - 8.16B
Price - $0.07805
Volume - $79,401,154.
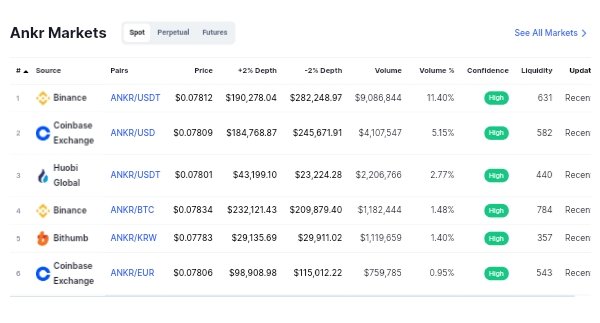
Exchanges it can be traded
ANKR/USDT can be traded on the following Exchanges:
- Binance
- Coinbase Exchange
- Huobi Global
- Bithumb etc.
Why are you optimistic about this token today, and how long do you think it can rise?
I am very much optimistic about this token because based on the analysis I carried out today, the token has been on the bullish end breaking the resistance after a long bearish move and constant fluctuations in its price. Early this year, ANKr token has met the support line and has left a lot of traders with huge loss but has recently had an upward resonate In price which indicates that buyers are on their toes in the market and accumulating more of this token which is aiding the Higher high series on its price chart.
However, I don't believe the rise will stand the test of time before sellers will take back the lead and enormous distribution of the token will commence. On that note, the rise in the price of ANKR will not last long.
How to analyze the token? (using the analysis knowledge learned from professors’ courses) - the most important part.
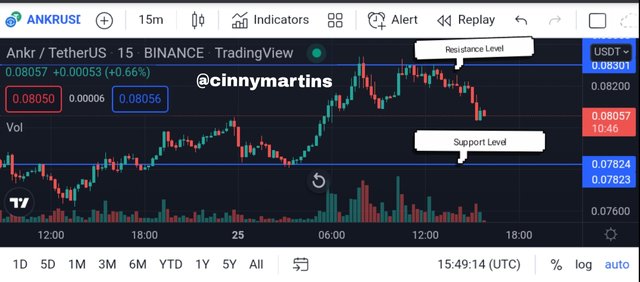
For this task, having chosen ANKR/USDT as pair, I will be analyzing the pair using Tradingview platform and then carry out the live trade using Binance Exchange.
For the analysis, I was able to spot the resistance line at $0.08301 and the support line at $0.07824 in a line chart of 15mins time frame with the current price at $0.08057 which is a little below the resistance line. What this connote is that few minutes ago before I entered my trade the pair ANKR/USDT which is its peak and started sloping down as can be seen in the image below.
For the second arm of the analysis, I used the A/D indicator and the RSI. First of all, I would like to explain the effect of each these indicators.
A/D Indicators
This type of indicator is mainly used to indicate when an asset is in its distribution phase or its accumulation phase. The Accumulation phase is a phase when investors are accumulating the assets to continue a progressive increase in price to generate an uptrend while the Distribution phase is when investor decides to sell off their assets to take profits.
Meanwhile, the A/D indicator is also called volume -based indicator and this is owing to the fact the indicator and the price moves in tandem positions but there could be instance where the price is trending up and the indicator will take an opposite direction. This does not mean that neither the signal of the price nor indicator is erroneous rather it means that there is no much volume for price increase and this signifies a weakness in trend and simply means that the trend will not last long.
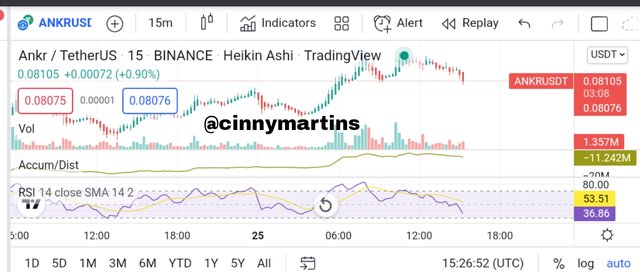
From the chart above, we see the A/D Indicator taking a similar move with the price of ANKR/USDT. At the entry point, the indicator was already taking a downward move just as the price chart.
RSI Indicator
RSI is technical indicator employed to carry out analysis in financial markets. This indicator is basically used to display the current and historical strength of an asset on the chart by relying on the closing price of the asset for a particular period of time. With this indicator, traders can easily ascertain the peak of recent price changes so as to evaluate the overbought and oversold region of an asset.
The RSI indicator is ranged from 0-100. And according to traditional usage of RSI, the range of 70 and above suggests that an asset Is becoming overbought hence, an indication of a price reversal while RSI ranging from 30 downward is an indication that an asset is becoming oversold. In other words, whenever the RSI indicator surpasses the horizontal line range of 30, it signifies a bullish trend but when it is below the horizontal range of 70, it indicate a bearish sign.
The price trend and the RSI indicator is partially related in the sense that whenever the price trend downwards, the RSI hits the oversold region and it is at this point that investors tend to acquire as many asset as possible in anticipation of a possible price reversal towards the bullish end.
Here, the RSI Indicator was at 36% which indicates an oversold and is moving towards the same direction as the price chart too. All these analysis points to the decrease in the price of ANKR.
Live trade.
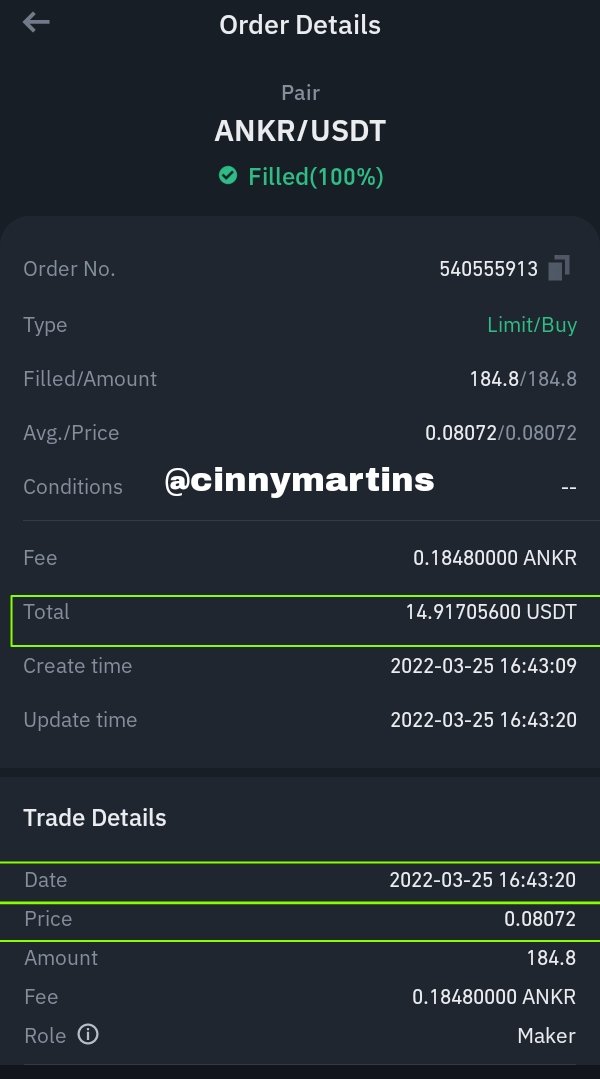
I carried out my live trade using Binance Exchange and spot market trade where I entered the market and bought with $14.9170 at the price of $0.08072 as seen in the image below.
Not quite long after I made the purchase, I set the asset to execute sale at the price of $0.08088 and had the return of $14.9304.
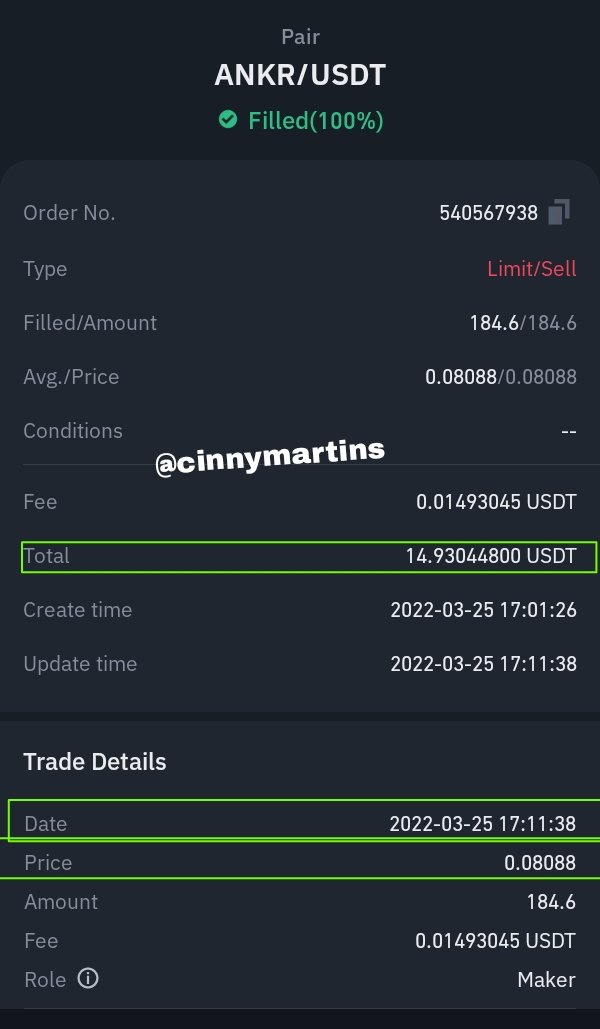
At the end of my trade, I was able to make a profit of $0.0134.
Do you intend to keep it for a long time or when to sell it?
My only plan with this token is to trade and take my profit before daybreak as I don't believe in keeping this token for a very long time.
Do you recommend everyone to buy? and the reasons for recommending/not recommending.
Anyways, for now I can't give any recommendation to buy this now rather to sell the coin because considering the recent surge in price, I suppose it is gravitating to the support line and all holder seek at this point is the slightest opportunity to distribute the coin.
Conclusion
This is my second post for the week and in a nutshell, I was able to discuss extensively on ANKR token. After that, I analyzed it using Tradingview as well as carry a live trade on the pair and I finally have my opinion about keeping this token.
CC.
@kouba01
@fredquantum
Hello @cinnymartins,
Thank you for choosing our team to participate in the 3rd week of Season 6 of our trading competition, hoping that you will make gains during this period, you deserve a Total|6/10 rating, according to the following scale:
My Review on your choice of pair:
My Review on your trading style:
We thank you again for your effort and we look forward to reading your next article.
Sincerely, @kouba01