Crypto Academy Week 10 - Homework Post for @stream4u
Professor @stream4u posted a new lecture on Price Forecasting. As part of studying process, I want to submit my homework in this post.

Source
What Is Price Forecasting?
For me price forecasting is the way to stay calm on crypto market. My experience with crypto started in December 2017. Unfortunately, I knew nothing about price forecasting and lost most of my portfolio. Entering the market at the end of bullrun and seeing it crash into a crypto winter was a truly stressful experience. The only way to save yourself is to know when you should enter the market and when it is time to take profit. This is where price forecasting can bring back calmness to your life.
Why Price Forecasting is needed?
I am not a trader, I am an investor, but I still need price forecasting. First, we need to enter the market. We need price forecasting to find a good entry point. You should never underestimate the entry point importance. For example, you can buy a token at $1, then the price drops to $0.8. After some time the price goes to 5$. You get 5x boost of your investment. If you used price forecasting and entered the market at $0.8, you would get 6.25x to you initial investment. On a long run, even a small discount of 10-20% at entry point turns into significant profit.
Secondly, we need to take out initial investment. Crypto market is highly volatile and for many people to sleep well, you need to take out initial investment or at least part of it. In other words, you need to sell a part of your portfolio. You don’t want to sell your token in a local low when the price is at the support line. You don’t want to sell when the price is about to break through resistance. Price forecasting can help you to sell at a right time.
Finally, price forecasting can also help you to boost your portfolio along the way. Crypto market is highly volatile. You can use market volatility to increase your holding by catching market moves. You can sell at local high, wait for the price to drop to support level and buy back. However, even a practical experience in technical analysis doesn’t give you any guarantees.
My method of price prediction
I’m not good at technical analysis. This is why I like to combine it with what I call “checking market pulse”. For this I check several important charts.
Exchange flows
Source
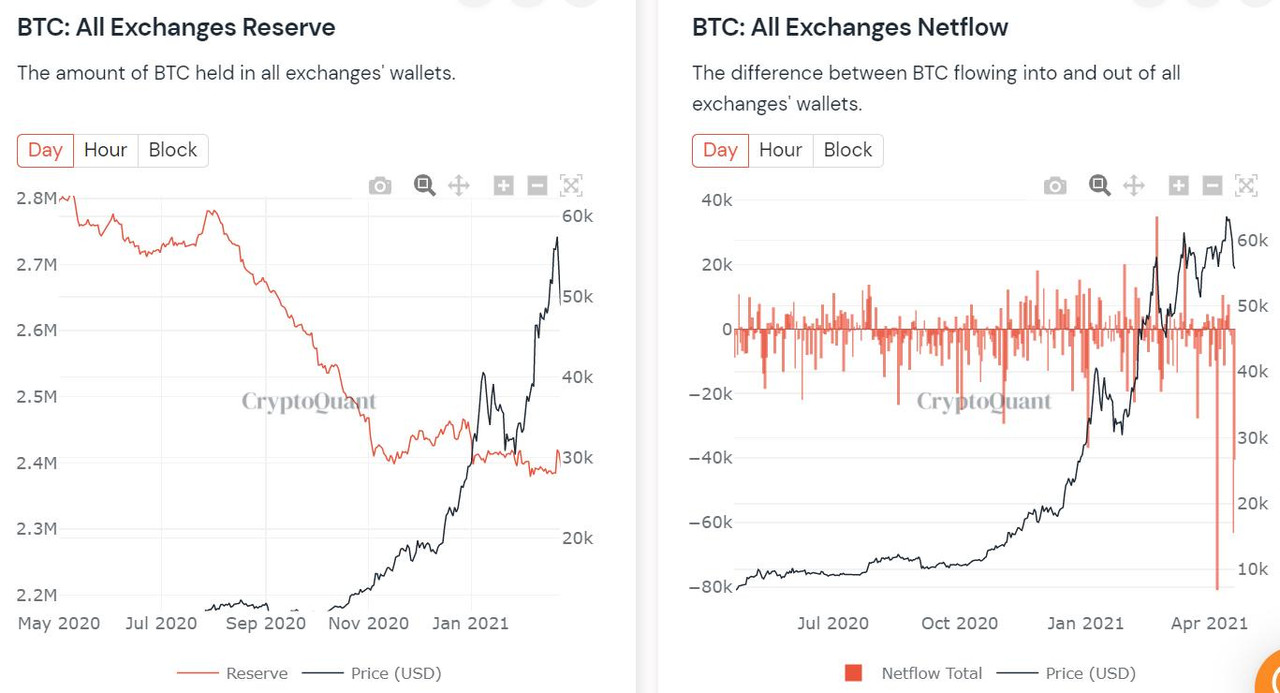
BTC market is still the supply vs demand game. If BTC is leaving exchanges, supply drops. BTC coins on cold storage do not participate in price discovery. When people move BTC to exchange, they do it to sell (as storing large amount of crypto on exchanges is discouraged – not your keys, not your crypto). Supply increases and price drops. You can easily check these trends for free on cryptoquant or glassnode. For now we clearly see the trend - BTC supply on exchanges is going down. This is a bullish sign for the market.
The second part of the game is demand. The biggest pair for BTC is USDT (and other stable coins). On the same sources you can check balance and netflows of stable coins for exchanges. When you see more stable coins sent to exchanges, the bigger demand will BTC and altcoins have.
Main actors of the market behavior
There are two main actor groups for BTC: miners and whales. Both groups have large holding of BTC and can cause a strong buying or selling pressure.
Source
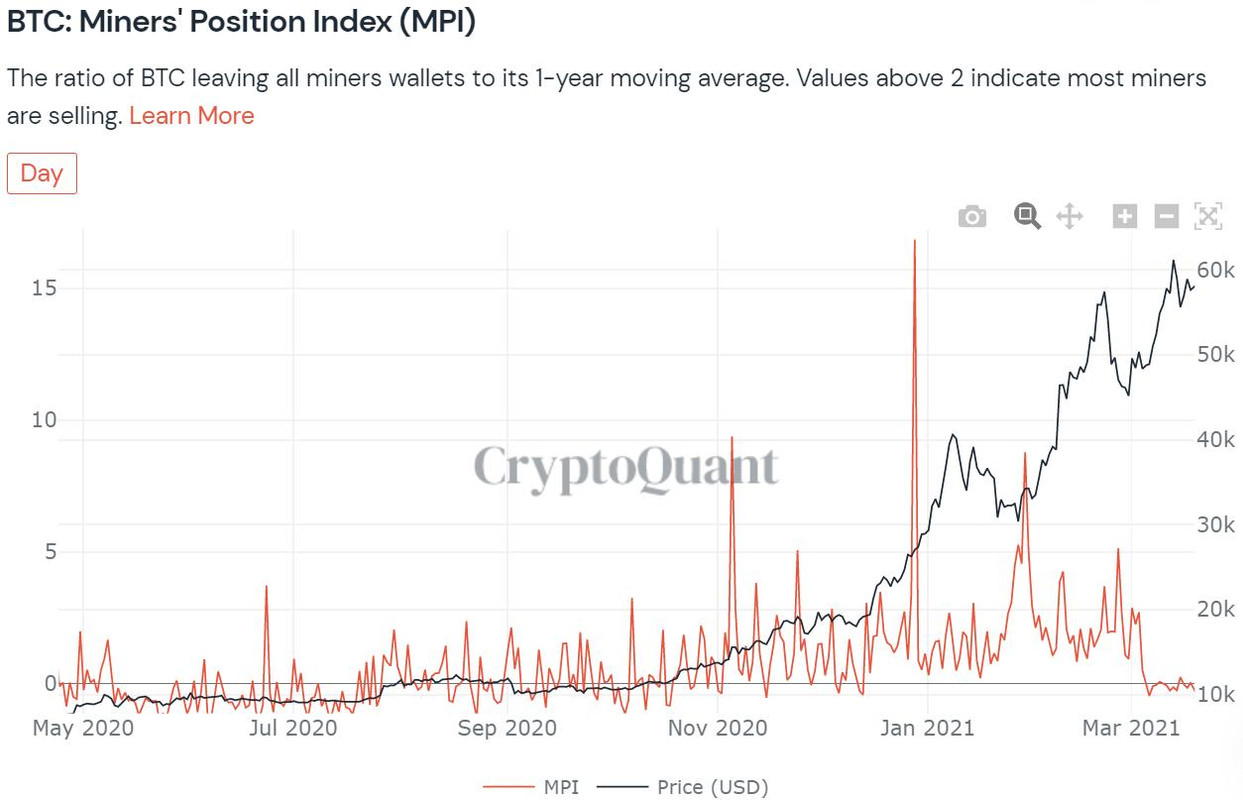
At this moment, Miners' Position Index shows they are accumulating BTC. Miners either expect price to go up or try to push the market to this direction. This is a bullish sign for the market. There are similar charts for large holders. You can track the dynamics for addresses holding large amounts of BTC/ETH. When their holding increases, “smart money” are buying. In other words they consider certain price low. If whales are selling, they drive the price down.
Warning: All the above indicators can be wrong sometimes. For example, large outflows of BTC on the chart above are partly caused by internal transactions on Binance exchange. They do not indicate BTC supply decreases. You always need to check data when you see any large spikes.
Example of price chart
Although the above indicator are helpful, you will still need to combine them with technical analysis. Let’s take a look at current BTC price chart on Binance exchange. I will use 4 hour candles.
Source
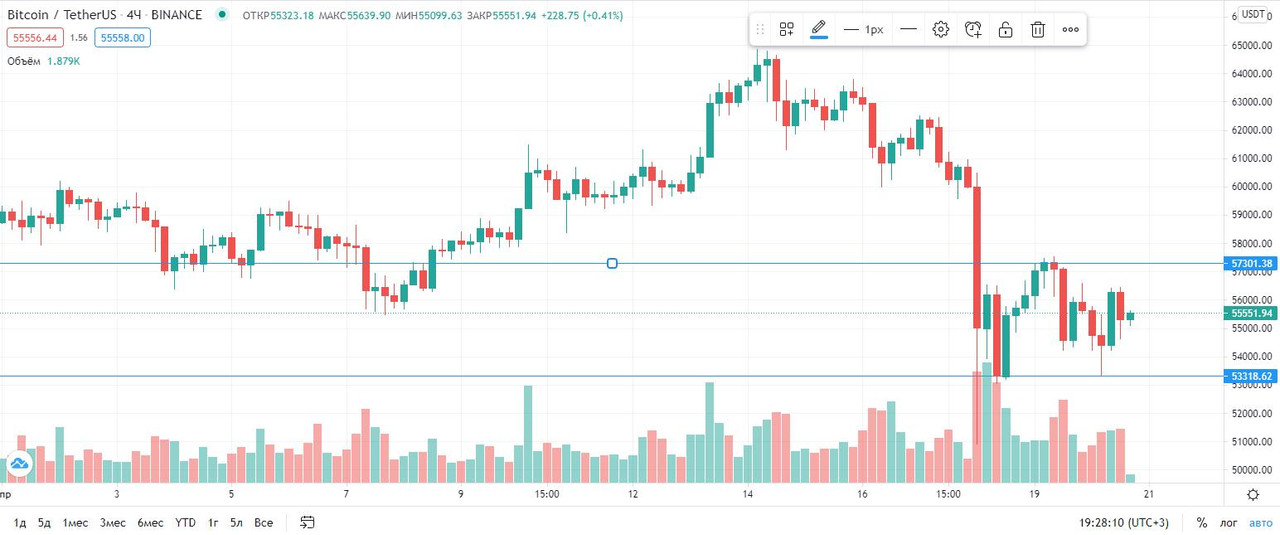
Based on indicators, we know that BTC supply is limited. Miners and large holders support the price by reducing sales. This make support lines stronger. I marked the current support line at $53 318. Indicators makes me think the support will hold. Price chart also backs this statement. The last full candle is red, but its shadow is almost the same size as candle itself. This is close to “umbrella” pattern and indicates the next candle will drive the price up.
I’ve marked the next resistance level at $57 301. As you can see, previously BTC wasn’t able to break through. Chart tells us we will try to retest it again. I will watch inflows of USDT in the next few hours. If I see some decent inflows, this would mean BTC can break through. From the chart, I’m not so sure. I can't tell if BTC gained enough strength yet.
Conclusion
Price forecasting improves your performance on the market and helps to sleep well at night. It is better to use additional indicators to help you with technical analysis.
Disclaimer
I’m not a financial of any kind. I encourage you to check all information yourself and make decision only based on your own opinion. All articles are created for solely entertainment purpose.
If you like this post please vote for it and follow my blog. Feel free to share your thoughts in comment section.
Hi @cryptohumster
Thank you for joining The Steemit Crypto Academy Courses and participated in the Week 10 Homework Task.
Your Week 10 Homework Task verification has been done by @Stream4u, hope you have enjoyed and learned something new.
Thank You.
@stream4u
Crypto Professors : Steemit Crypto Academy
Hi @Stream4u, thanks for the feedback. Can you explain a little bit on the copyright issue? I don't understand which one has issues.
In my article i have:
Update: Checked cryptoquant site for terms and it has the following rights granted to users:
Let us know if you still have concerns about this same so that I will surely get this rectify.
Yes, can you explain more? Why it is ok to use screenshot of chart from tradingview but not ok to use the same from cryptoqant or glassnode. The license on tradingview is similar to the one on cryptoqant. The is no copyright right violations in both.
Hi @cryptohumster,
Thank you for your patience. As I previously said, you might be right here, but the watermark on a picture is always perplexing. For now, I'm correcting my given review and grade.
Previous Grade: 6
New Grade: 7
To avoid such confusion in the future we strongly recommend to you use images, screen capture with no watermark.
Thank You.
@stream4u
Crypto Professors : Steemit Crypto Academy
Thanks for spending your time to review! I will use your advice not to use sites that set watermarks to avoid confusion.
I have not said that it is only ok to use a chart from tradingview.
As you said cryptoqant is not copyright, maybe you are right, I will get this check and get back to you.