Steemit Crypto Academy Season 4 Week 4 - Beginner's Course | Technical Indicators 2.- Homework post for @reminiscence
Hello everyone,
I can’t believe my eyes it’s already week four in the crypto academy season, time really flies. anyways thanks to professor @reminiscence for a the lecture On technical indicators. I’m here with solutions to the questions asked.

1 a) Explain Leading and Lagging indicators in detail. Also, give examples of each of them.
Leading indicators are the type of indicators that enable
traders to Forecast price motion in the markets prior to the actual movement of prices. These indicators foreshow /signal traders on price movements, this gives traders insights on upcoming price motions in the market so they know when to enter a trade or make an investment. This is to help reduce losses by notifying investors when there’s about to be a change in trend of the price movements.
In spite of how resourceful Leading indicators are there are also some setbacks with this indicators. although leading indicators help traders forecast price movements
and trade regions( overbought and oversold) . We usually experience a change(reversal) in trend when the market price are in either of the regions . Unfortunately in a powerful trending market reversal can be delayed and leading indicators become vulnerable thereby misleading traders. Leading indicators are prone to price manipulation So it’s always good to use Leading indicators with other technical analysis tools.
Examples
- Relative Strength Index (RSI)
- Donchian channels
- Stochastic Oscillator.
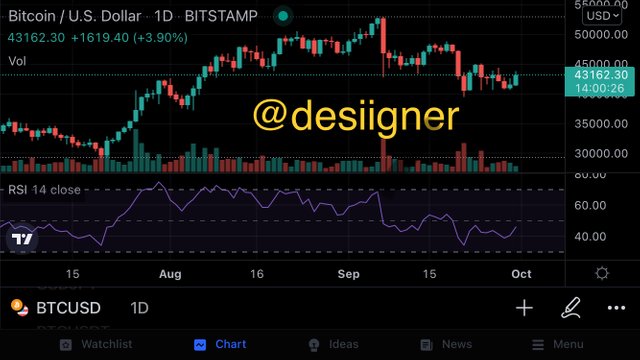
Example of a BTC/USD chart with the RSI indicator.

Just like their names , lagging indicators are quite the opposite of leading indicators. As the name suggests lagging indicators only informs traders about price movements when the movements has already begun. Lagging indicators basically stand by for the trend to begin before they signal the trader. Lagging indicators are well fit in a strong trending market as they let the trend begin before they make hay this makes them invulnerable to price manipulation.
Just like the Leading indicators the lagging indicators also have some weaknesses. As these indicators lag behind this deprives traders of some relevant market trends/ moves lagging indicators also have a wide stop-loss , lagging indicators can lead traders into a trap, because they lag behind they can make traders enter a market when the trend is frail and it can reverse at that point.
lagging indicators are usually utilized as confirmation tools in a strong trending market.
Examples
- Parabolic SAR.
- Moving Average convergence/divergence.
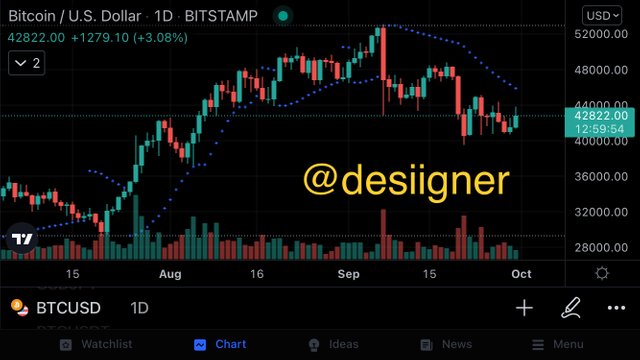
Example of a BTC/USD chart with Parabolic SAR.
b) With relevant screenshots from your chart, give a technical explanation of the market reaction on any of the examples given in question 1a. Do this for both leading and lagging indicators.
I’ll like to use the RSI to demonstrate for the leading indicators.
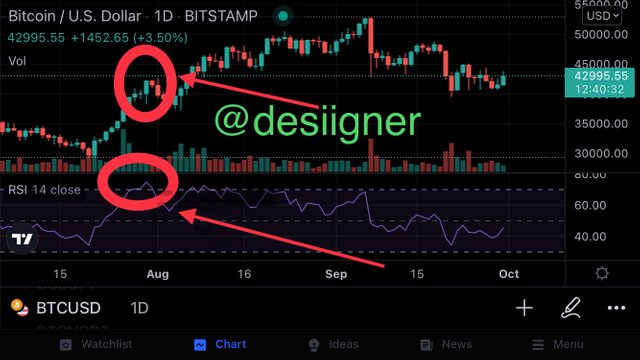
From above you’ll notice that the stock got to the over bought region that’s above 70 on the RSI chart and you can see the price was really overbought looking at the chart itself and you can see that there you can see that there’s an immediate initiation of reversal of trend . This approves the role of the leading indicators as it predicts price movements before it begins.
I’ll like to use Parabolic SAR to demonstrate for lagging indicators.
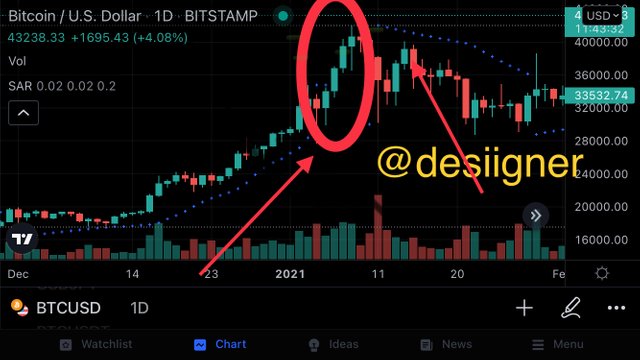
You can see from above the circled part there was a trend reversal but it the Parabolic SAR didn’t indicate that till it went further you can see the arrow at the far right.the lagging indicators gives traders signal after initiation of trend movements.

a) What are the factors to consider when using an indicator?
Knowing the market trend: it is very important to know whether a particular market is a trending or ranging one so as to use the right indicators to use either trend based indicators for trending markets , or use Volatility based indicators and Momentum based indicators for a ranging market. It’s good to understand the trend the market is following to identify the overbought and oversold regions so as to make good trading decisions.
Being familiar with the types of indicators: it is good to understand and know the role of an indicator before using it. It’s important to take into consideration the type of indicators you choose and how they work. As we have leading and lagging indicators , you need to know the significance of each and know when and which of them to use and also considering their weaknesses. This will help you the trader to be cautious with market trends.
Understanding The Trading Strategy you choose:
this self explanatory but let me demystify for better understanding. This simply means selecting the right technical analysis tools for your trading style. It’s is good to know which indicators well fits your trading strategy. this is the most important factor she selecting an indicator.Finding Confluence: there’s a saying, two good heads are better than one. It’s necessary to use other technical analysis tools in conjunction with the indicator
For analysis. If the indicator generates a signal we’re supposed to use a different analysis tool to confirm if it also generates the same signal before approving that indicator.

b) Explain confluence in cryptocurrency trading. Pick a cryptocurrency pair of your choice and analyze the crypto pair using a confluence of any technical indicator and other technical analysis tools. (Screenshot of your chart is required ).
Confluence in crypto currency trading is a situation where same results / signal is obtained when two or more indicators are applied to a chart. confluence is when two or more indicators shows overbought and oversold regions same as each other. This is one of the factors to consider when selecting an indicator.
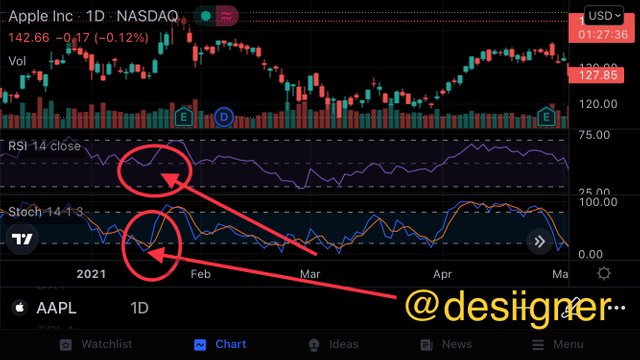
Below is a chart with RSI and Stochastic showing the same results of an oversold region of the chart.

a) Explain how you can filter false signals from an indicator.
False Signal refers to a situation where the price action
Doesn’t tally with the signal from the indicator. Let’s take it that a price is at an oversold region and is expected to reverse but it’s a strong trending market and the indicator
signals that the price has reversed this case is called false signal. Basically false signal is when an indicator gives a signal that doesn’t correspond to the price movements.
To filter a false signal, a trader has to check to see if the signal the indicator gives correspond to the price movements, Another way to filter false signal is confluence (using two or more indicators to confirm the market trend).

b) Explain your understanding of divergences and how they can help in making a good trading decision.
Divergence is an action taken to filter a false signal from a technical indicator. For instance if a stock price is in an overbought region and it’s supposed to reverse but hasn’t reverses and the indicator shows that it has reversed we say that the indicator has given a false signal .Divergence is when the price of stock moves in a direction contrary to the The direction of the indicator. Divergence is therefore very resourceful in making good decisions in trading, As they can detect price reversal at the early phase. Divergence gives traders insights on when to enter and when to exit a trade. When there’s a bearish divergence meaning an indicator signals a lower low formation but the price movement shows otherwise it. the lower low formation indicates that there’s an expected reversal in trend so a reader is supposed to exit the trade . But in a Bullish divergence the price trend shows a lower low formation and the indicator shows the opposite then there’s an expected reversal from down to uptrend the trader is supposed to enter a trade.

c) Using relevant screenshots and an indicator of your choice, explain bullish and bearish divergences on any cryptocurrency pair.
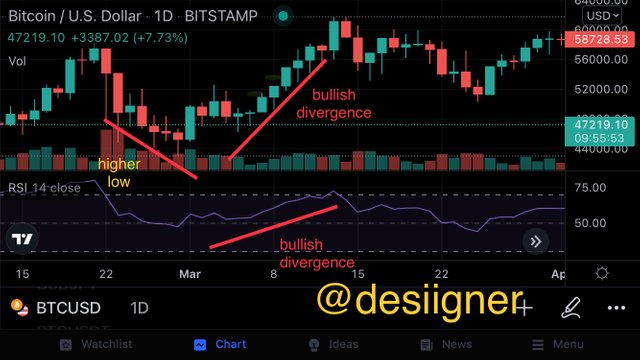
Bullish Divergence is a situation where an indicator shows lower high formation thus an Uptrend but the price movements shows a lower low formation thus a downtrend, this implies that there’s an expected reversal from downtrend to uptrend. Bullish Divergence basically signifies a reversal of prices movements from downwards movement to upward movement . In this case it signals the trader to enter a trade and gain profit.
An example is shown in the chart below.
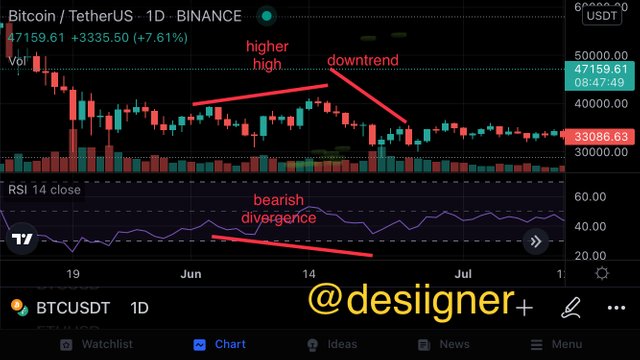
Thai is situation where an indicator shows a lower low formation thus a downtrend trend but the price actions shows a higher high formation. The lower low formation indicators shows that there’s an expected reversal from bull to bearish trend. This signals a trader to exit a trade to minimize / avoid loss.
An example is shown in the chart below

Thanks to professor @reminiscence for the lecture, with his help I now have much knowledge on indicators and how to use indicators for analysis.
I wish I have covered all questions asked and I’ll be looking forward to seeing my work reviewed.