[ROC indicator]- Crypto Academy /S4W8-Homework Post for kouba01

ENTIRE QUESTION
1.In your own words, give an explanation of the ROC indicator with an example of how to calculate its value?And comment on the result obtained.
2.Demonstrate how to add the indicator to the chart on a platform other than the tradingview, highlighting how to modify the settings of the period(best setting).(screenshot required)
3.What is the ROC trend confirmation strategy? And what are the signals that detect a trend reversal? (Screenshot required)
4.What is the indicator’s role in determining buy and sell decicions and identifying signals of overbought and oversold؟(screenshot required)
5.How to trade with divergence between the ROC and the price line? Does this trading strategy produce false signals?(screenshot required)
6.How to Identify and Confirm Breakouts using ROC indicator?(screenshot required)
7.Review the chart of any crypto pair and present the various signals giving by ROC trading strategy. (Screenshot required)
8. Conclusion:

1.In your own words, give an explanation of the ROC indicator with an example of how to calculate its value?And comment on the result obtained
ROC indicator by its name is Rate Of Exchange Indicator. It is also known as a pure momentum oscillator. It measures the change in percentage of price within a certain period of time. The calculation of ROC compares the current price and the price of some number of periods ago. As mentioned above this is a momentum oscillator in which signals include crossovers, divergences, and oversold/overbought signals. The plot will create an oscillator that moves from zero than above and below making the positive and negative signals.
There is a formula to calculate the indicator readings.
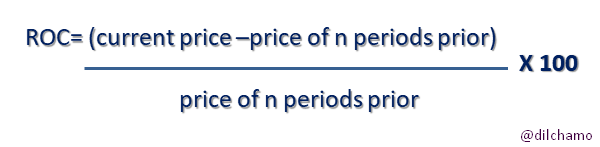
Image made by me in MS PowerpointHere we have to take the current closing price, the closing price of n periods ago. To calculate the ROC we need to subtract the current closing price from the closing price of n periods ago then divide that by the price of n periods ago. Then to have the answer in percentage value we need to multiply the answer by 100.
Let us take one example:
I got a daily chart here using the ADA/USDT cryptocurrency pair.
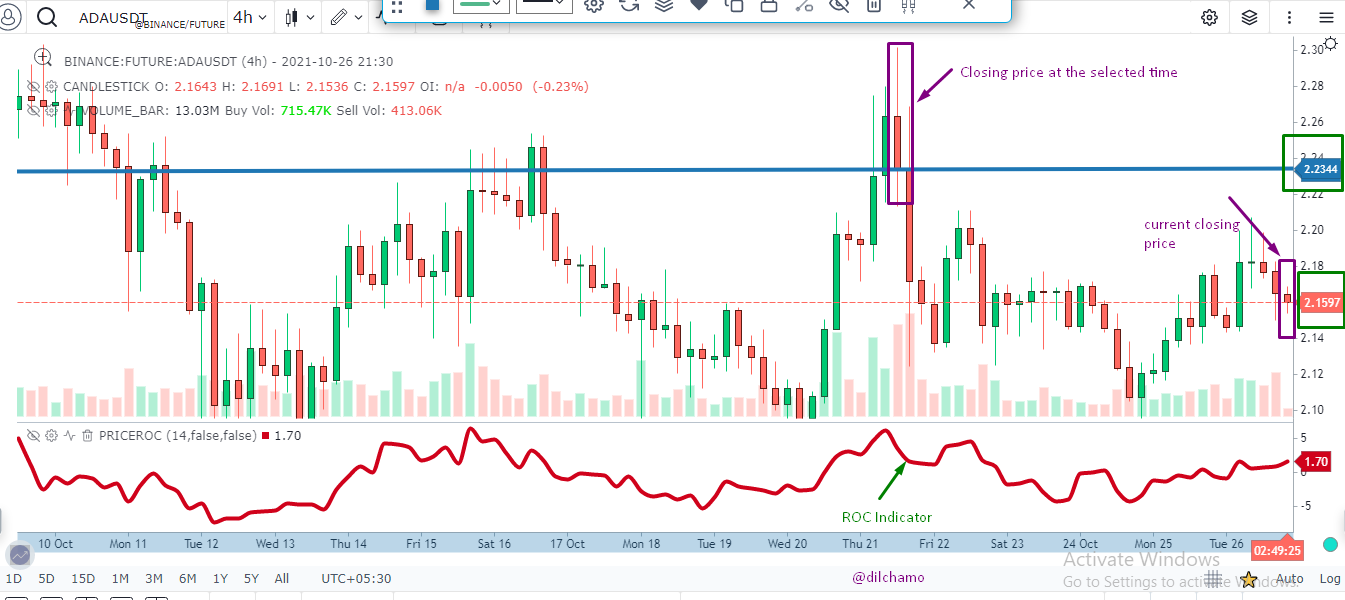
Image taken fromGocharting.com
In the above chart the details are as follows:
- Current closing price: $ 2.1597
- Closing price of n periods ago: $ 2.2344
Now I’m going to apply the formula for the details I got from the chart.
Image created by me in MS PowerpointROC= (2.1597-2.2344) / 2.2344 X 100
= -0.07/2.2344
= -0.0334
= -0.0334 x 100
= -3.34%
The answer is -3.3% which is not good news for sellers. The price of asset is high earlier than now. So earlier it was favorable than now.
2.Demonstrate how to add the indicator to the chart on a platform other than the tradingview, highlighting how to modify the settings of the period(best setting)
To add the indicator to the chart I’m using the Gocharting.com site. I first to go the website. And below is how the interface looks like.
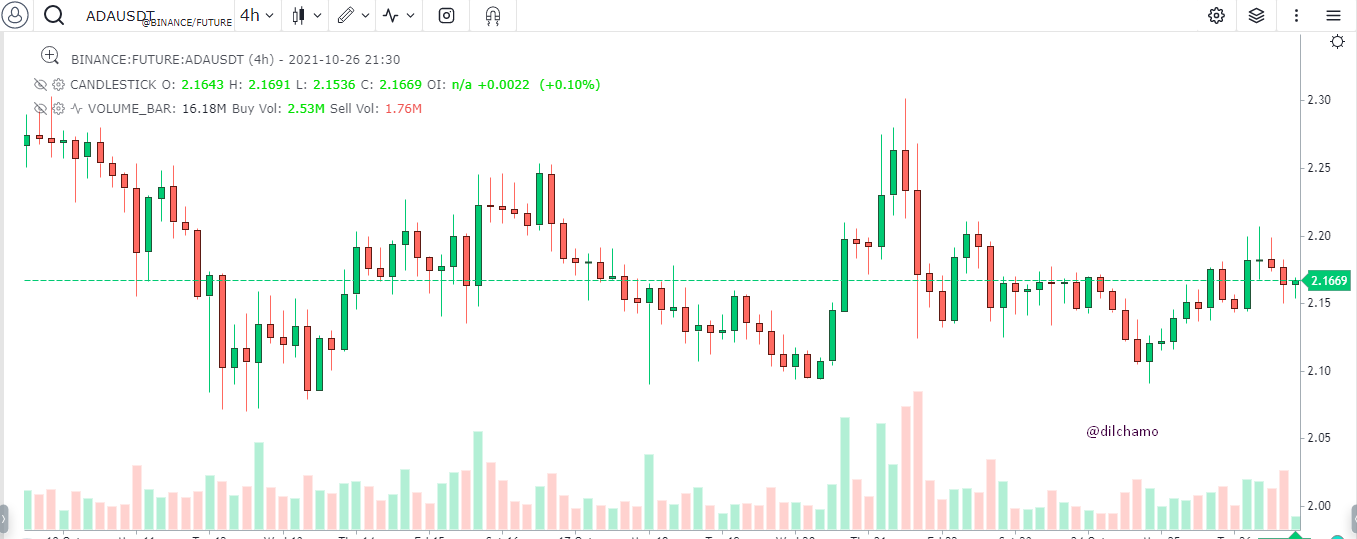
Image taken fromGocharting.com
Then I click on the Indicators button and search the ROC indicator and then I click on ”Price ROC”.
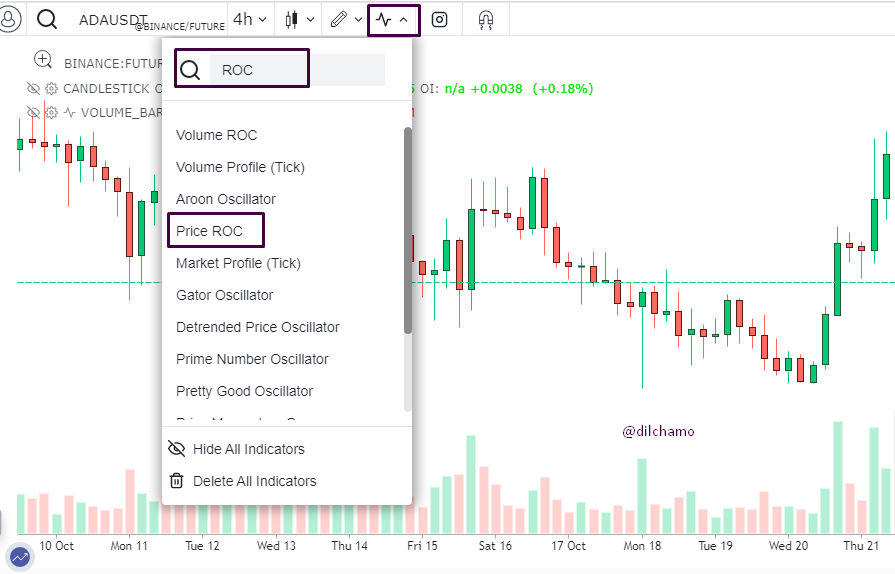
Image taken fromGocharting.com
Then we can see the ROC indicator bottom of the price chart. We can customize and change the appearance of the chart. So I too changed the thin line into a thick clear line.
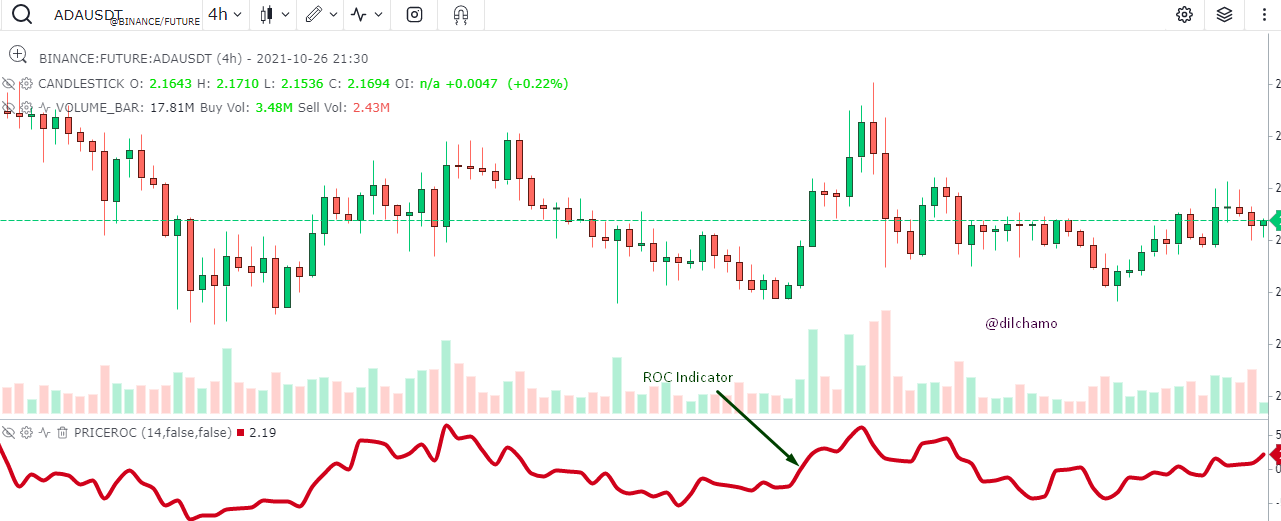
Image taken fromGocharting.com
To change the settings of the indicator we can click on the settigs button in the indicator and then we can see a dialog box as shown in the image below.
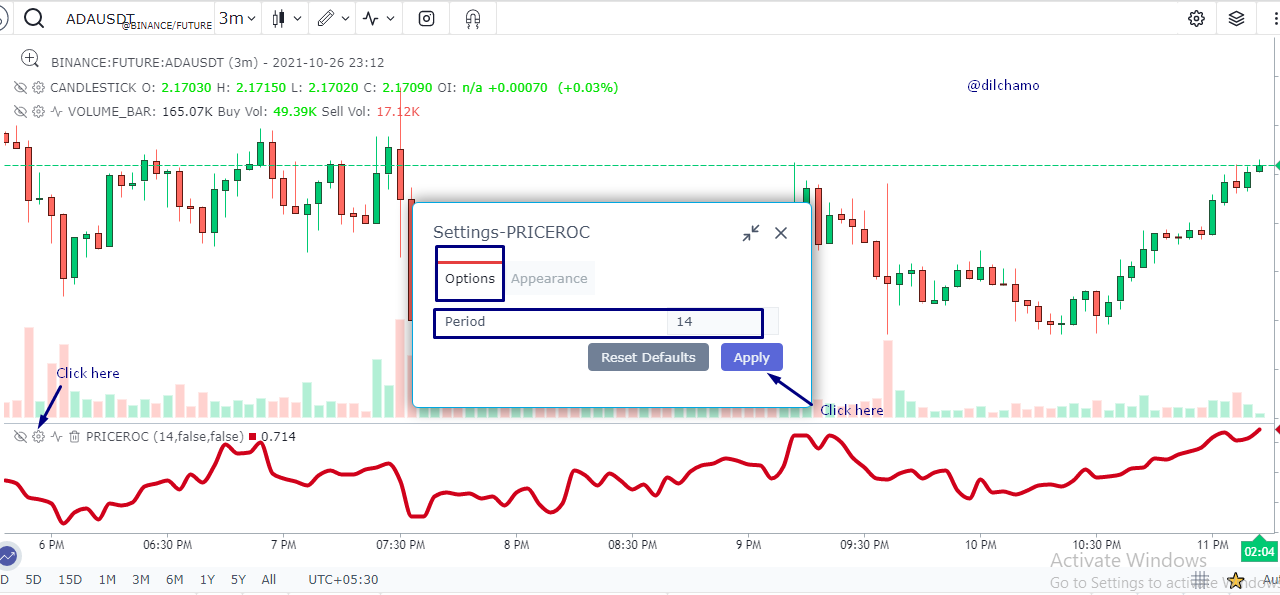
Image taken fromGocharting.com
The default period is 14. But long term traders can select longer time periods and short term traders can select shorter periods. Their decision making differs according to that.
The appearance of the indicator can also be changed by clicking on the appearance tag in the same dialog box. We can change the color and the width of the indicator to make it more visible.
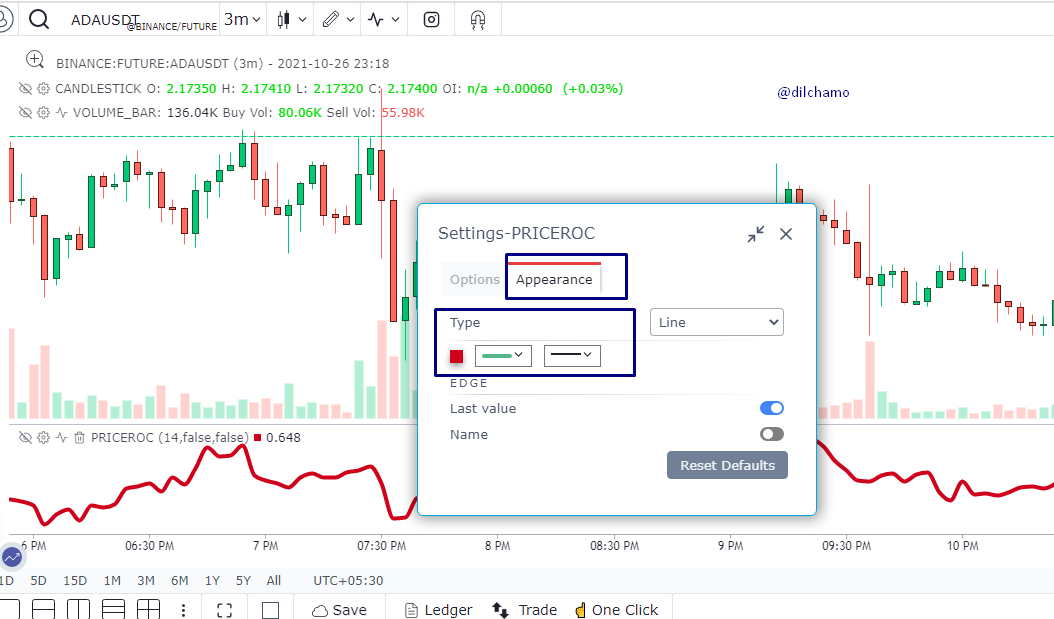
Image taken fromGocharting.com
3.What is the ROC trend confirmation strategy? And what are the signals that detect a trend reversal
Momentum oscillator is good for trading ranges. They are also used to determine the current price trend. A trend reversal as we all know starts from the shortest time period and it systematically expands to other time frames. Normally long term trend will be up when the long term time frame ROC is positive. This determines that the price is higher at the very moment that it was some months ago. Probably this would be 12 – 6 months. The long positions which were taken that much of months ago will be profitable for buyers.
ROC determines trend confirmation. As we can observe in the screenshot below
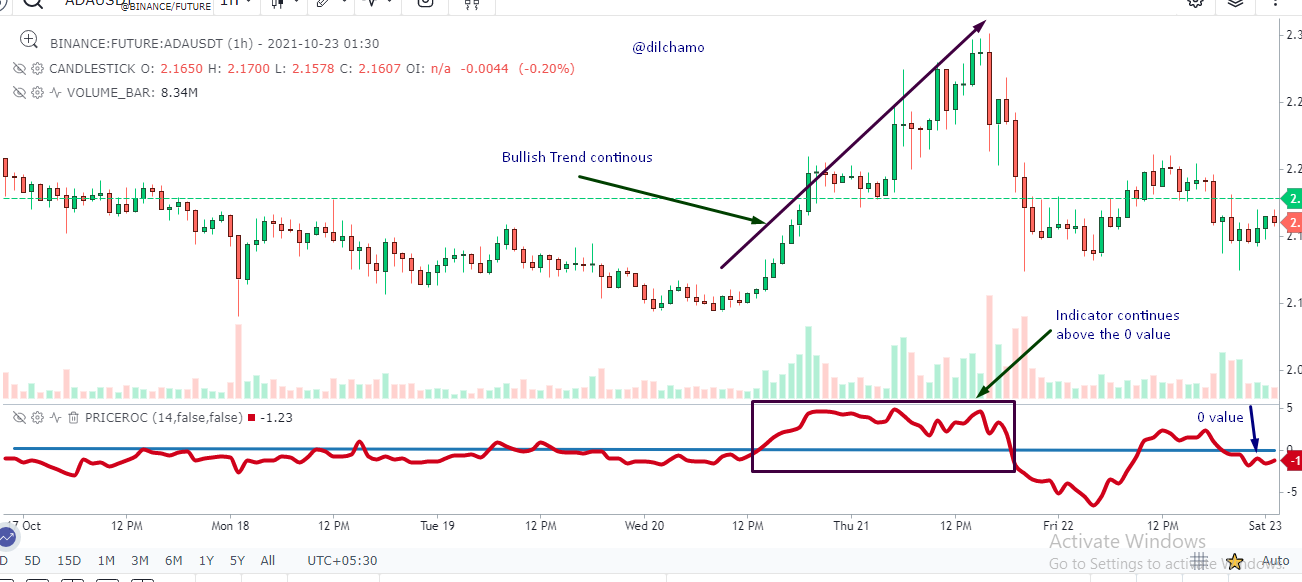
Image taken fromGocharting.com
4.What is the indicator’s role in determining buy and sell decisions and identifying signals of overbought and oversold
There are three basic price movements as upward, downward, and sideways. It is easy to identify the extreme and forecast turning points as the ROC is suited for sideways price movements with regular fluctuations. When the asset is trending the price tends to fluctuate. As an example, we can think of a downtrend. In a downtrend, there are lower high and lower lows that have a low zigzag movement. In an uptrend, there are higher highs and higher lows by occurring a high zigzag.
Percentage moves lead to occur peaks and pullbacks at regular intervals. ROC indicator can be used to identify time periods when the percentage change near a level of a turning point in the past.
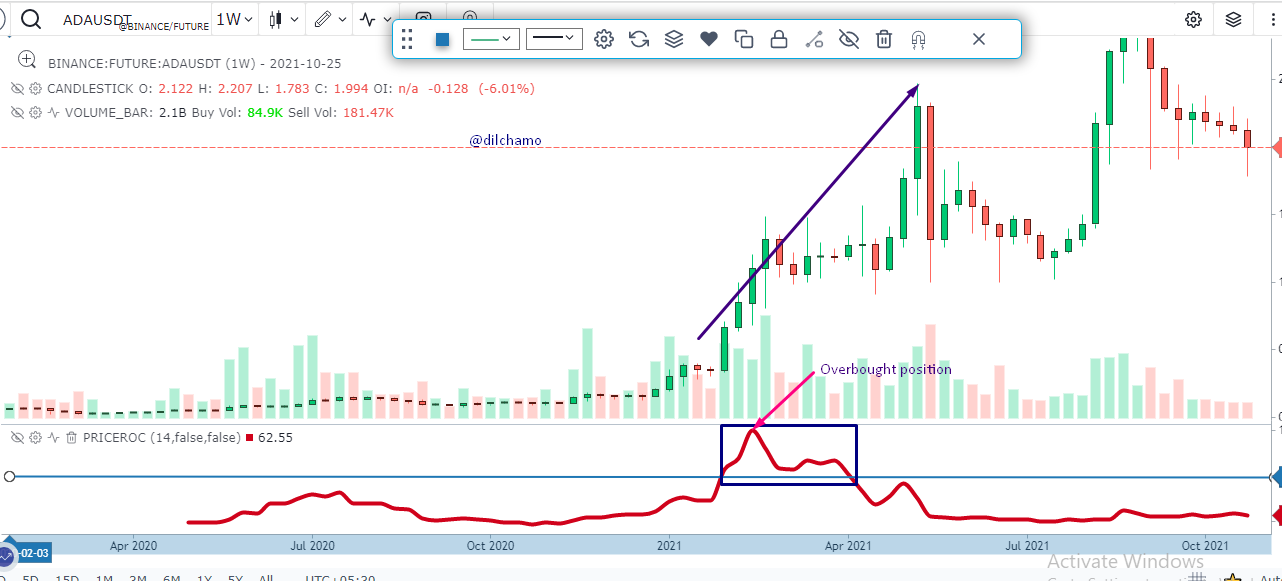
Image taken fromGocharting.com
The above screenshot of ADA/USDT cryptocurrency pair demonstrates an overbought signal. When I draw the trendline the ROC indicator shows an uptrend of the asset. The ROC indicator moves above the +4 level and also and the candlestick chart also shows a continuous upward movement of price with fluctuations. There we can see higher highs and higher lows. An overbought position is also identified. The sell decision is taken here.
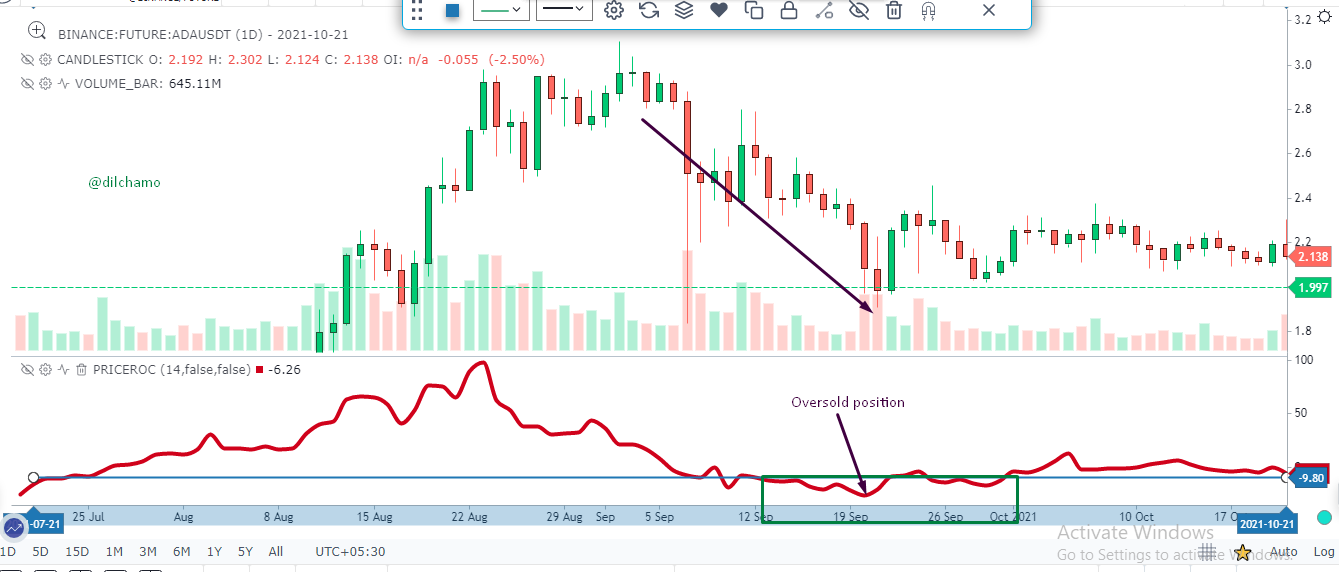
Image taken fromGocharting.com
From July to October, the asset shows a downward trend and it is a continuous downward trend. The ROC indicator runs below the -4 level pointing out oversold positions. The above screenshot shows a downward trend and the ROC indicator clearly identifies the trend which we can determine from the chart as well. There are lower lows and lower highs as it is a continuous downtrend. The buy decision is taken here.
5.How to trade with divergence between the ROC and the price line? Does this trading strategy produce false signals
ROC indicator can be used as a divergence indicator which has the ability to signal the upcoming trend. To identify the divergence accurately we need to focus on it in the exact method. When the asset price is moving to a direction the ROC is moving to the opposite direction and it creates a divergence. This is also a common usage of ROC indicator. If the asset price rises up the ROC indicator moves down and if the asset price moves down the ROC indicator moves upward. This is simply known as identify divergence using ROC indicator.
We can identify the divergence in two ways as Bullish divergence and Bearish divergence. Let’s see how to identify the asset price divergences using ROC indicator signals.
Bearish Divergence
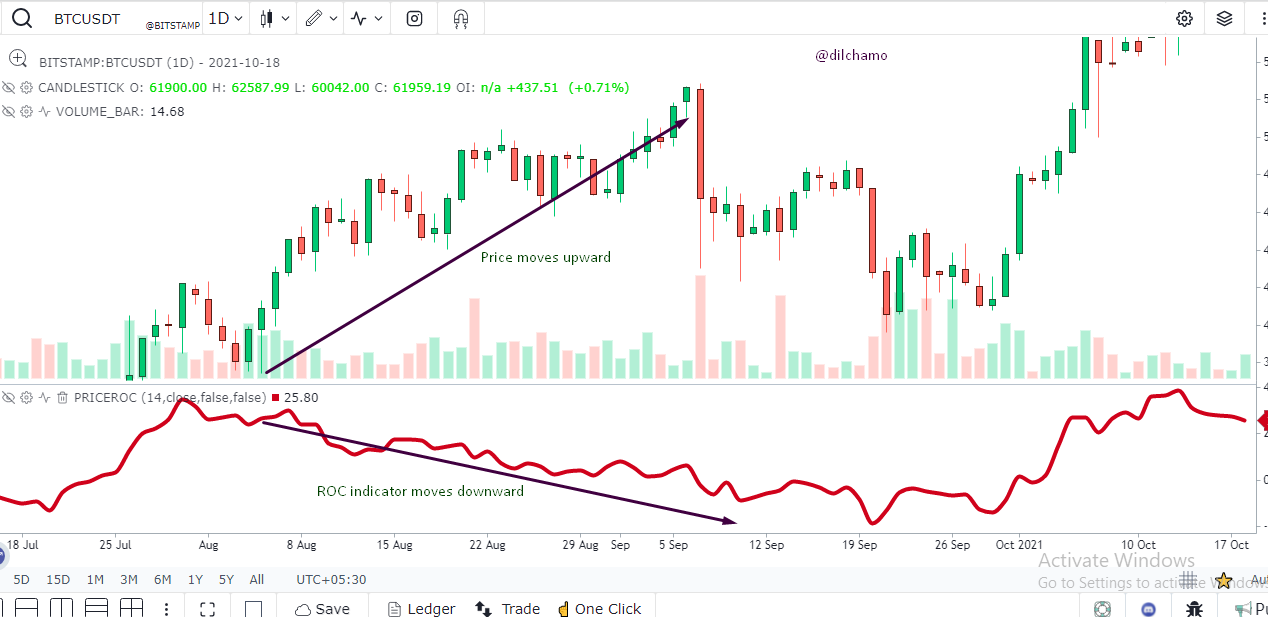
Image taken fromGocharting.com
I have selected the BTC/USDT crptocurrancy pair. In the above screenshot we can see that the price moves upward and the ROC indicator moves downwards. Determining that a bearish movement is about to occur in the asset price. As in the screenshot that is really true that the price has shown a bearish trend afterwards.
Bullish Divergence
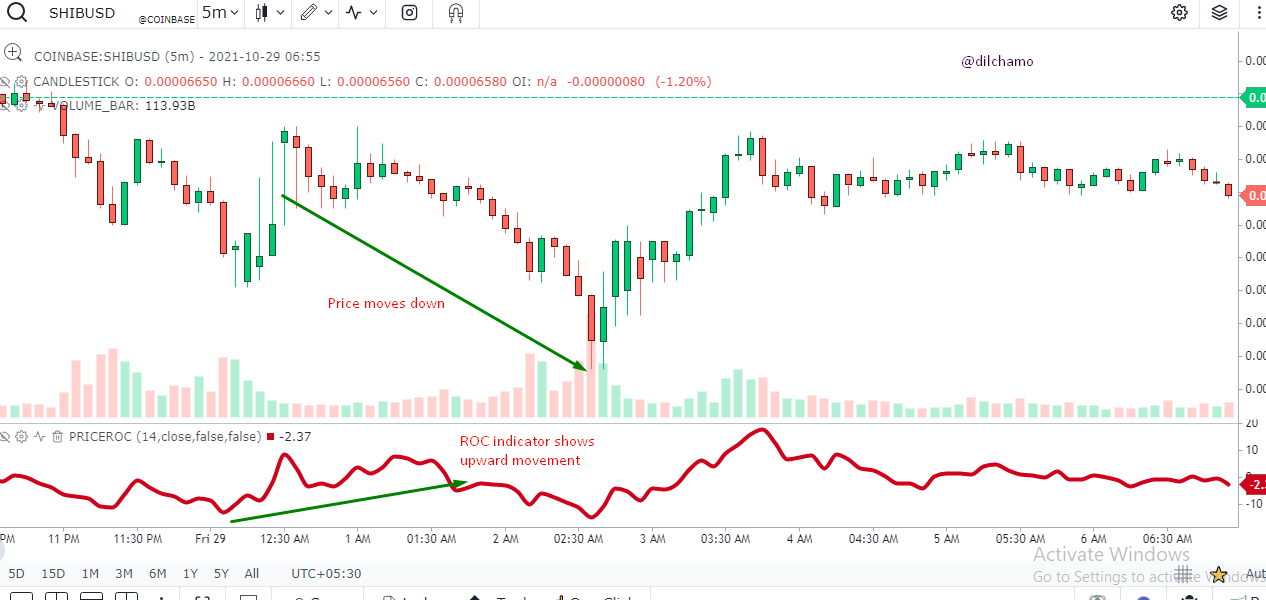
Image taken fromGocharting.com
In the above screenshot I have taken the SHIB/USD cryptocurrency pair to show a Bullish divergence. As seen in the screenshot when the asset price moves down the ROC indicator keeps moving in the upward direction determining a bullish trend is about to occur. In the same way by proving that there is a bullish trend in the asset price after the current trend.
Are the divergences accurate?
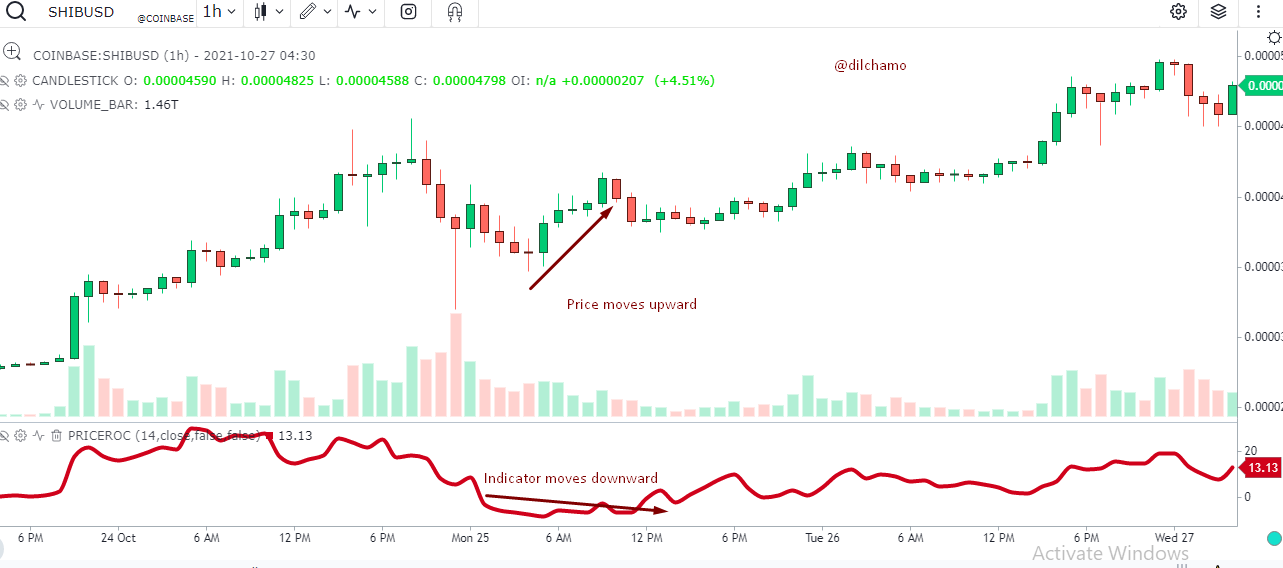
Image taken fromGocharting.com
At the selected cryptocurrency pair of SHIB/USD the ROC indicator acts as a divergence. The price moves upward while the ROC indicator moves downward. But there is no any price uptrend happened after the current price trend as it continues for a certain period. So it may produce false signals and it is adverse to take investment decisions 100% depending on the divergence signal.
6.How to Identify and Confirm Breakouts using ROC indicator
The ROC indicator is useful when drawing trendlines. By using the trend lines traders will be able to identify the asset breakout s and enter or exit from trading. Here we have to draw the trendline by connecting support points for an uptrend determination and by connecting resistance points to determine a downtrend. Here we should connect two or more support or resistance points to identify a trend. We can enter a trade based on the identified breakout point or we can wait for the previous trendline of ROC indicator to act as a support or resistance line.
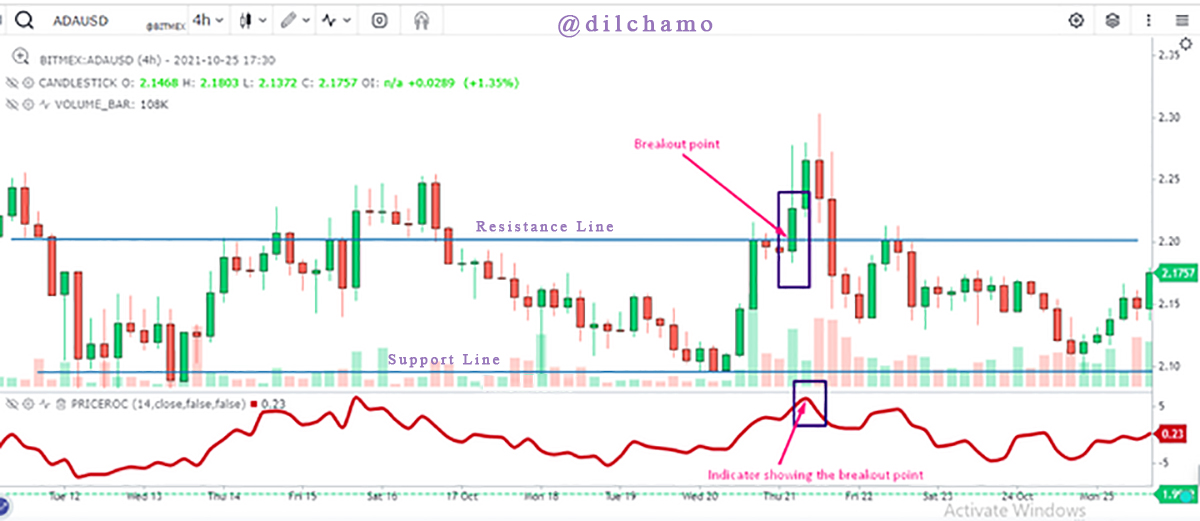
Image taken fromGocharting.com
In the above screenshot I have taken the ADA/USDT cryptocurrency pair to determine the breakout point. I have used two trendlines as support and resistance levels. At one point the price shows a sudden change in the trend. I have spotted that point in the above screenshot. The price which was about to down trend suddenly shows a great rise up breaking the support line. This is the breakout point.
7.Review the chart of any crypto pair and present the various signals giving by ROC trading strategy
I have used the ADA/USDT cryptocurrency pair to present various signals giving by ROC indicator. I have taken the 1 hour time period and 7 period ROC indicators to present the signals.
Overbought and oversold signals
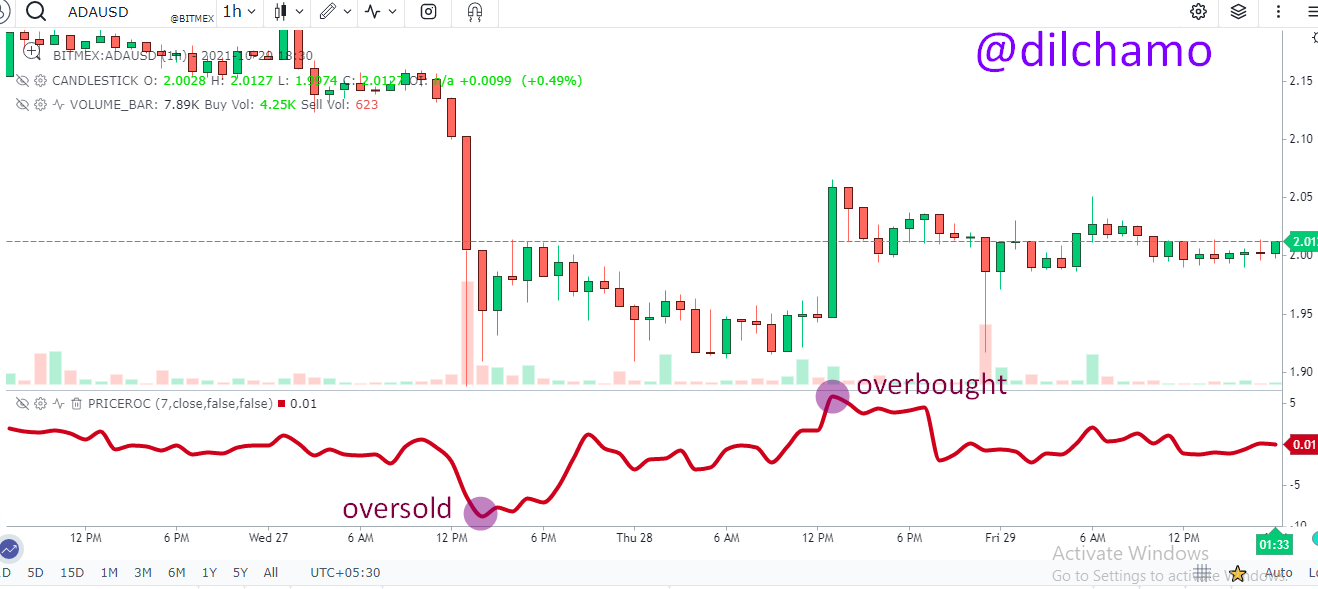
Image taken fromGocharting.com
In the above screenshot, you can see I have spotted the points of overbought and oversold positions. The overbought position was spotted at +5.84 and the oversold position is at -8.81. The traders take buy decisions by figuring out the point of oversold. The traders take sell decisions by figuring out the point of overbought.
Bullish/Bearish divergences
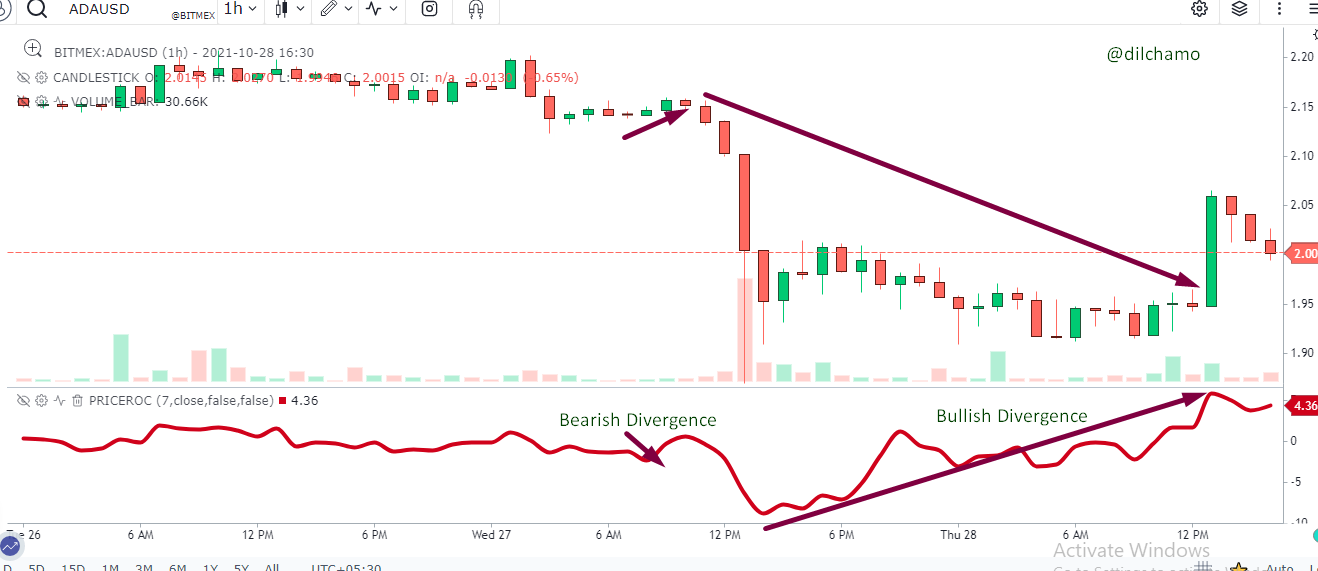
Image taken fromGocharting.com
The bullish/bearish divergence is presented from the above screenshot. Here also I have used the ADA/USDT cryptocurrency pair with 7 periods. In the bearish divergence the price moves upward and the ROC indicator signals of an upcoming bearish trend. In the bullish divergence, the price moves downwards but the ROC indicator shows an upcoming bullish trend.
CONCLUSION
The ROC indicator gives us many price movement signals. It helps to confirm the price movements and detect divergences. The level of +- 4 determines whether the Indicator predicts overbought or oversold positions. The ROC indicator can be used with other strategies or indicators as it also provides false signals so we should not fully depend on the ROC reading. Thank you professor @kouba01 for this wonderful lecture.

Hello @dilchamo,
Thank you for participating in the 8th Week Crypto Course in its 4th season and for your efforts to complete the suggested tasks, you deserve a Total|7.5/10 rating, according to the following scale:
My review :
Work with good content. And here are some notes that I bring to you.
A good explanation of the ROC indicator and especially how to calculate its value with a good existing example.
You have not deepened your analysis to interpret the best parameters of the chosen period option.
A superficial explanation for trend determination and its reversal.
Thanks again for your effort, and we look forward to reading your next work.
Sincerely,@kouba01
Thank you so much for the rectification professor. Regards.
#club5050 😀