Crypto Academy /S5W3-Homework Post for kouba01
Technical analysis is very important in trading cryptocurrency and other financial instruments, you need to know how the market is progressing before you can enter or exit the market. Traders use technical indicators to get a better understanding of the present or previous market trend as well as prospective market movement. There are many different types of technical indicators, each with its own purpose. Some are used to check volatility (bollinger bands, average true range), others are oscillators, and still others are used to check trend (parabolic sar, MACD), and so on.
In answer to the homework questions ask by our professor after his class, I'll be writing about the Alligator indicator, which is one of these technical indicators.
Question 1: Discuss your understanding of the use of the Alligator indicator and show how it is calculated?
Alligator Indicator
The alligator indicator, also known as the Williams alligator indicator, is a technical analysis tool that is used to detect the emergence of a trend in a financial market. This indicator looks for trends and indicates where traders should enter and exit the market.
Bill Williams, a well-known market analyst, created the Alligator indicator. He named the indicator after the alligator since he saw the market behave similarly to the alligator.
The alligator comparison is intended to help explain some of the market's behaviors when it swings from non-trending to trending. The concept is that the lack of a market trend is like a sleeping alligator. When the alligator wakes up and goes in search of its prey. The alligator will grow hungrier the longer it has slept, implying that the pattern will become more obvious.
The 'balance lines' in the Alligator indicator are made up of three moving averages that have been smoothed over different timeframes.
We can identify the structure of the market and whether or not we are dealing with a sleeping alligator by looking at the movement of the balance lines.The lines march in lockstep in a long-term trend. They cross in a sideways trend. They form the "Alligator's Mouth," which adjusts its position according to market conditions.
(1). Alligator's Jaw: This is the slowest of the three moving averages, with a period of 13 and a shift of 8 bars into the future. When the price is beyond the curve, it suggests a consistent upward movement. When the price is under the curve, a downtrend is assumed. The most usual line graph color is blue.
(2). The Alligator's Teeth is the middle of the three moving averages. The teeth is with a period of 8 and it is moved into the future by 5 bars. It follows the same path as the Jaws line, but for a shorter amount of time. On most charts, the default color is red.
(3). Alligator's Lip: The lip has a period of 5 bars and is 3 bars into the future. Green is the default color.
The Mouth position is regarded to be Jaw-Teeth-Lips. The market is in a downtrend if the lines travel approximately parallel above the price curve. An uptrend is indicated when the lines are below the price curve. A flat market is indicated by the overlapping of lines. When the lines travel so close together that there is no difference between them, this is known as "Alligator's Sleep." They intersect even more. This indicates that the market has entered a phase of sideways movement. Trading is not a good idea.
After a lengthy sleep, the Alligator is always hungry, which means the price spike will be larger, and it's very likely that a powerful, long-term trend will form.
How to calculate Alligator Indicator
The method of calculating the Williams Alligator is as follows:
JAW = SMMA (MEDIAN PRICE, 13, 8)
TEETH = SMMA (MEDIAN PRICE, 8, 5)
LIPS = SMMA (MEDIAN PRICE, 5, 3)
Note: MEDIAN PRICE = (HIGH + LOW) / 2; HIGH represents a candle's high, while LOW represents candle's low.
SMMA stands for smoothed moving average median price. SMMA (MEDIAN PRICE, 8, 5) signifies that a smoothed moving average with a period of 8 and a shift of 5 is generated from the median price.
We can see that the value of each indicator line can be computed manually using this formula. Alligator indicator, on the other hand, is included by default in every trading platform, so you won't have to calculate these numbers yourself.
Question 2: Show how to add the indicator to the chart, How to configure the Alligator indicator and is it advisable to change its default settings ?. (Screenshot required).
The Williams alligator indicator is simple to apply on your chart. I'm going to show you how to use this indicator with one of the most popular trading platforms, Trading view.
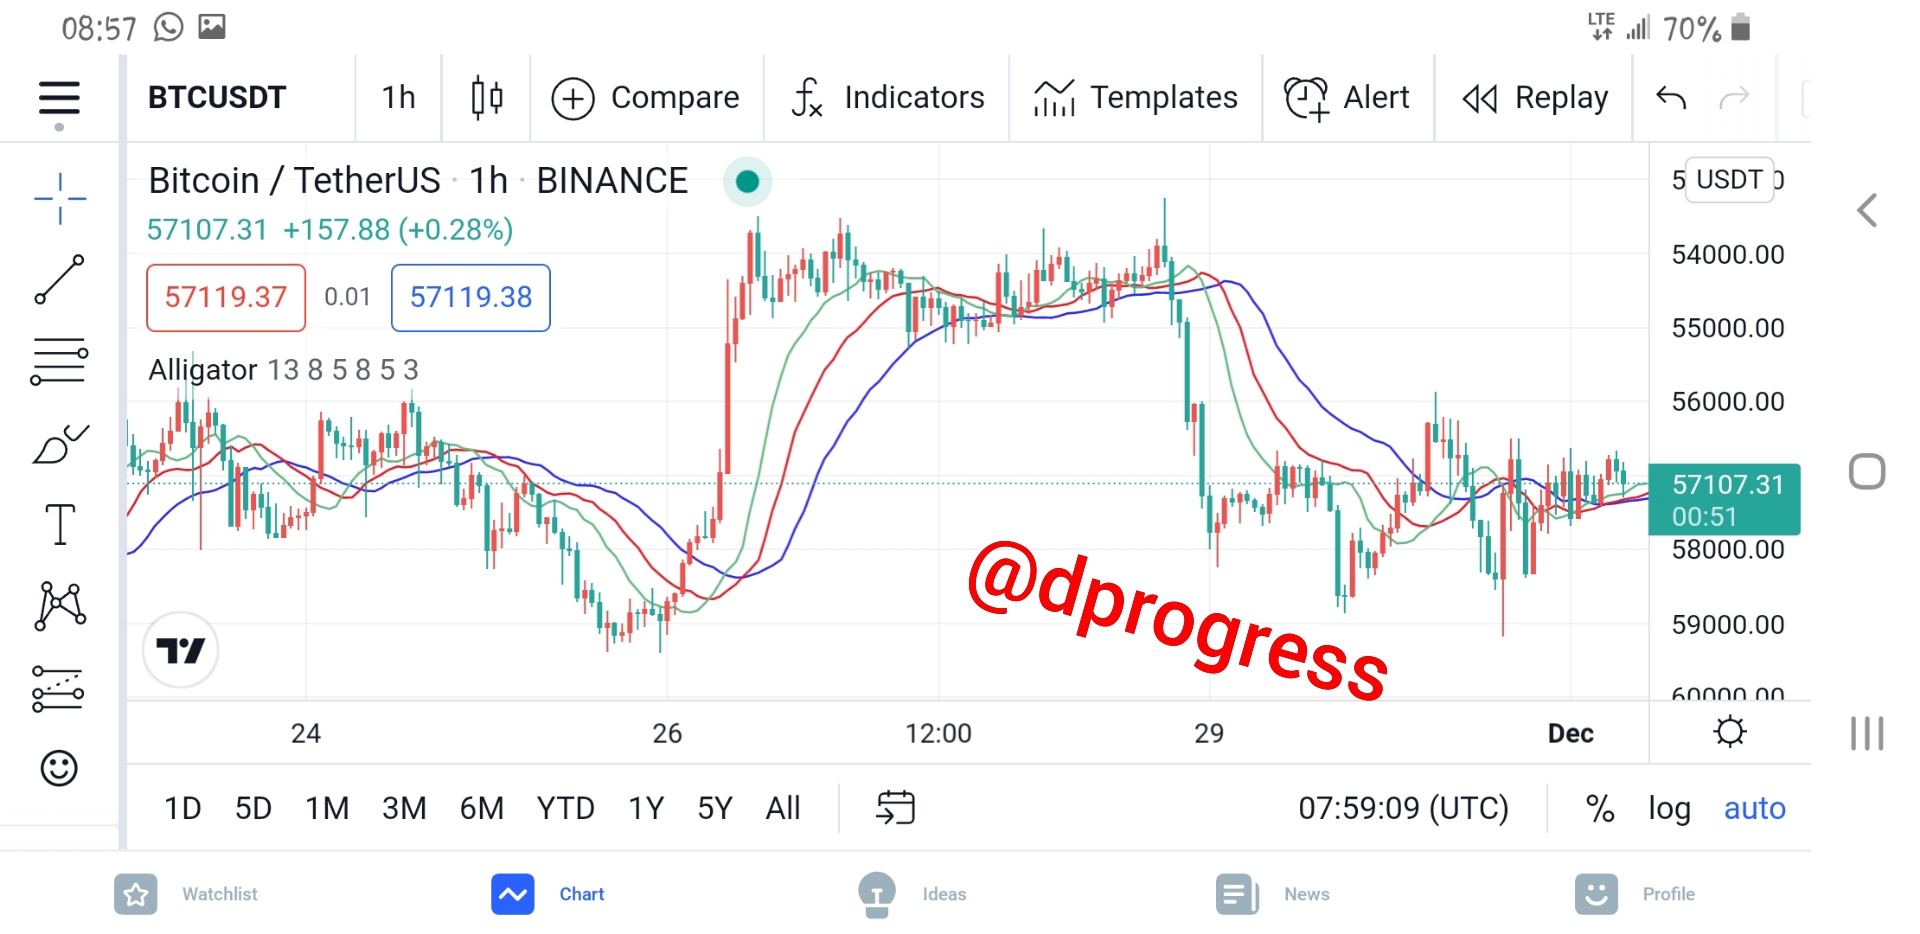
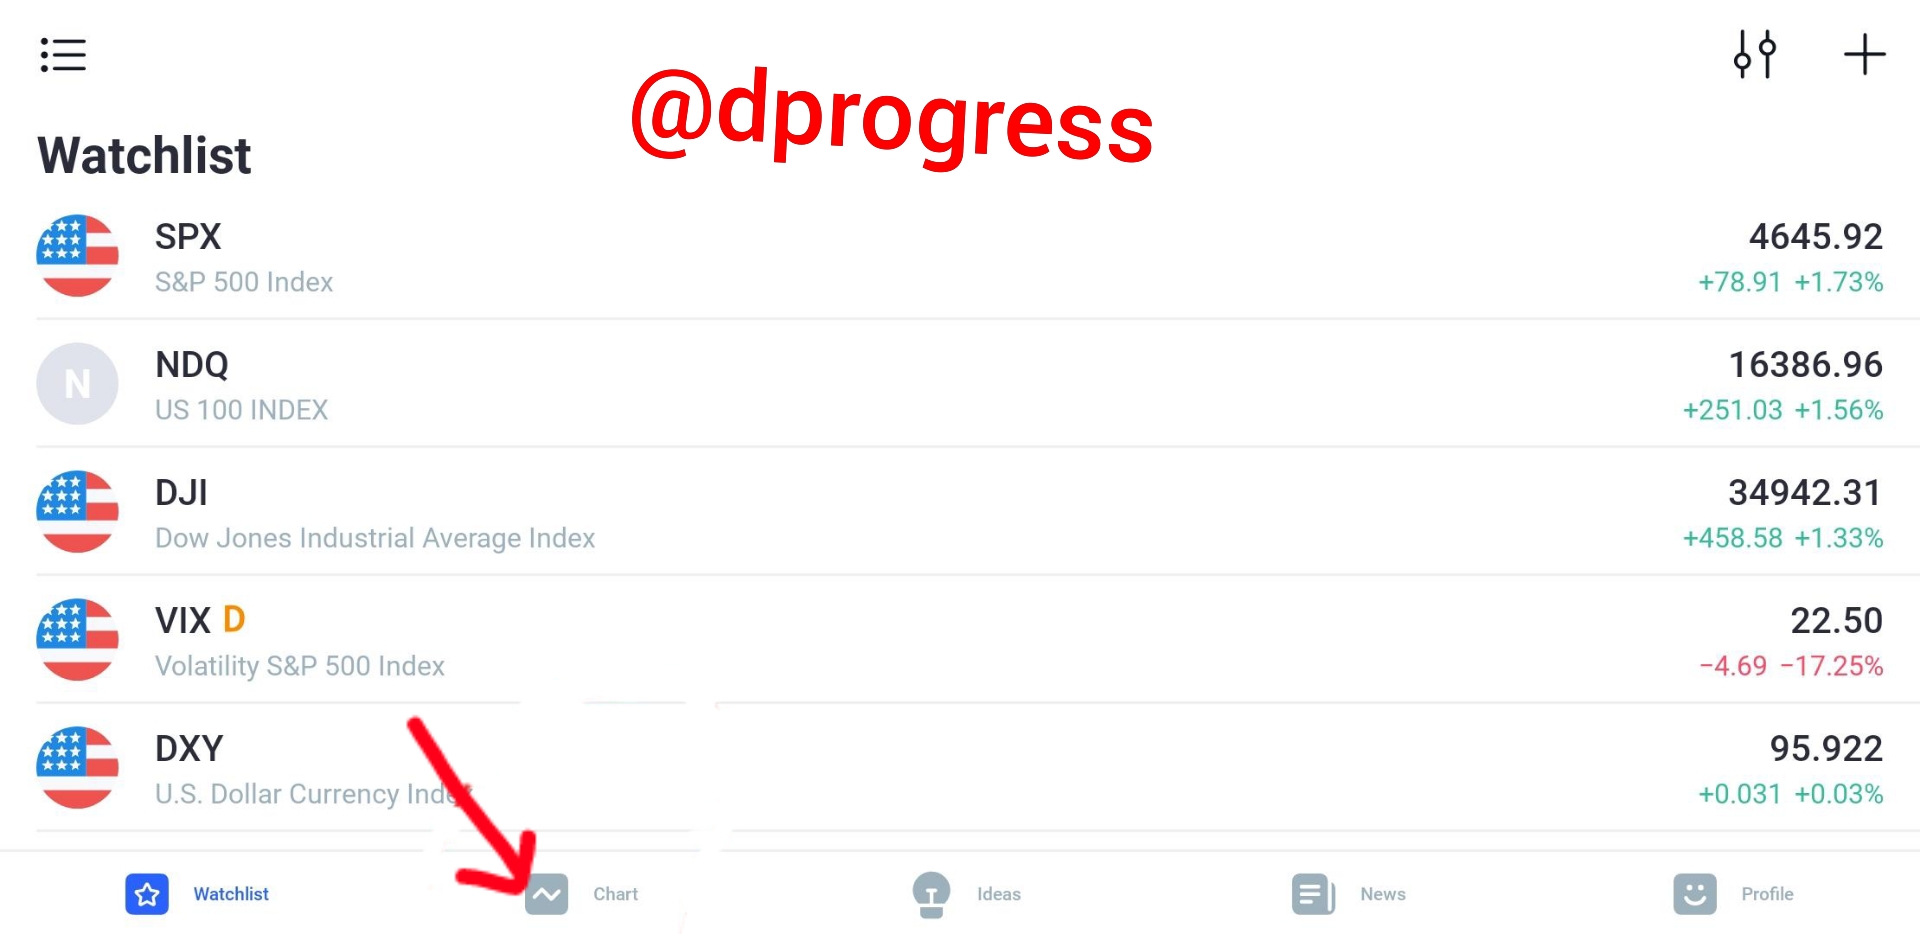
Open your trading view app and click on chart, then select the coin pair you're interested in, in this case BTC/USDT.
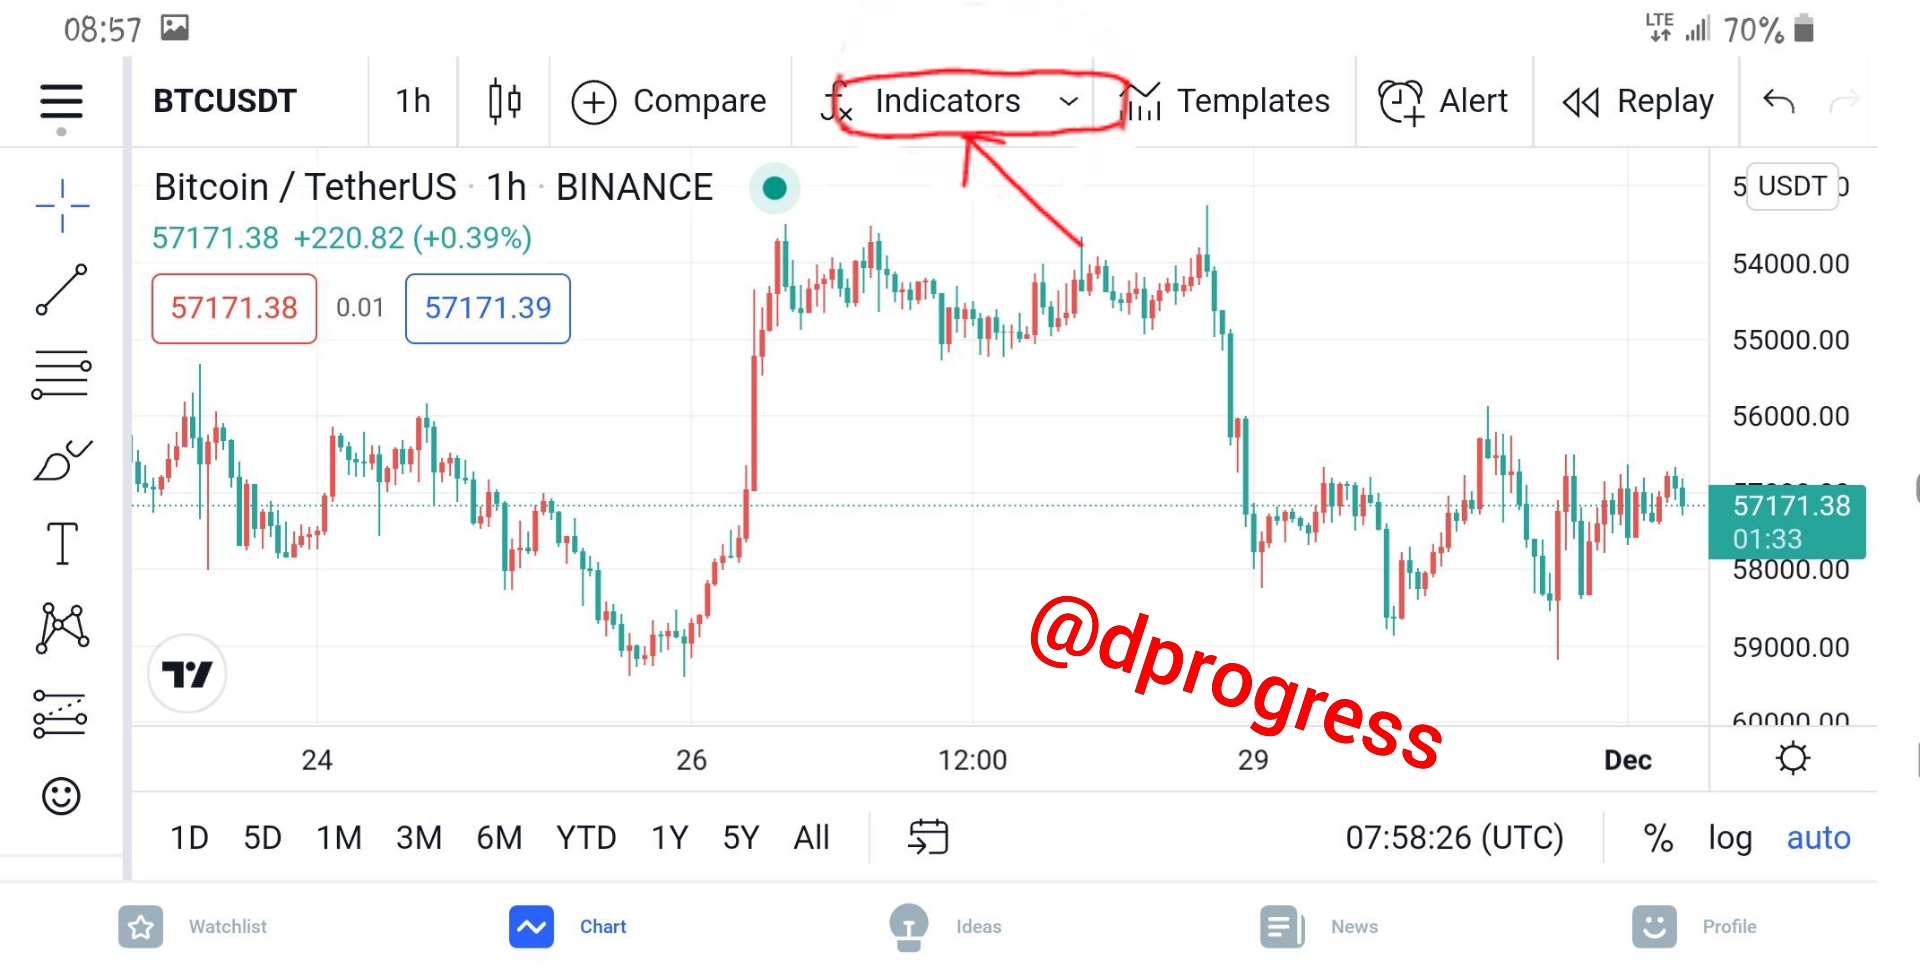
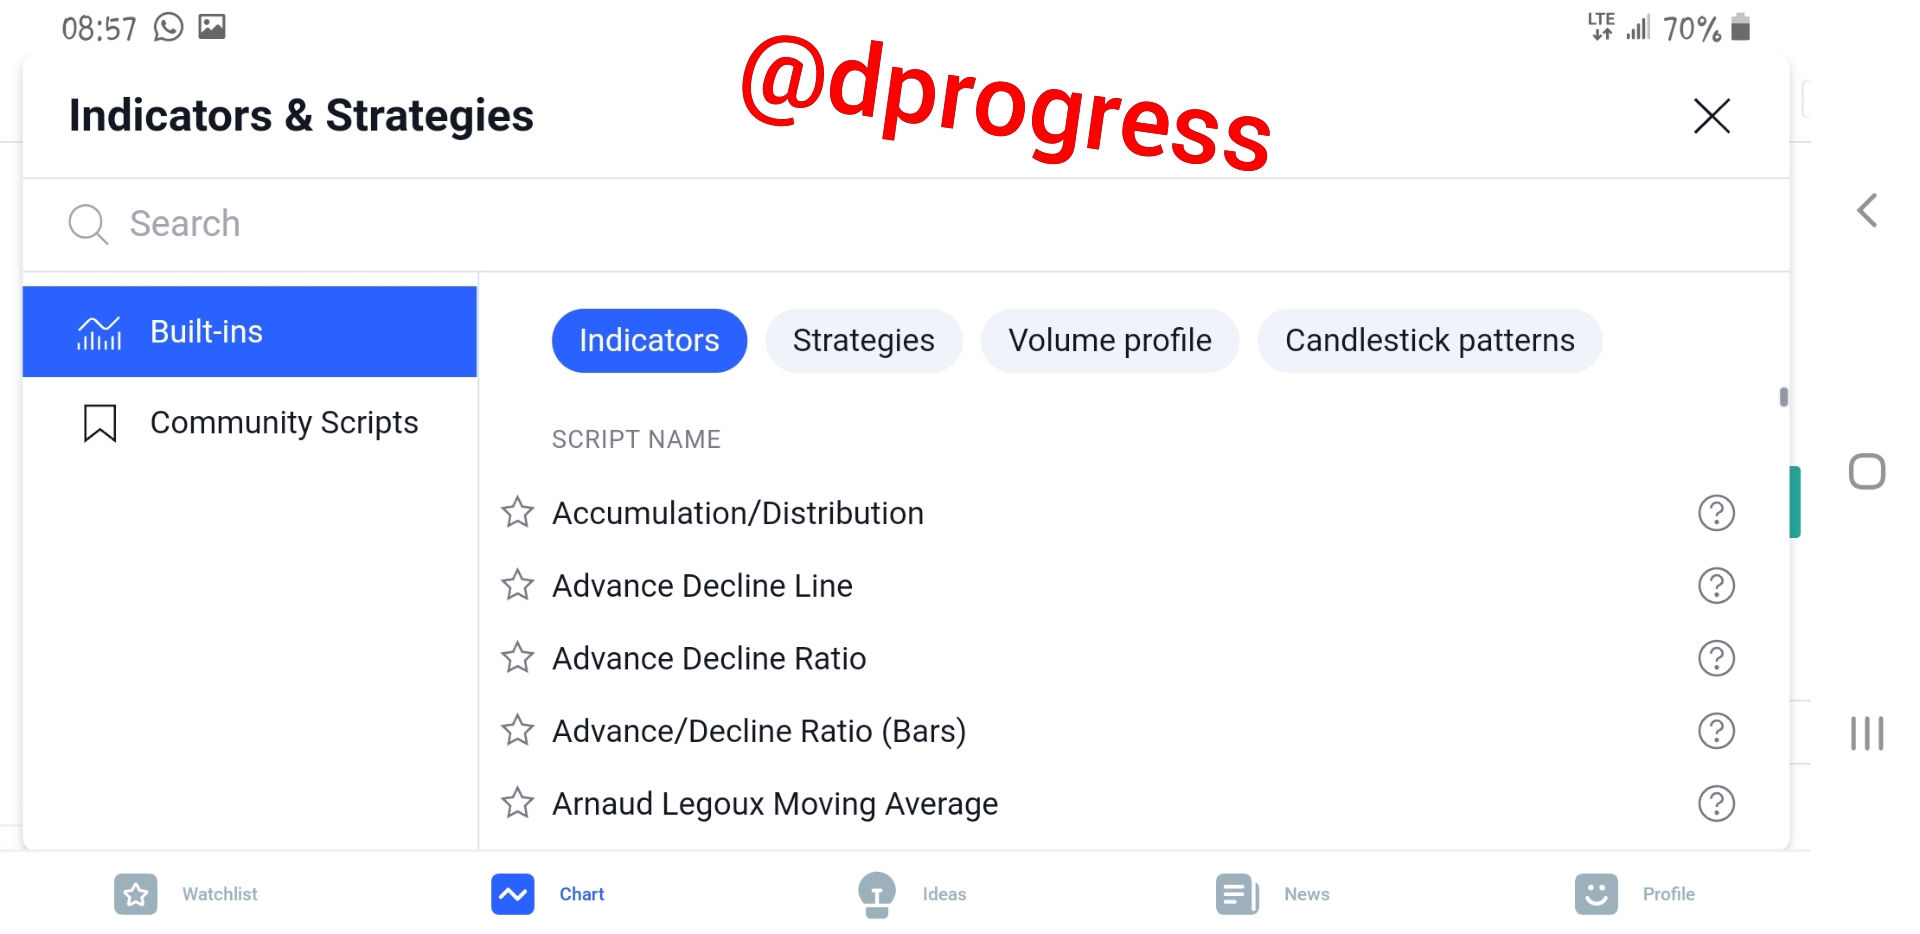
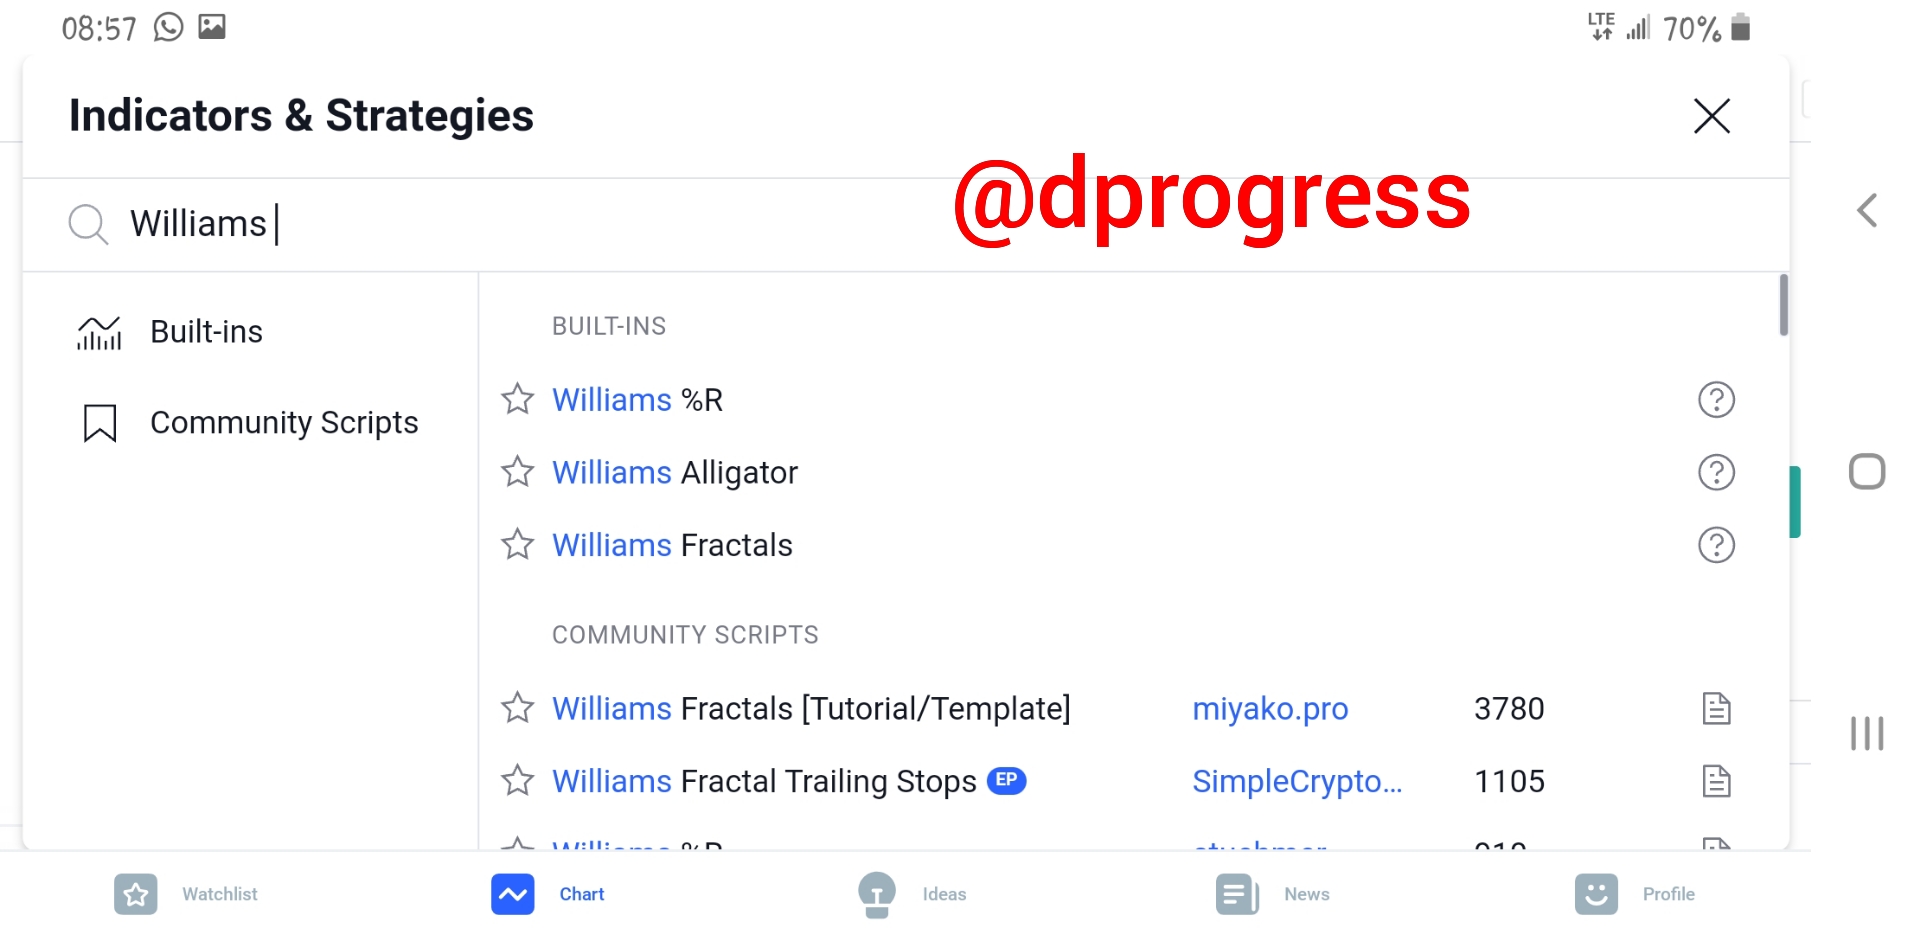
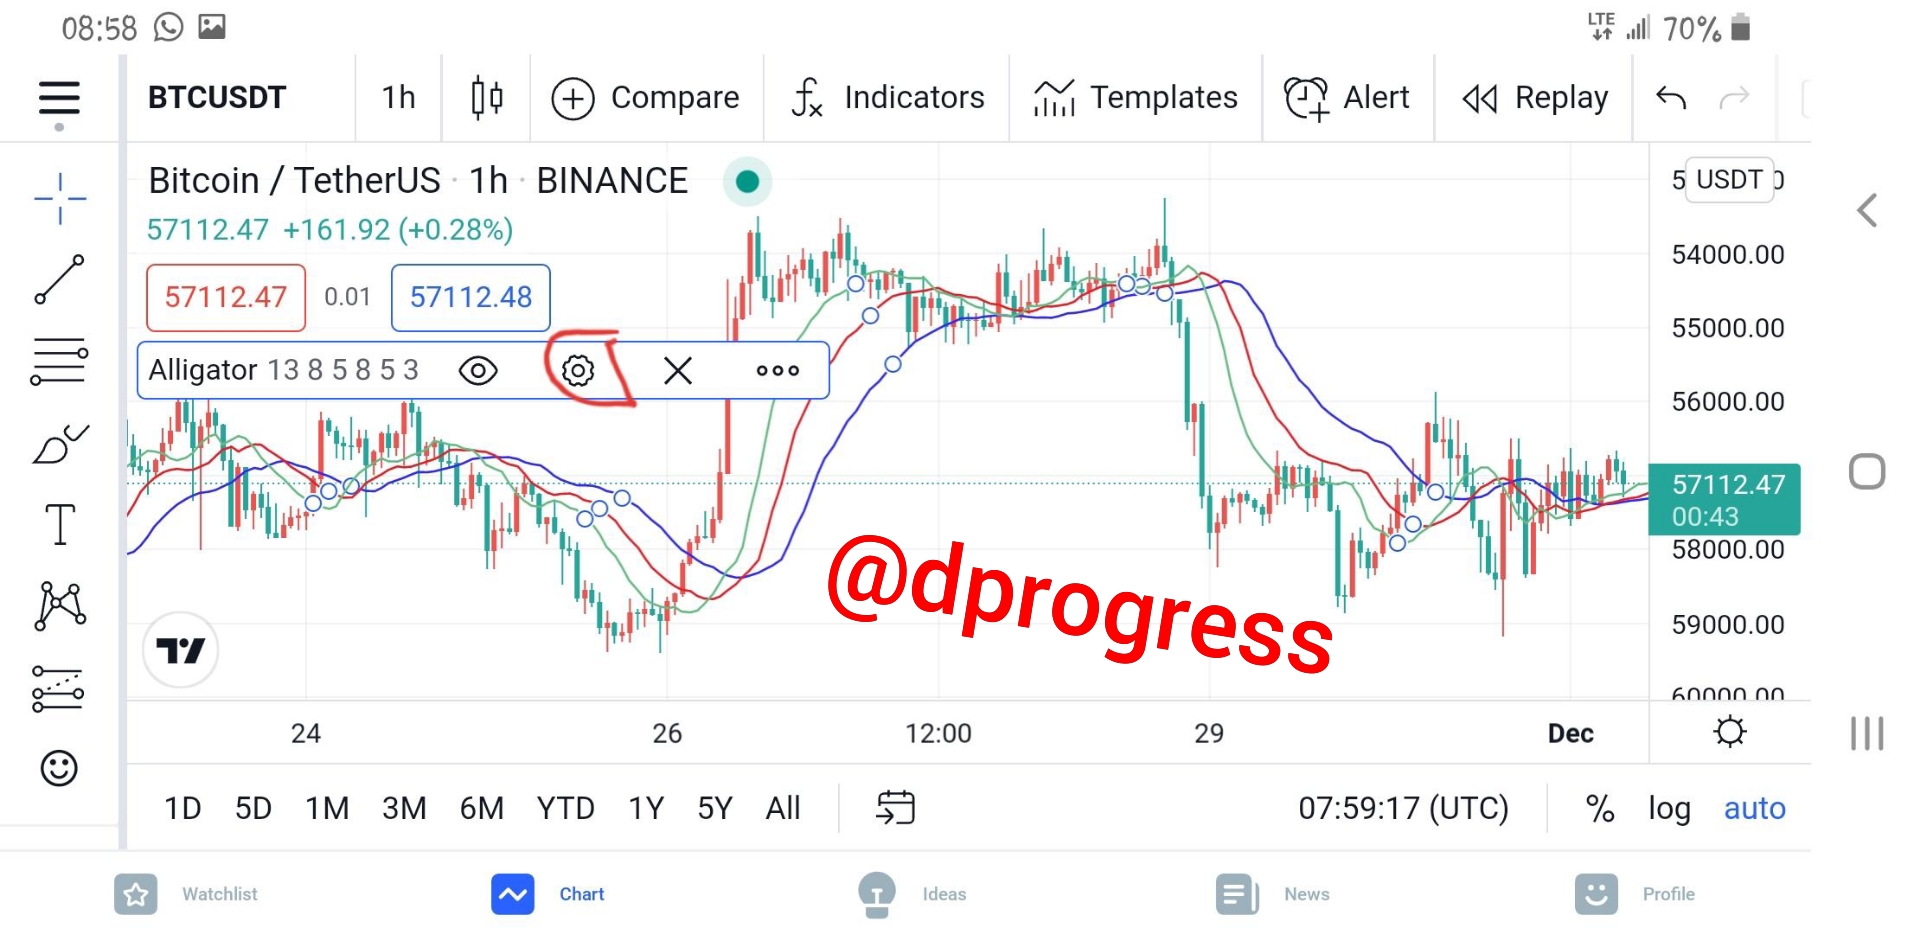
Click on the indicator and search for William alligator; when it appears, click on it, and the balance lines will be displayed on your chart automatically.

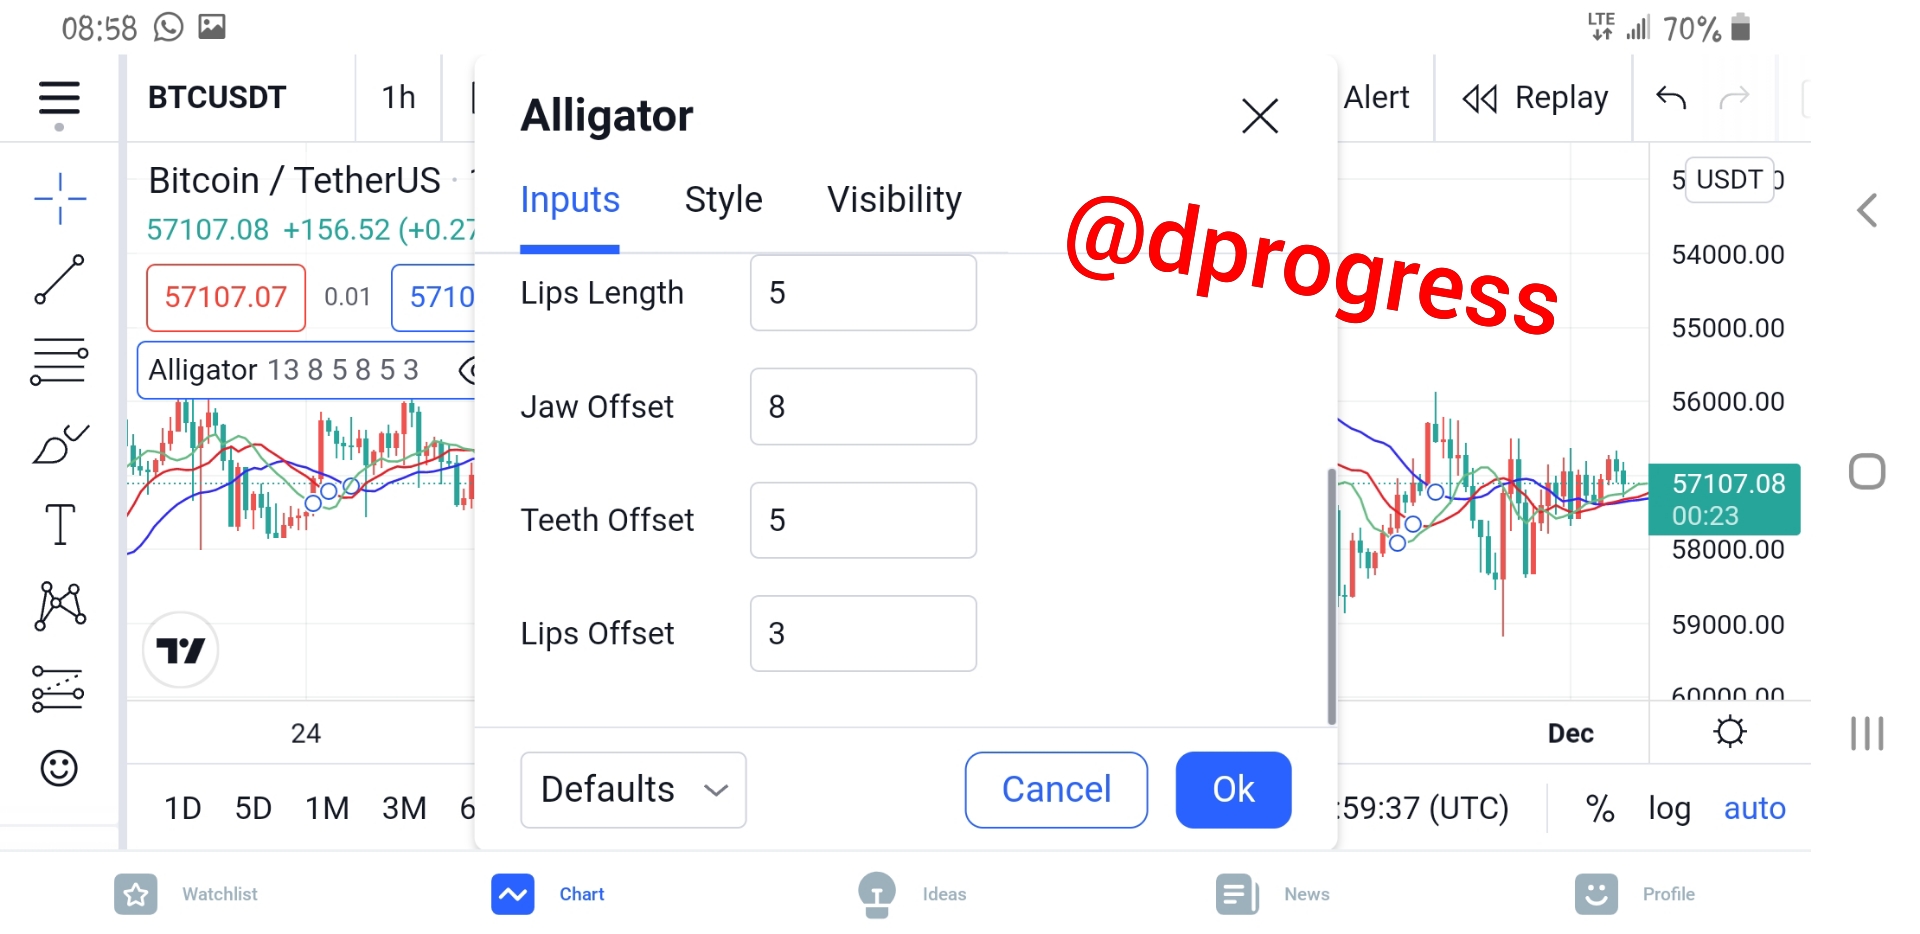
You can modify the indicator's default parameters, as well as the color of the three moving averages and the timeframe.
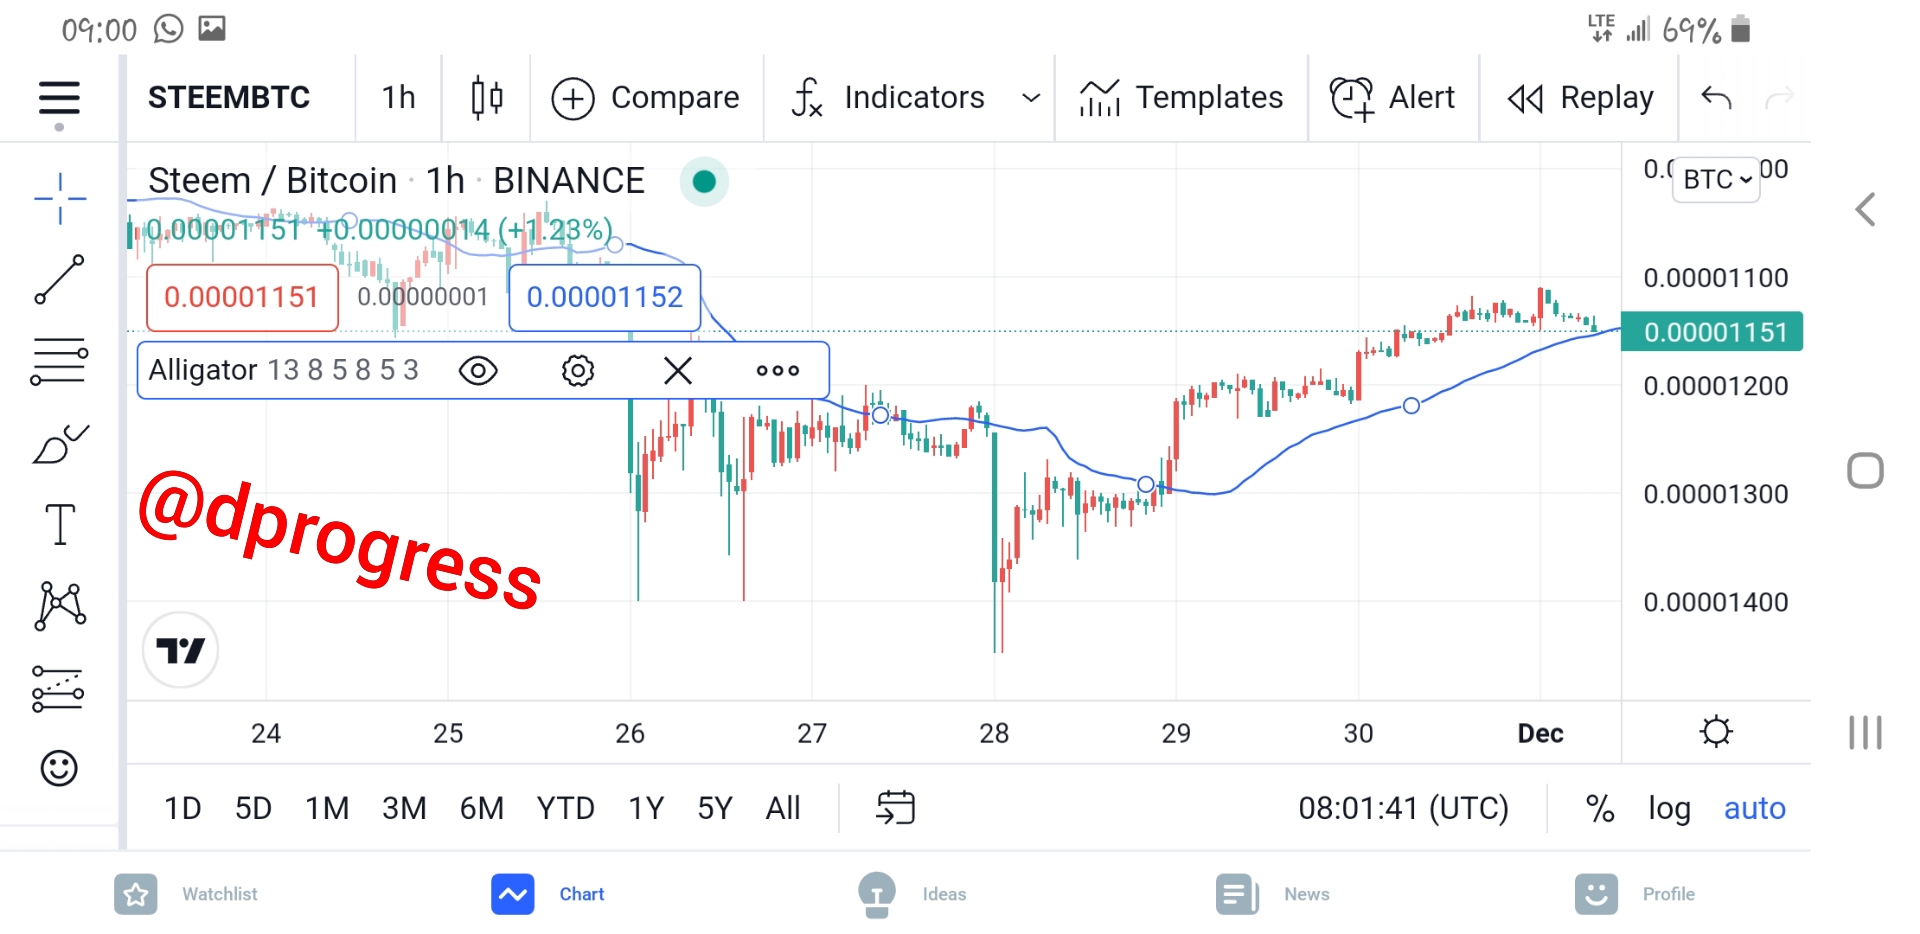
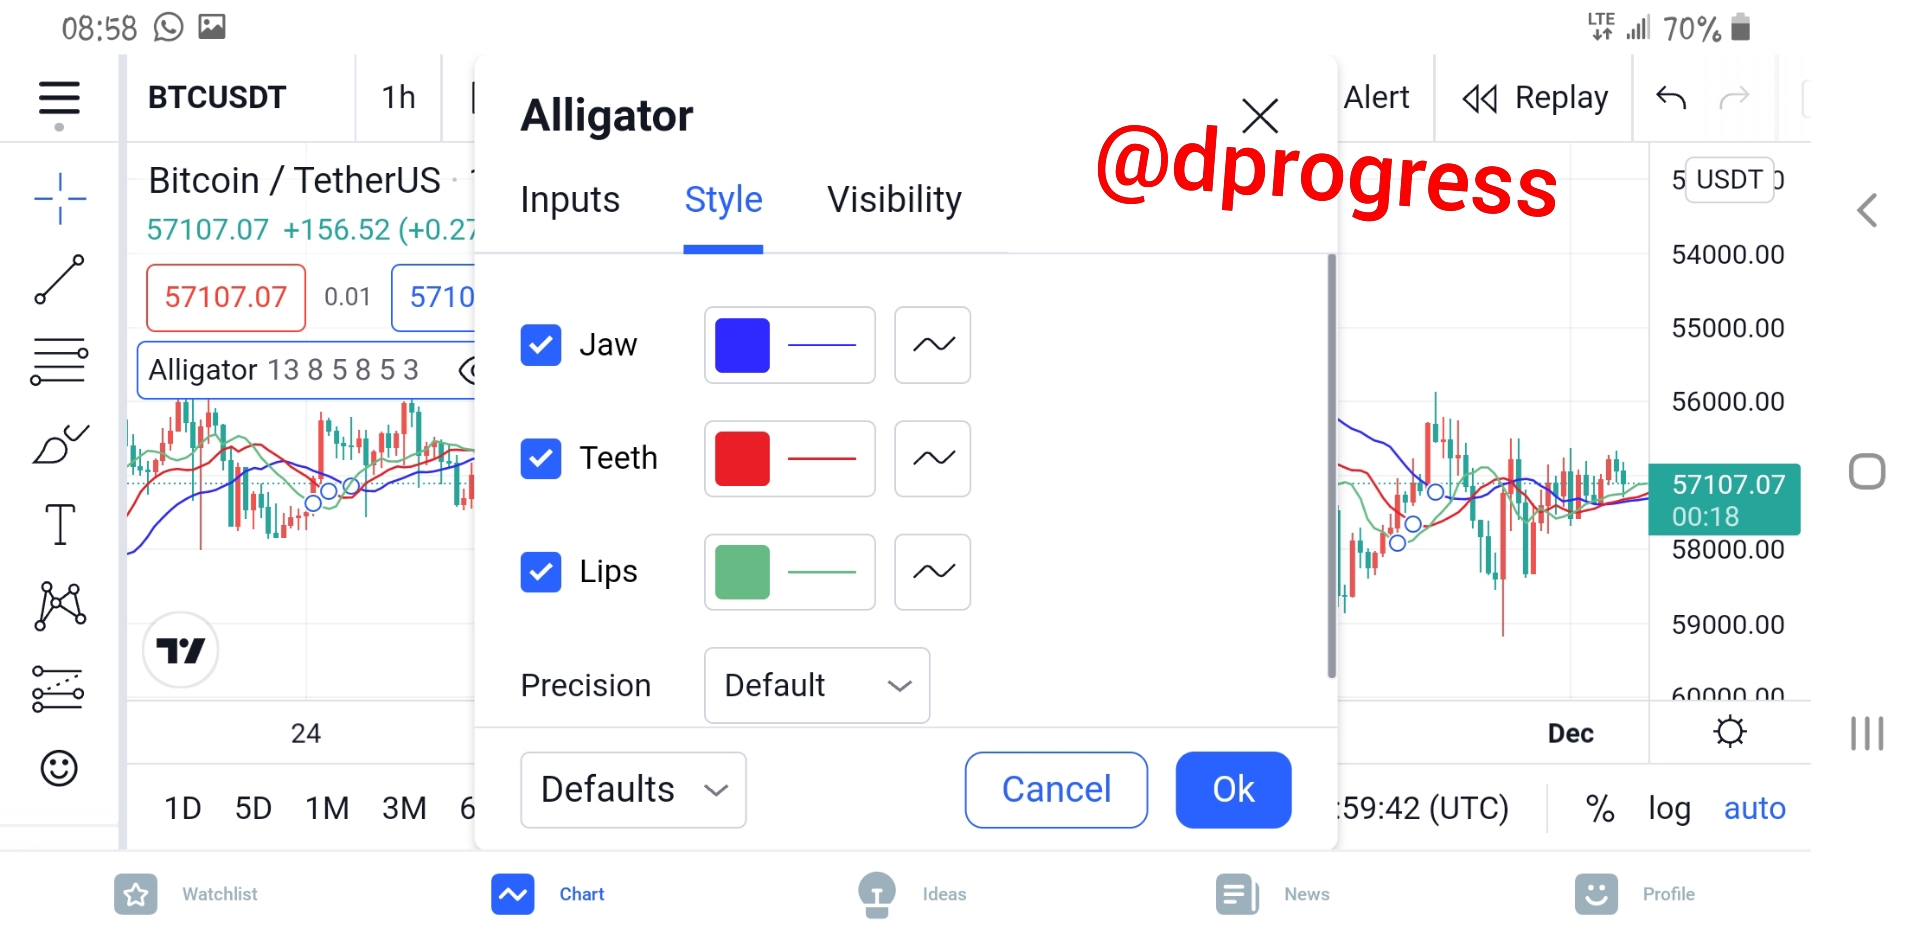
To change the color of the balance line, click on any of the lines; a small toolbar will appear, allowing you to configure your indicator. Click on the small setting icon to do so.
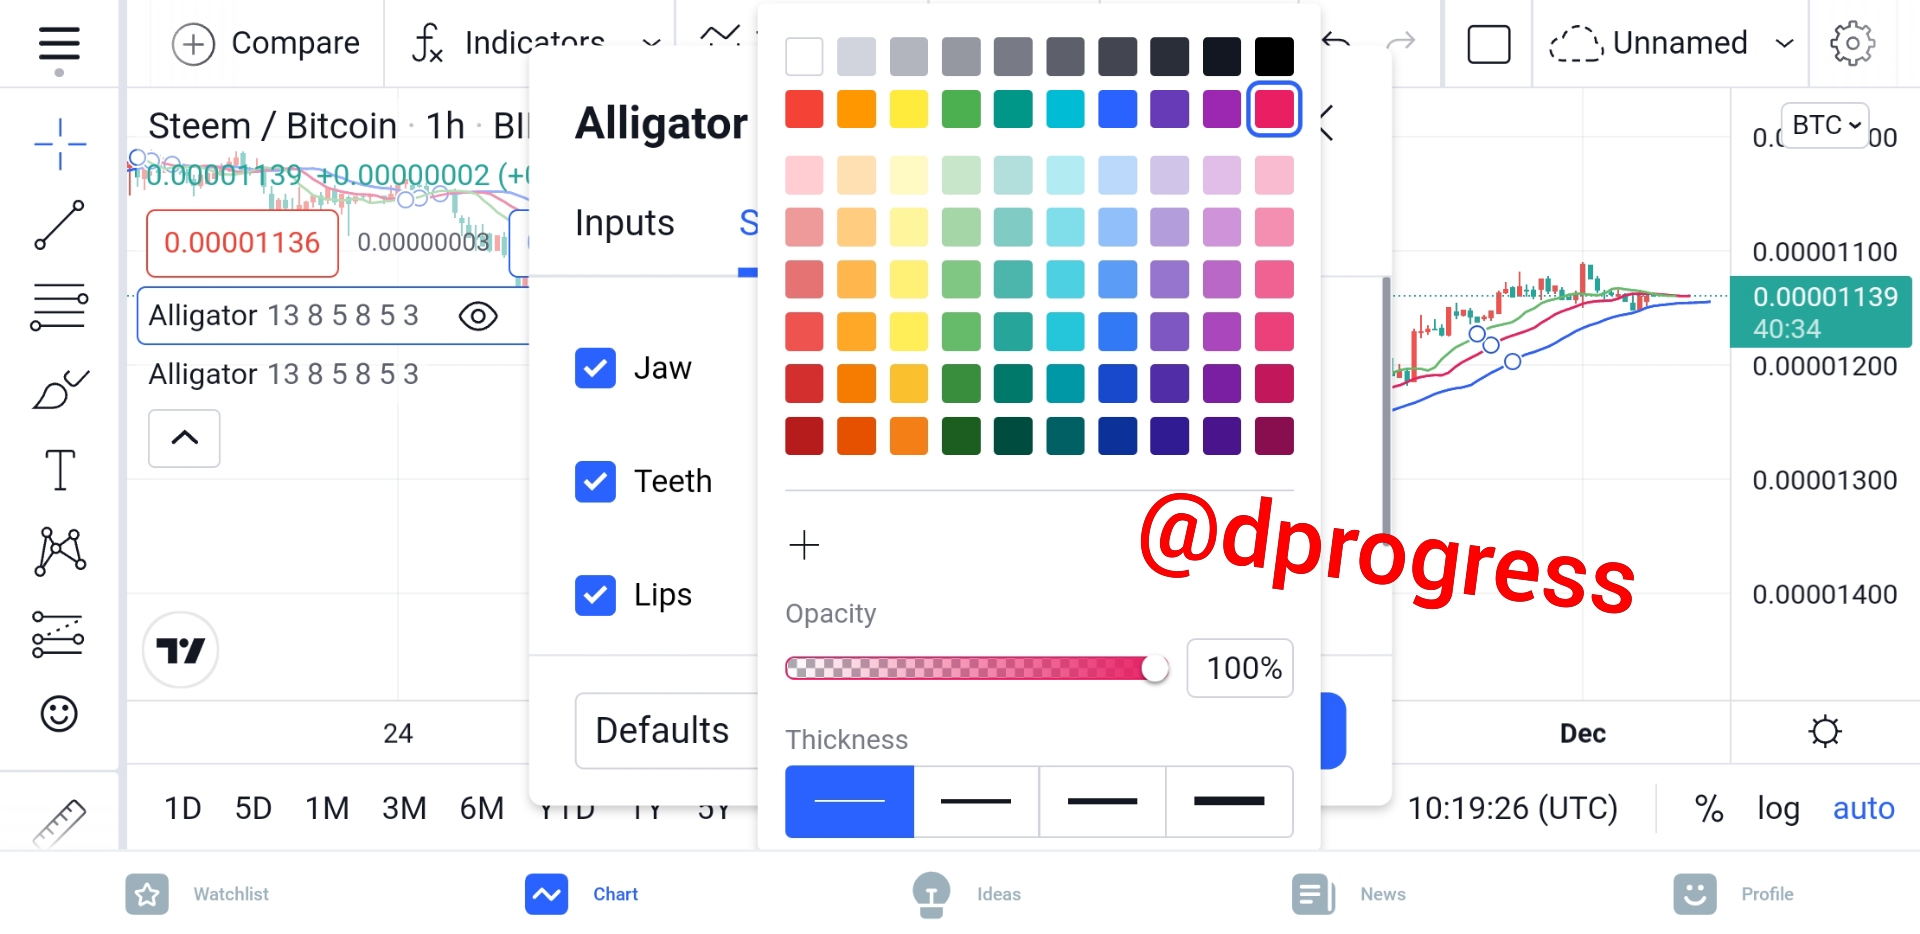
The default colors for each line will be displayed; click on any one you want to change and select a different color from the options. It's necessary to remember that you shouldn't use the same color for all lines because the moving average would be difficult to differentiate.
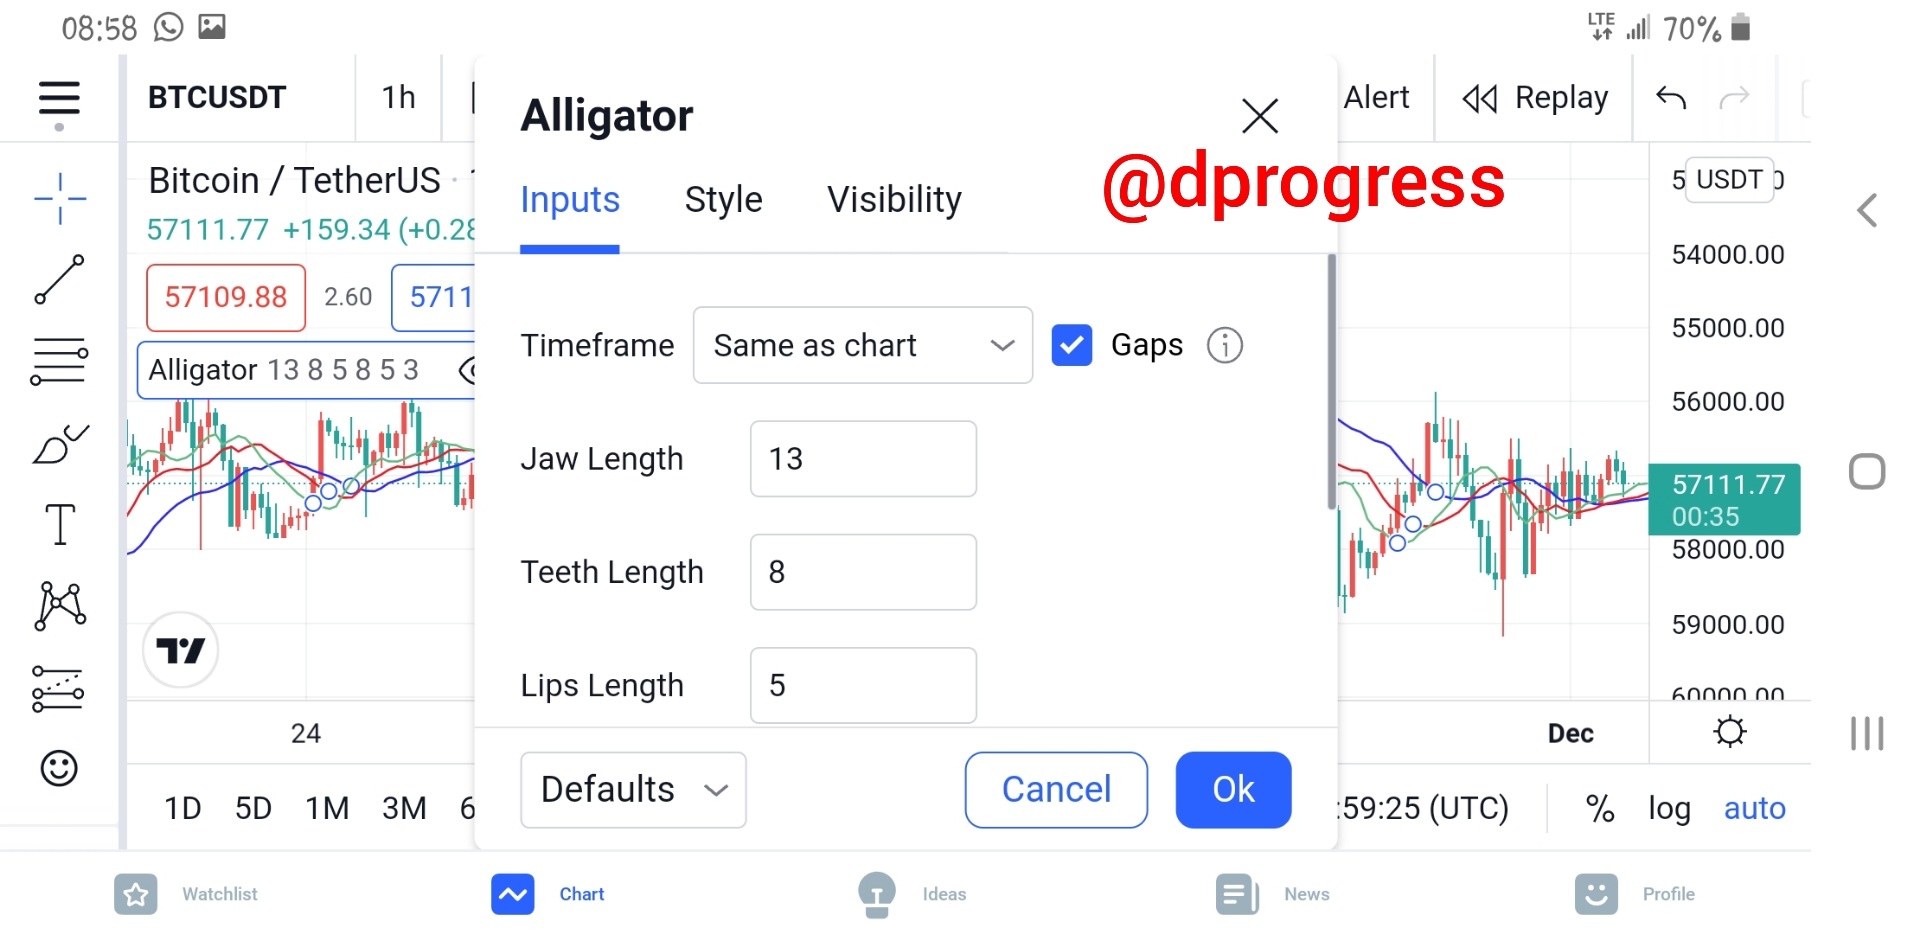
Simply click on input to adjust the period, and the default period for each moving average will be displayed. It is not recommended that you change the default period; however, if you do, keep the adjustment in line with fibonacci numbers.
Question 3: How do we interpret this indicator from its 3 phases which are the period of rest(or sleep), awakening, and the meal phase?(Screenshot required).
We already know that there are three phases in the Williams alligator indicator: sleep, awakening, and eating.
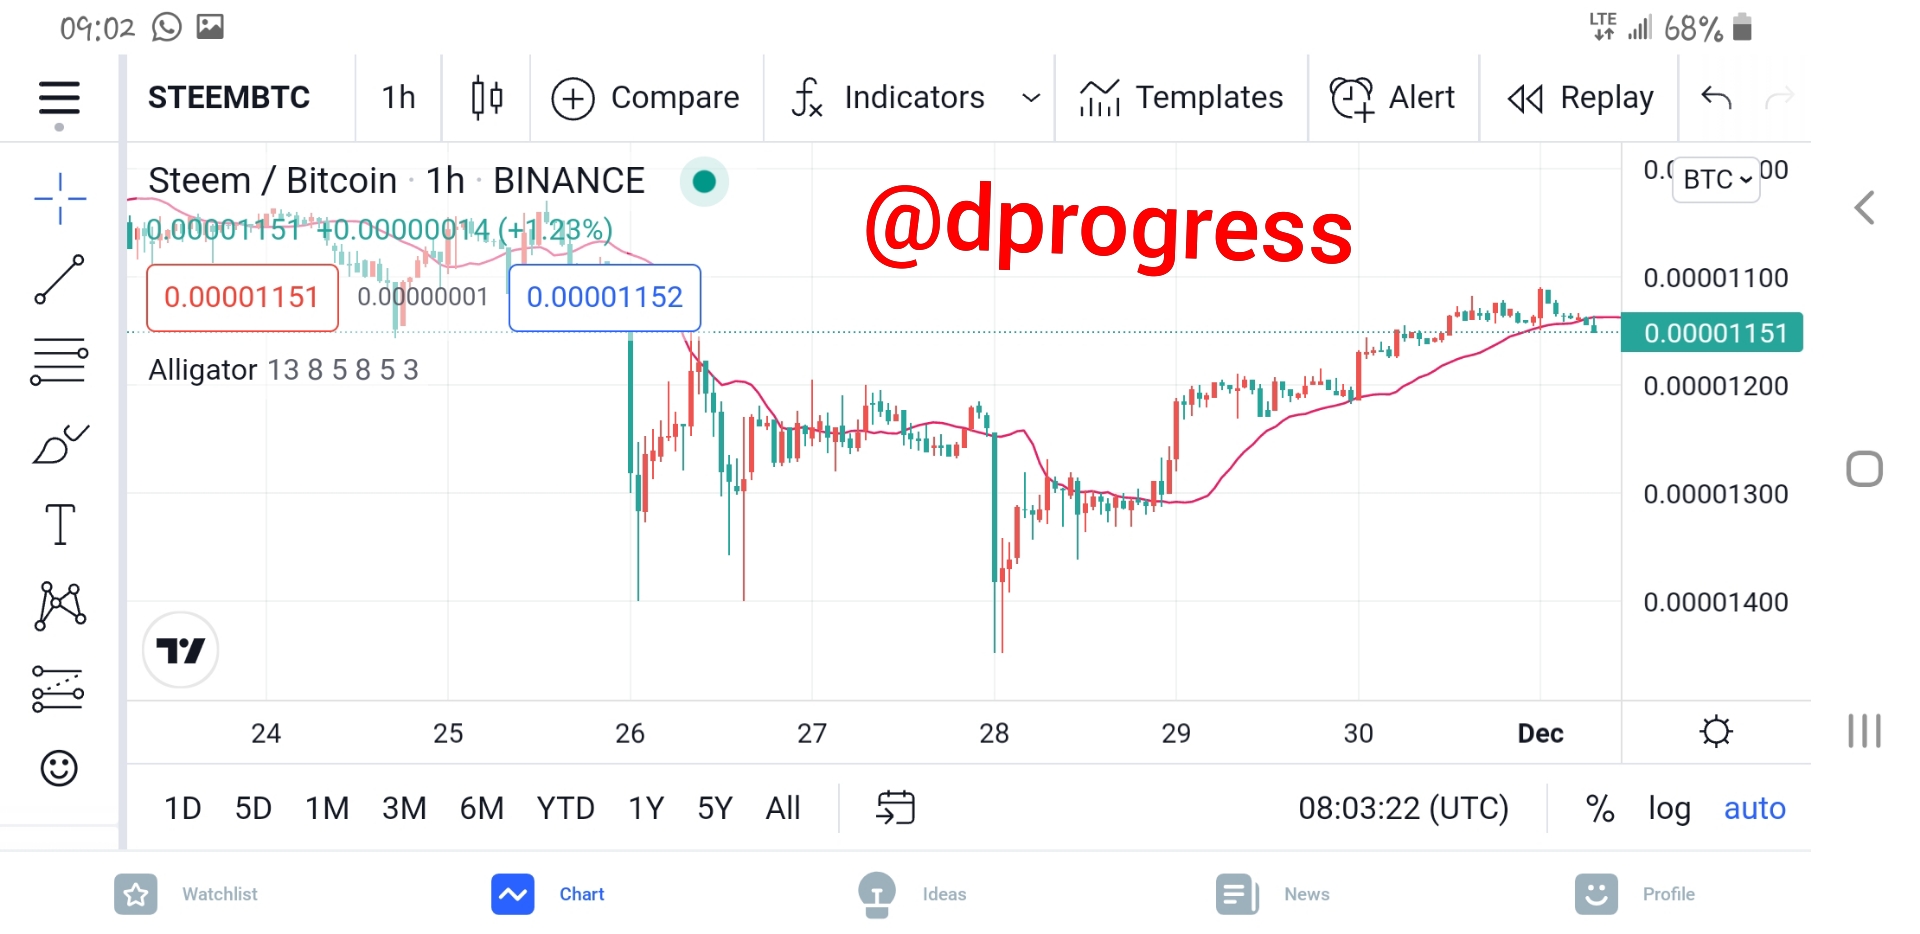
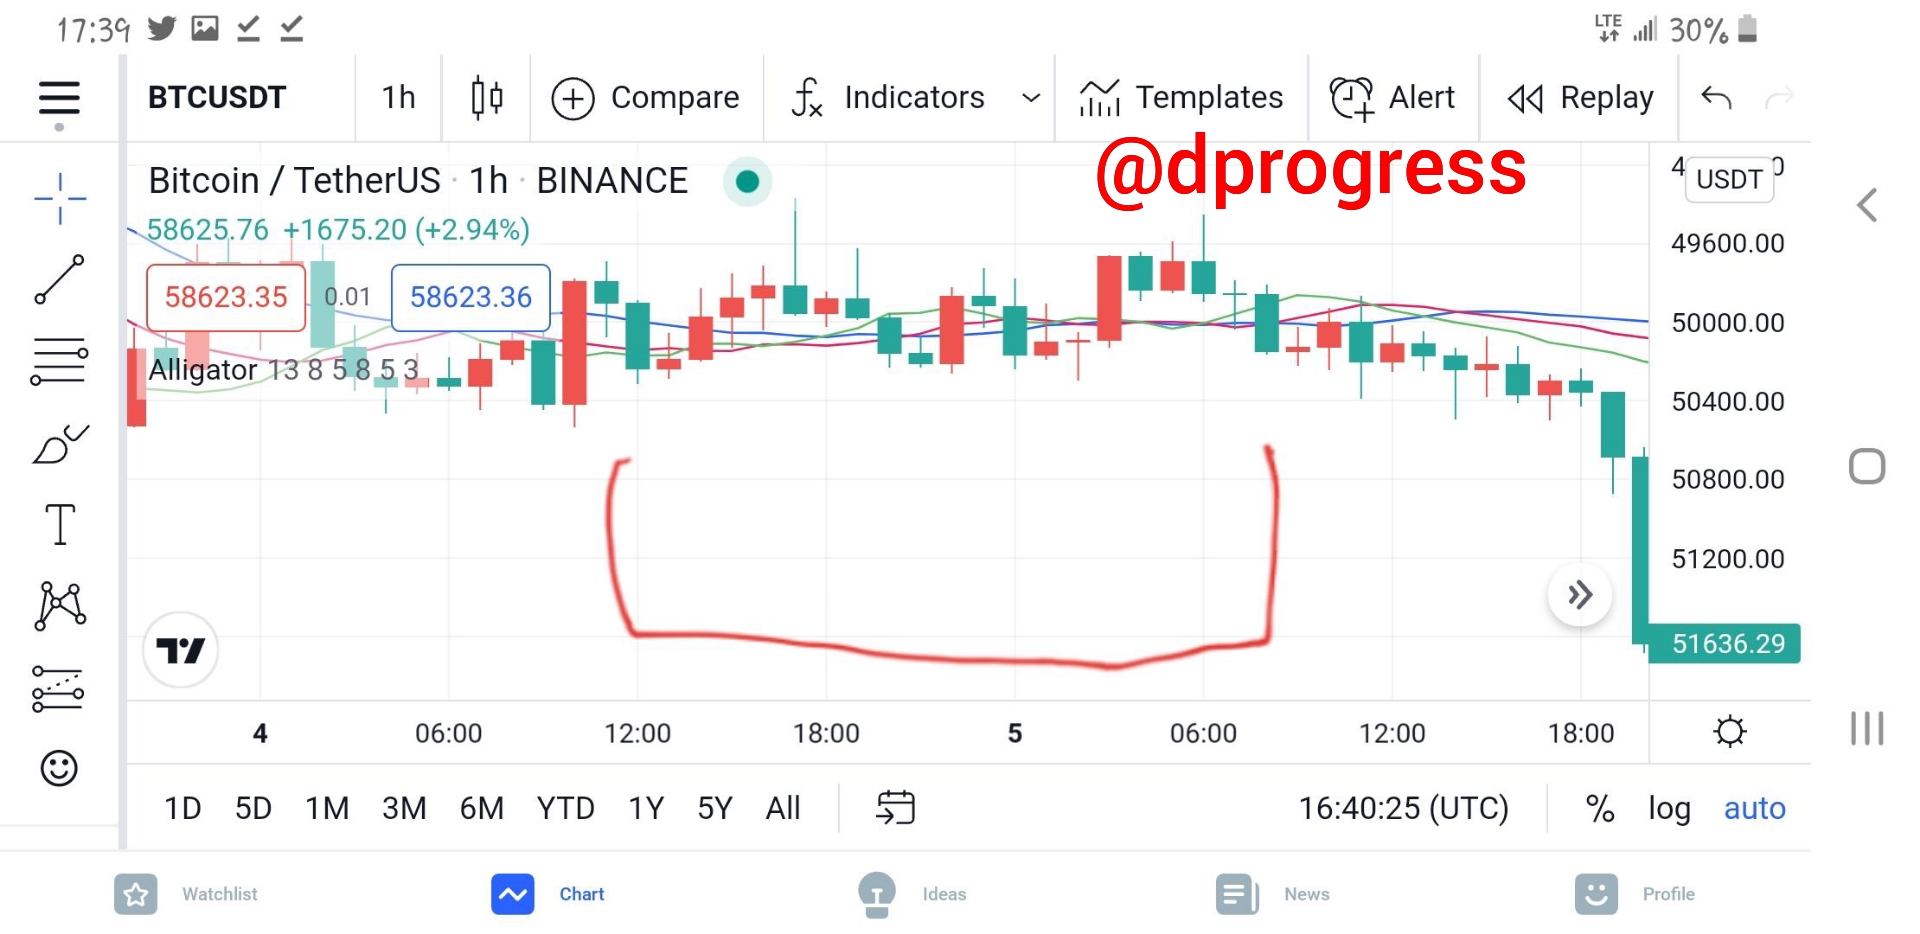
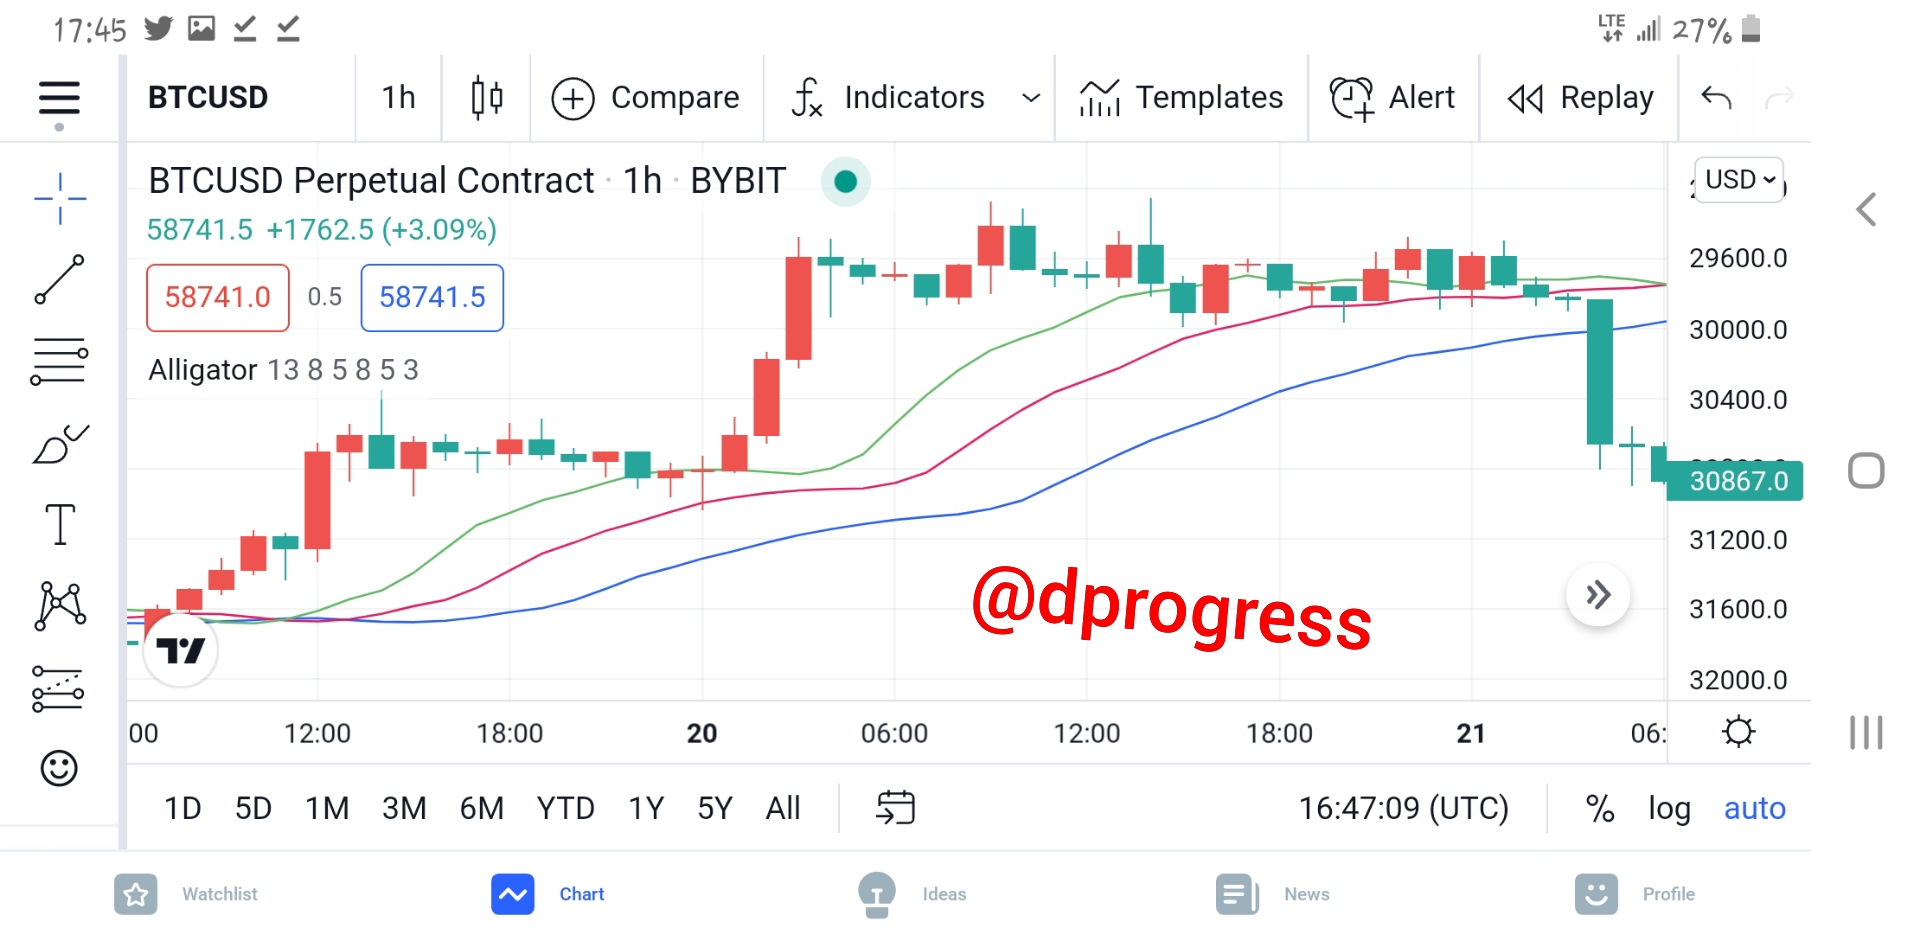
(1). Sleeping phase: The alligator signal is made up of three moving averages; when the lines overlap or entwine, the market drifts sideways with no discernible trend. This means the market is sleeping and there is no clear bullish or bearish trend. However, when an alligator sleeps for a long time, it becomes hungry and will hunt longer to satisfy its hunger, so the market will move strongly in a direction when the alligator wakes up. The creation of an accumulation zone during the sleeping phase is characterized by big traders adding to their trades.
(2). Awakening phase: This is when the market begins to gather momentum.The price crosses the balance line in a specific direction at this point, and the lines begin to move in the trend direction one by one: the lips line moves first, followed by the teeth line, and finally the jaw line. All of these lines begin to widen apart at this stage, and a trader is supposed to begin looking for the ideal entry level.
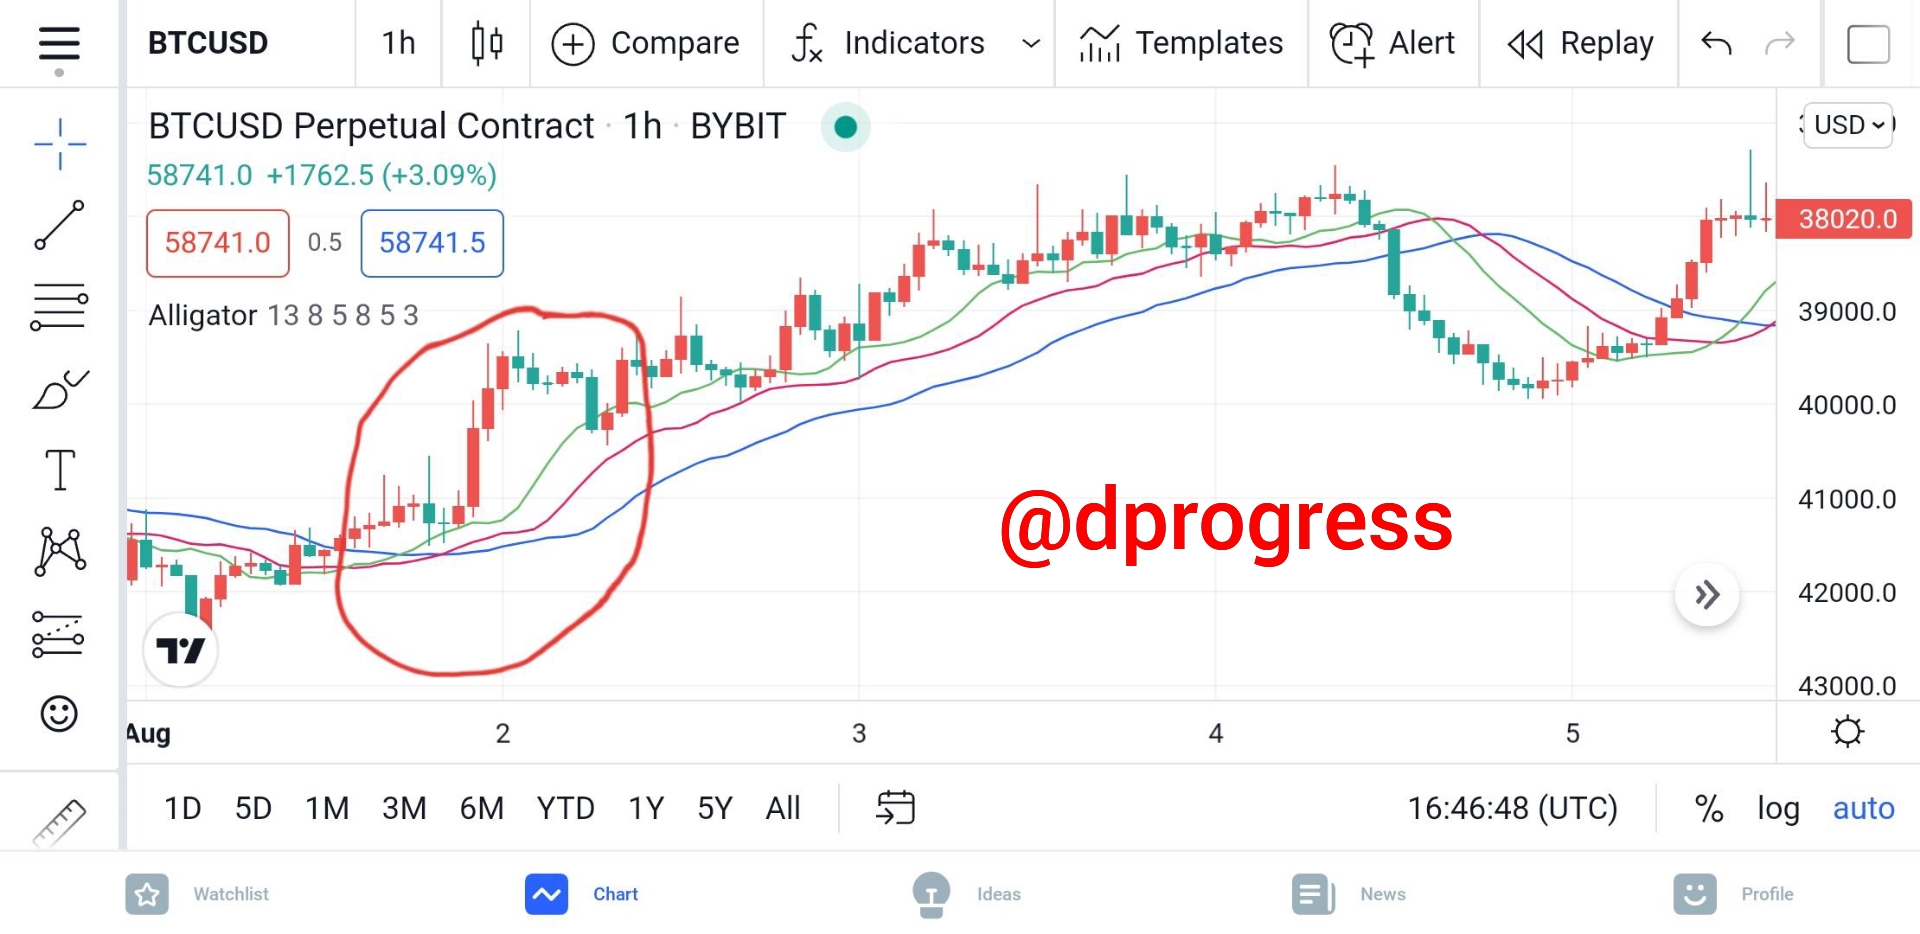
(3). Eating phase: This is the final phase of the cycle; the alligator is already eating and will continue to eat until it is completely satisfied. Although the green, blue, and red lines all point in the same direction, they gradually diverge. The chart shows a definite trend that can be bullish or bearish. It is necessary to trade exclusively in the direction of the market; if you attempt to trade against the trend, you risk losing all of your money.When the alligator has had enough to eat, it goes back to sleep, and the cycle repeats.
Question 4: Based on the layout of its three moving averages that make up the Alligator indicator, how can one predict whether the trend will be bullish or bearish (Screenshot required).
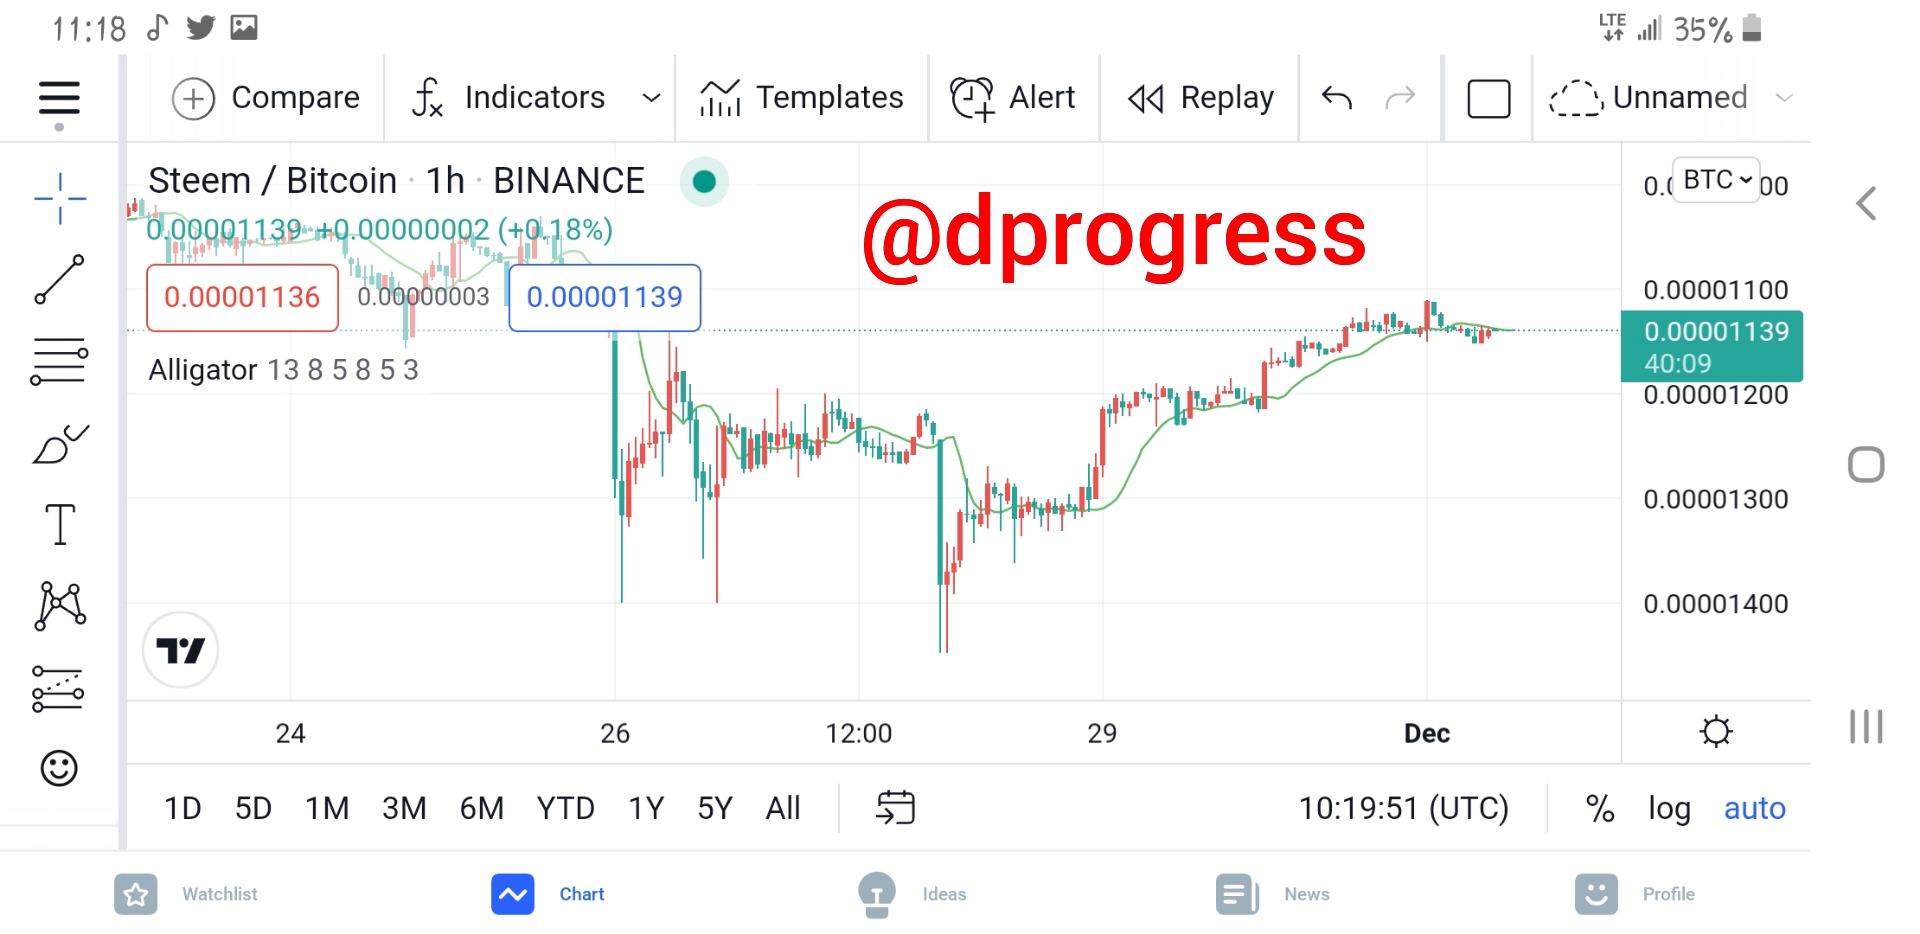
When a trend is ready to begin, the lip is the first moving average to move in the trend's direction, with the other two moving averages following suit.
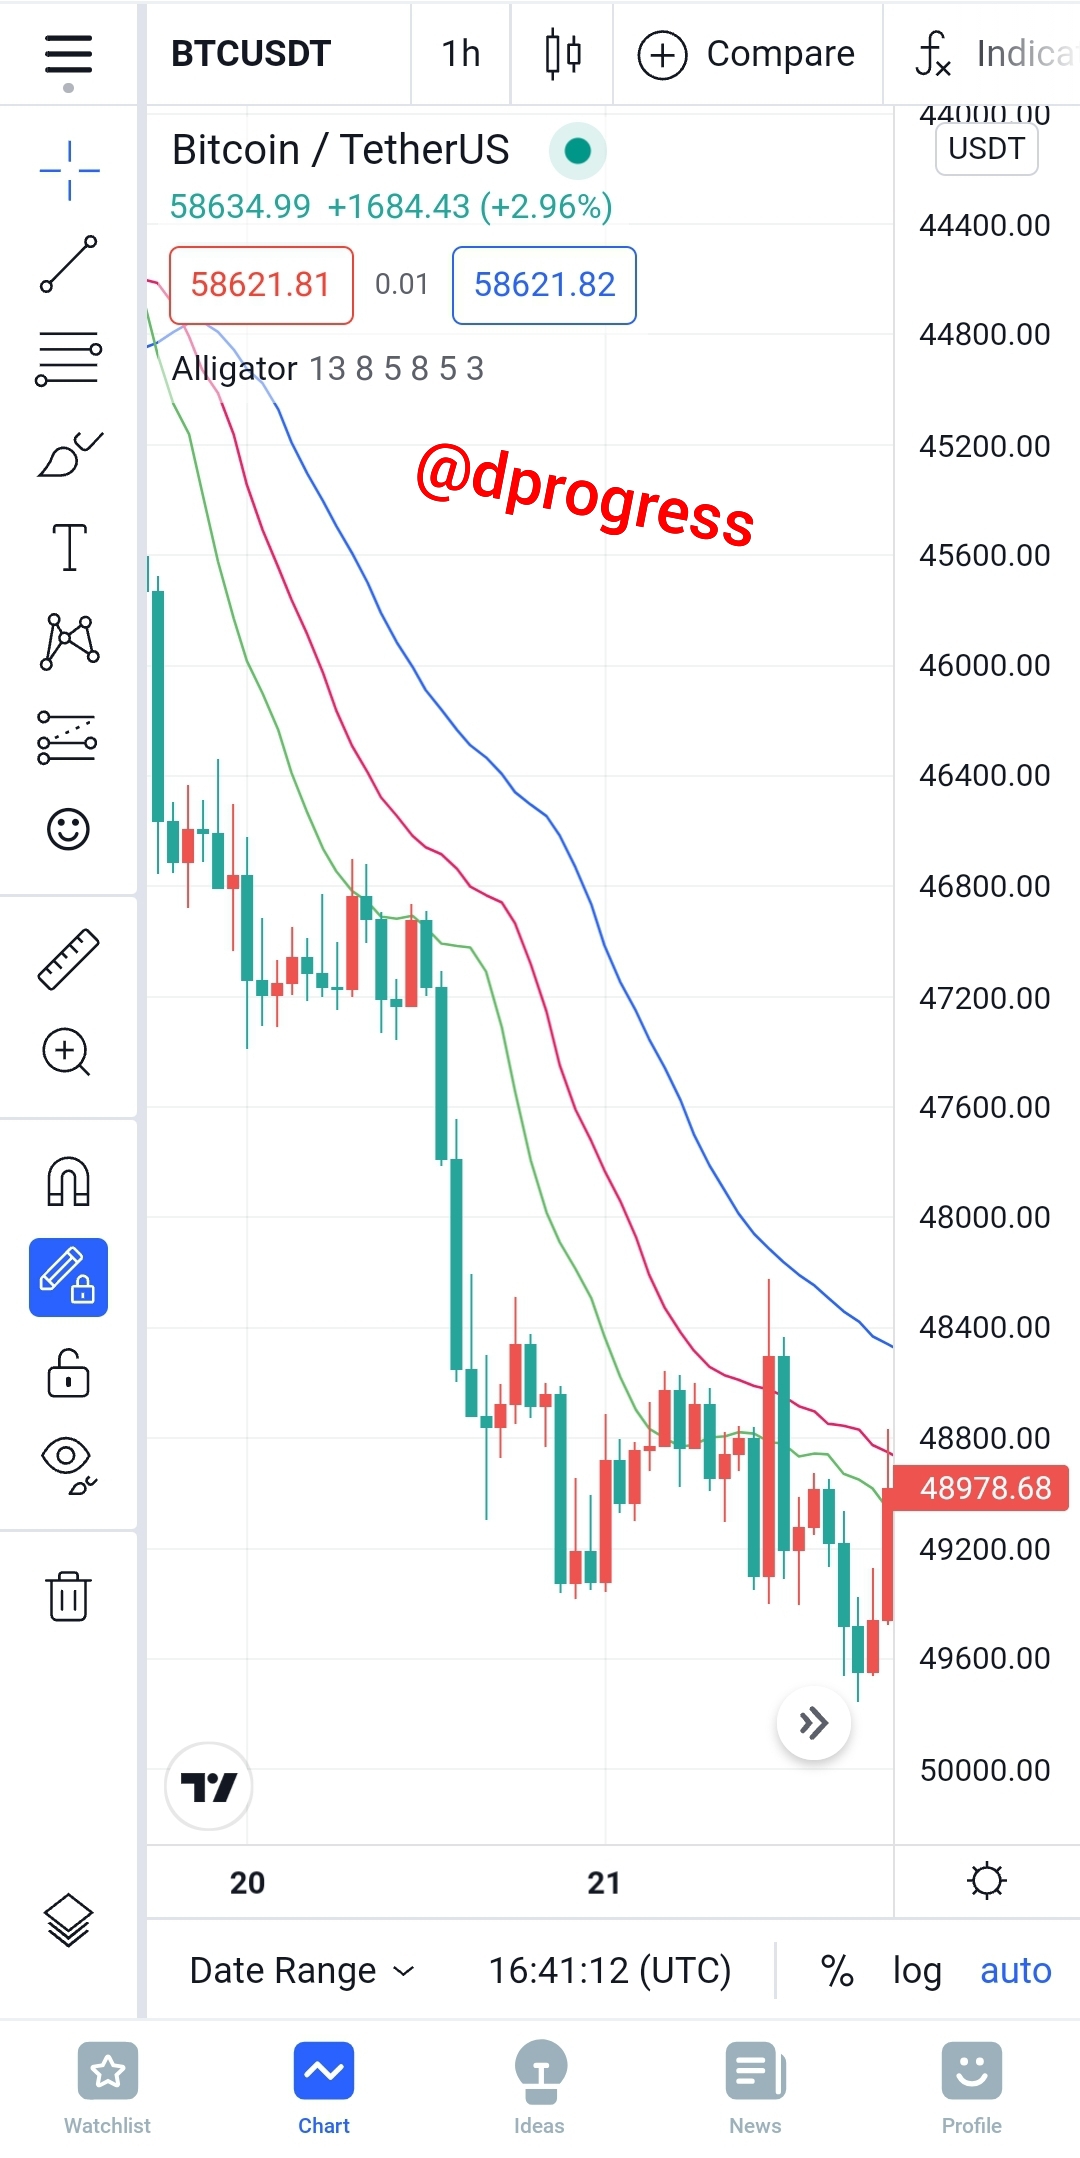
When an uptrend is set to begin, the green line will remain above the red line, and the red line will remain above the blue line. This indicates that the alligator's lips and teeth are away from the jaw and that the alligator is ready to devour, but in a bullish manner. This is the best time to buy, but you should buy early and be cautious of pullbacks that could push the lips close to the teeth.
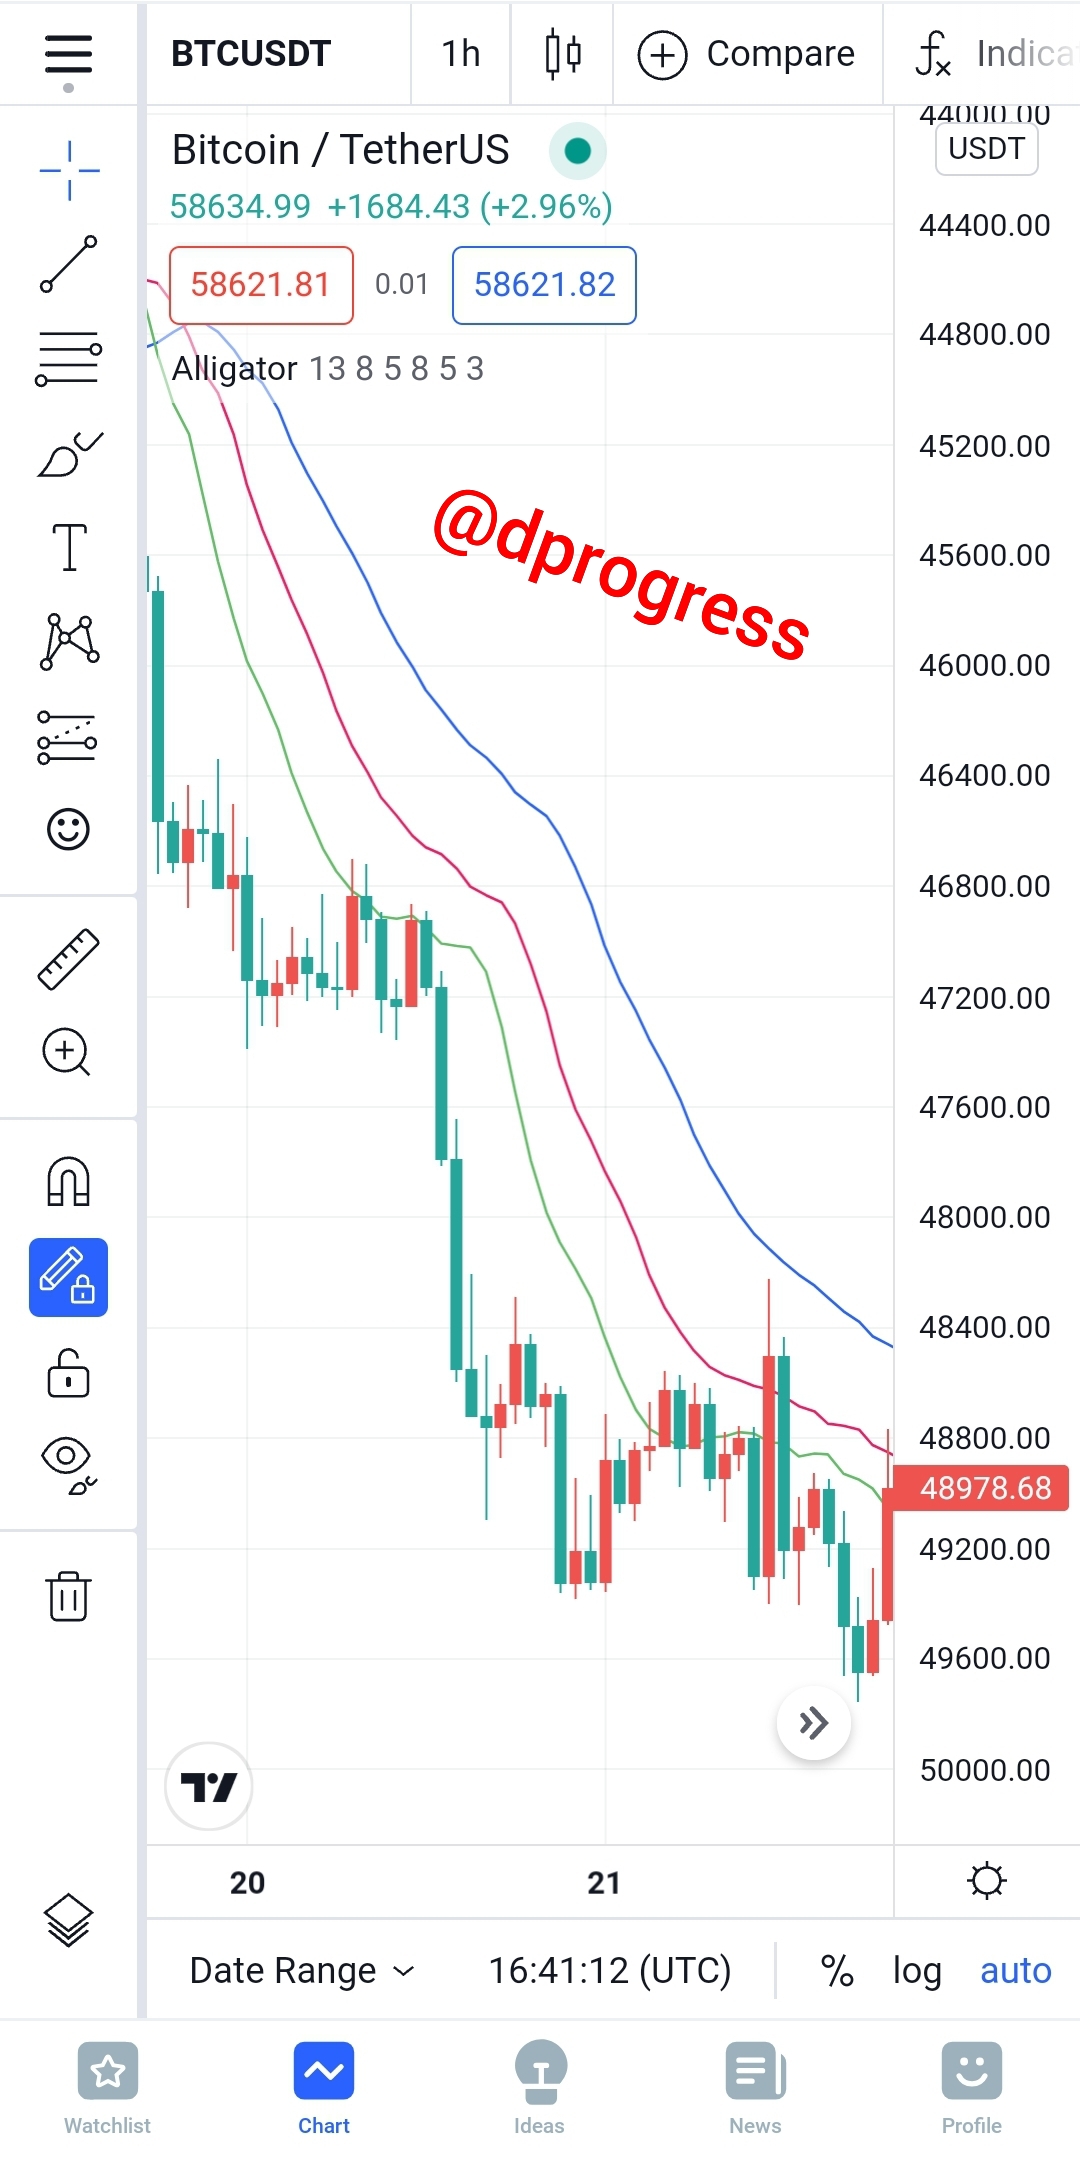
When the market is moving in a bearish direction, the green line remains below the red line, and the red line remains below the blue line. Because the alligator's jaw has opened and it has begun devouring, you should predict a downtrend when this happens. At this stage, you should start preparing to sell.
Question 5: Explain how the Alligator indicator is also used to understand sell / buy signals, by analyzing its different movements.(screenshot required).
The signals generated by this indicator depends on the position of the three lines:
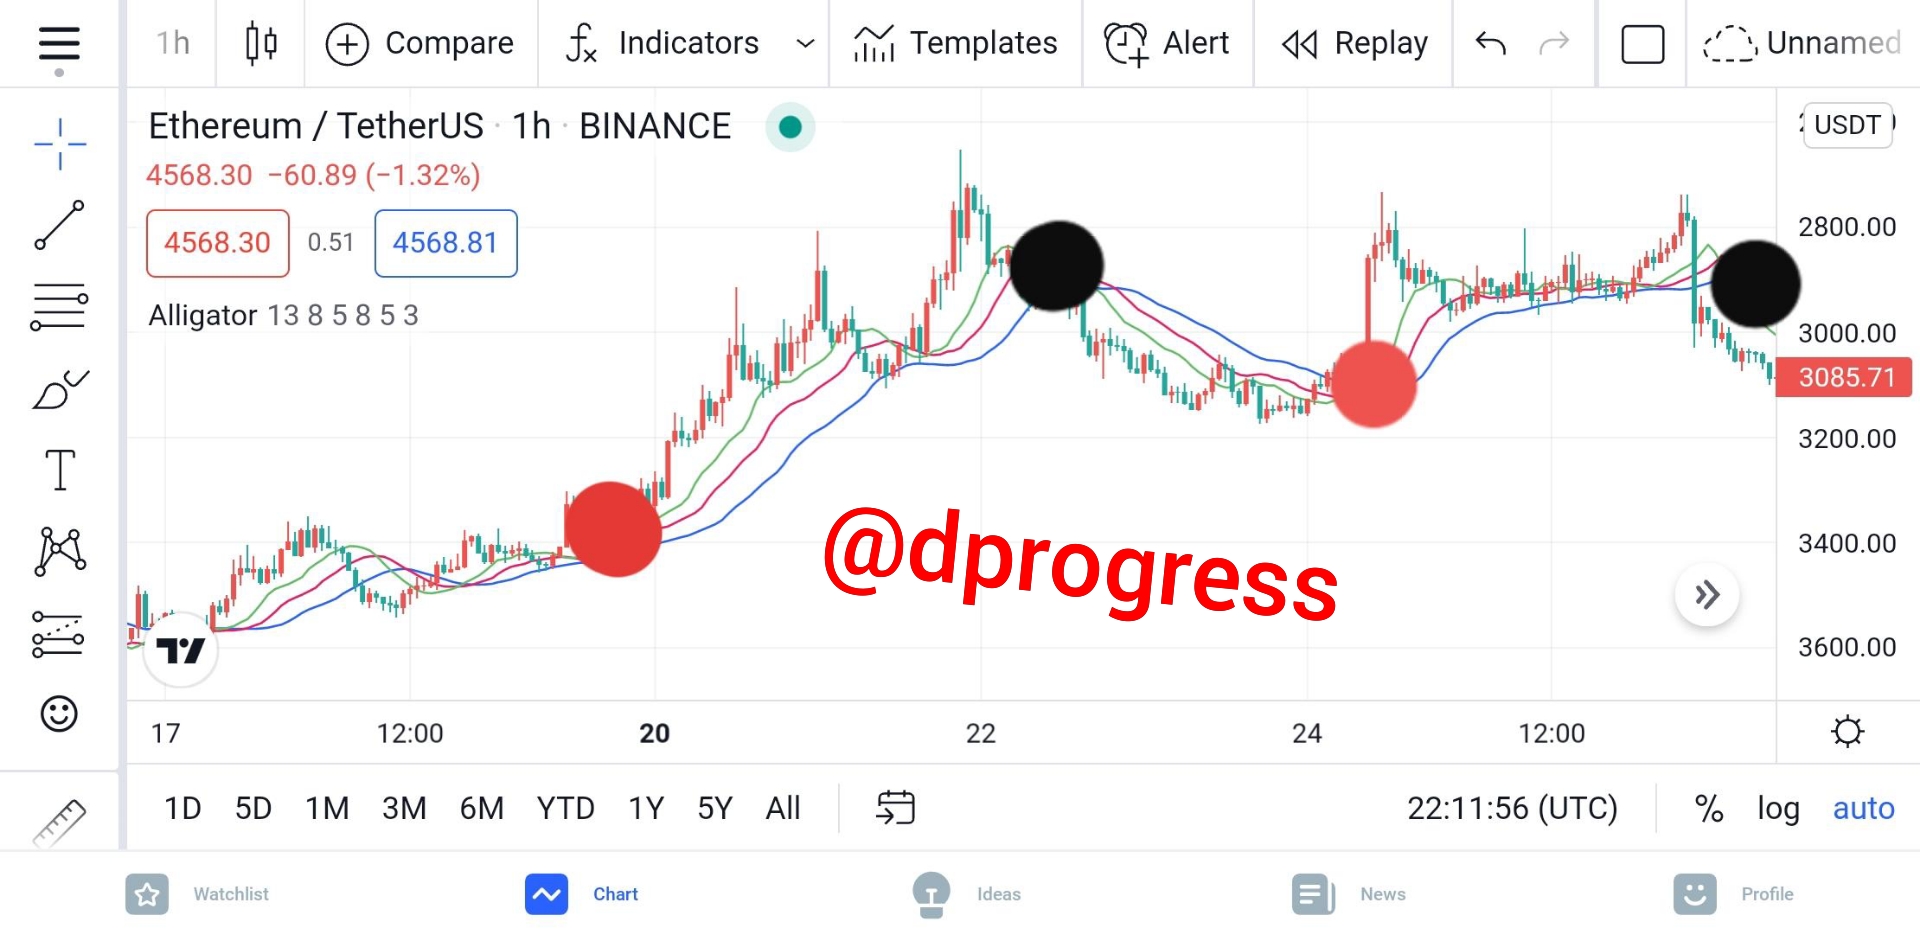
Buy signal: When using William's alligator indicator, it's important to use a candlestick chart rather than a line chart to identify the buy signal. When the green line passes over the other lines, the red line stays in the middle, and the blue line stays below, the buy signals emerge. This will indicate that an entry point for a trade following a bullish trend should be found. Setting a stop loss at the level of loss you can bear is recommended for good trade management.
Sell signal: Use the candlestick chart to identify a precise sell signal. When the moving averages cross below and are parallel to each other, it is a sell signal. It's a sell signal if the trend continues to be a bearish engulfing candlestick after a brief period.
The red dots represents where buy signal can be placed and the black dots represents where sell signal can be placed.
Question 6: Do you see the effectiveness of using the Alligator indicator in scalping trading style? Explain this based on a clear example.(Screenshot required).
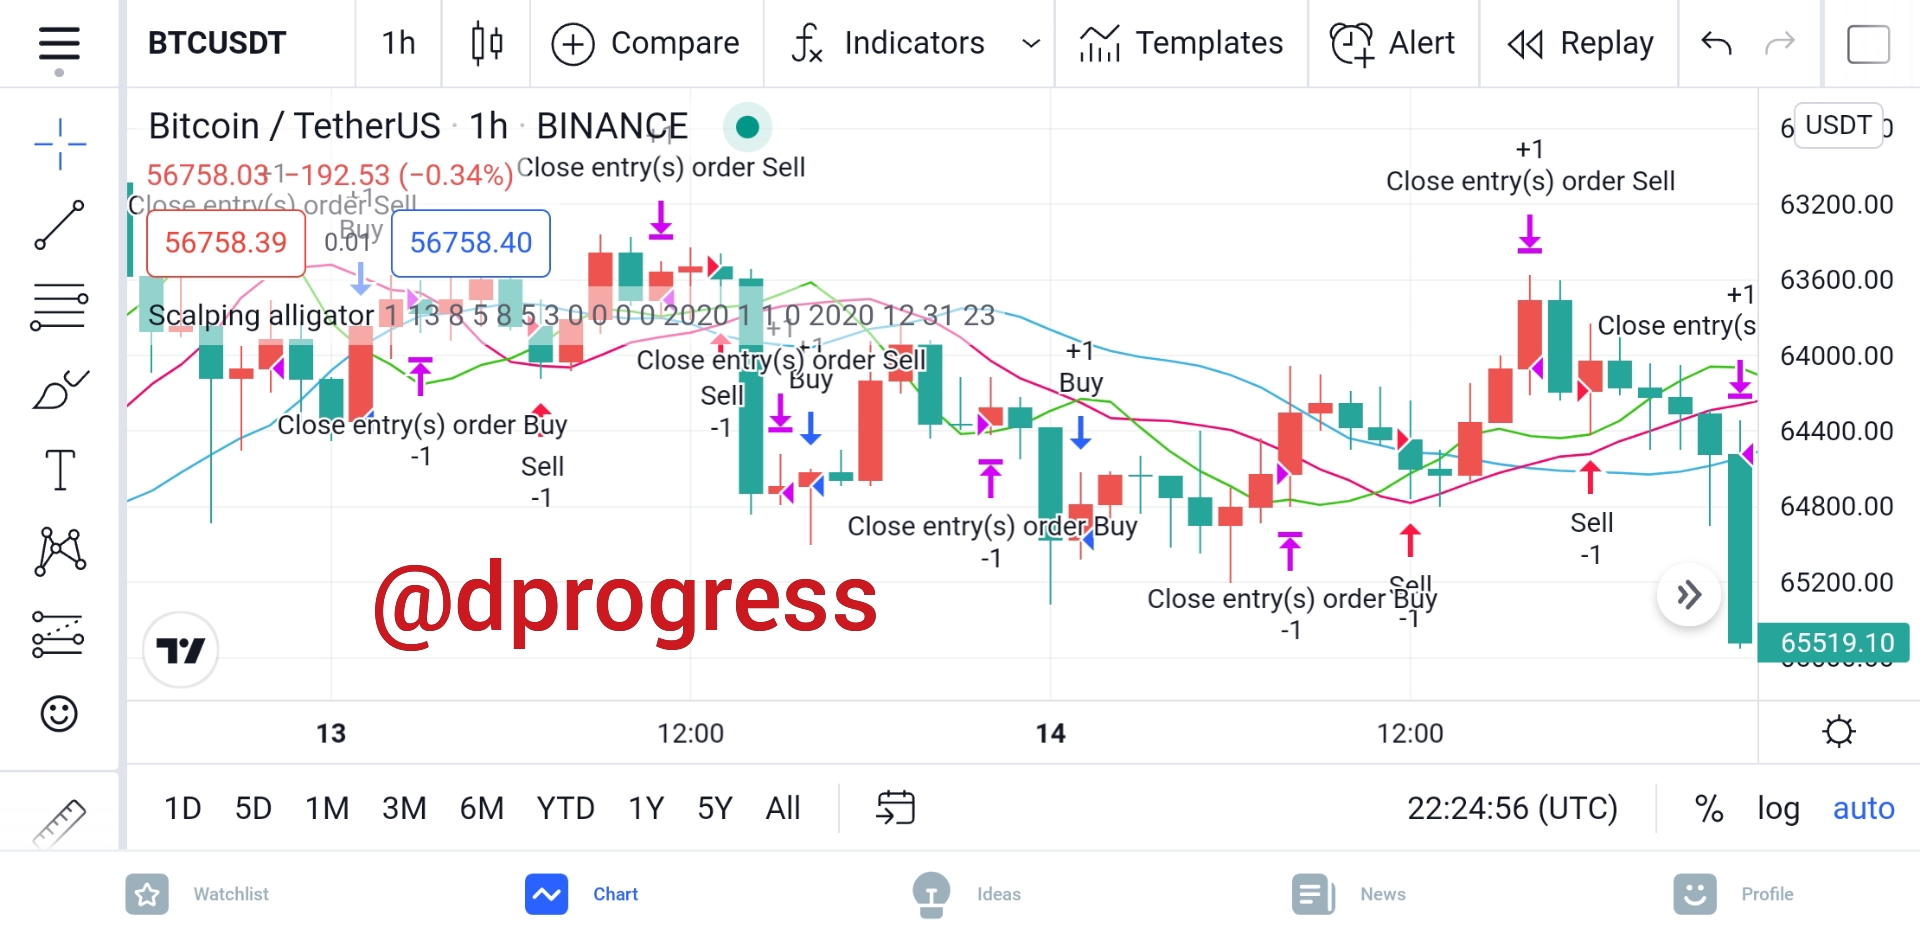
As I previously stated, when the three moving averages are entangled, the alligator is sleeping and the market is in a sideways direction with no apparent trend. Although trading is nearly difficult at this time due to the lack of a trend, there are traders who take positions during this time using a tactic known as range scalping.
For scalping, traders might apply the Williams alligator indicator as well as support and resistance lines. When a trend creates several successive candles that close outside of the support or resistance line, the range is broken.
Question 7: Is it necessary to add another indicator in order for the indicator to work better as a filter and help get rid of unnecessary and false signals? Use a graph to support your answer.
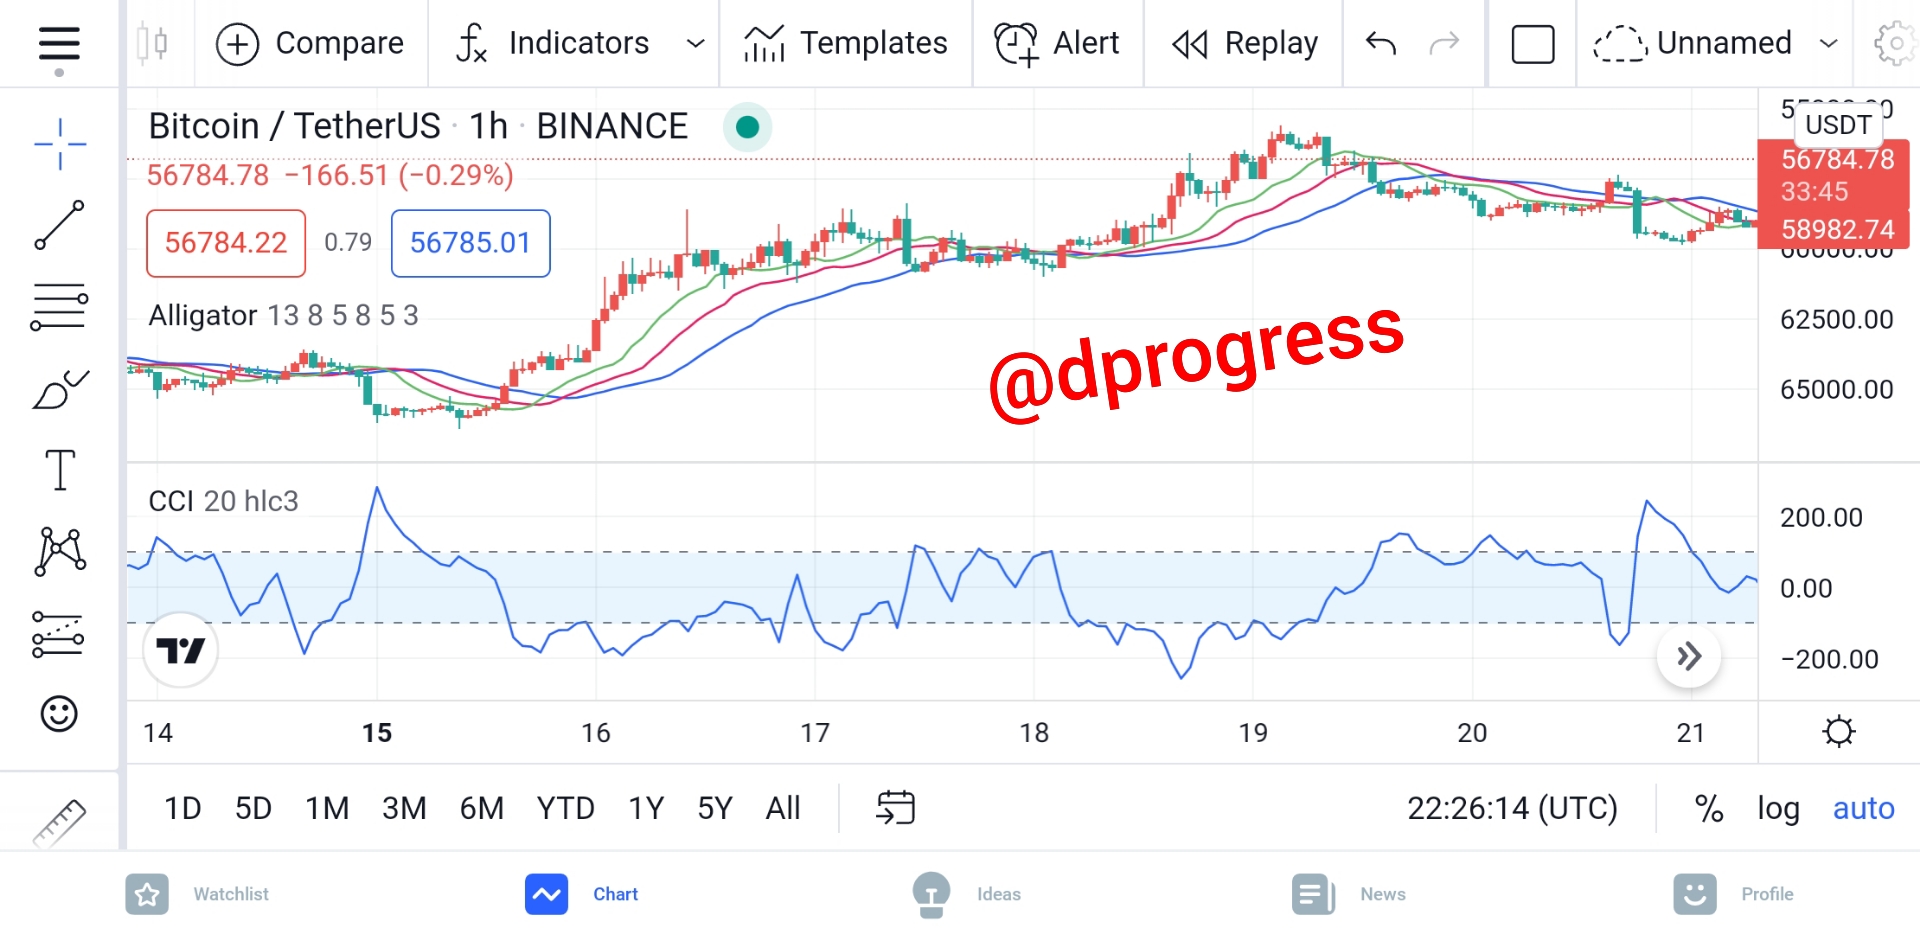
Williams alligator indicator, like other technical indicators, isn't flawless; it occasionally generates misleading signals, especially during the sleeping phase, and since two heads are better than one, it's best to pair it with another indicator.
An oscillator is the best sort of indicator to use with the indicator, and the Commodity channel index is the ideal one. The CCI analyzes price trend direction and strength, enabling traders to decide whether to enter or exit a trade, avoid taking a trade, or add to an existing position. These two indicators work well together. When the indicators behave in a certain way, it can be applied to offer trade signals.
Question 8: List the advantages and disadvantages of the Alligator indicator:
There are various benefits to using the Williams alligator indicator, some of which include:
- The alligator indicator is fantastic at spotting different market patterns; you can readily tell when the market is in a sideways, bullish, or bearish trend.
- The alligator indicator is simple to grasp because it has a user-friendly layout and is supported by most trading platforms.
- It's also useful for pointing out entry and exit points.
The following are some of the drawbacks of using these indicators
- If you want to trade profitably, you must use the indicator in conjunction with other indicators.
- The indicator produces erroneous signals, especially when the market is in a sideways trend.
Conclusion
Bill Williams created the Williams Alligator, a powerful and profitable technical analysis indicator. The indicators work on all financial markets, including stock, cryptocurrency, and FX.
It generates trading signals and is used to identify trends. It is recommended that you use it in conjunction with other indicators to make the best trading decisions.
Cc: @kouba01