MACD (Moving Average Convergence Divergence )
is a trend - following momentum indicator of oscillator type developed by Gerald Appel in the late 1970s.
MACD is used to measure following parameters:
- Direction of trend.
- Strength of trend.
- Reversal phases.
- Entry and exit points.
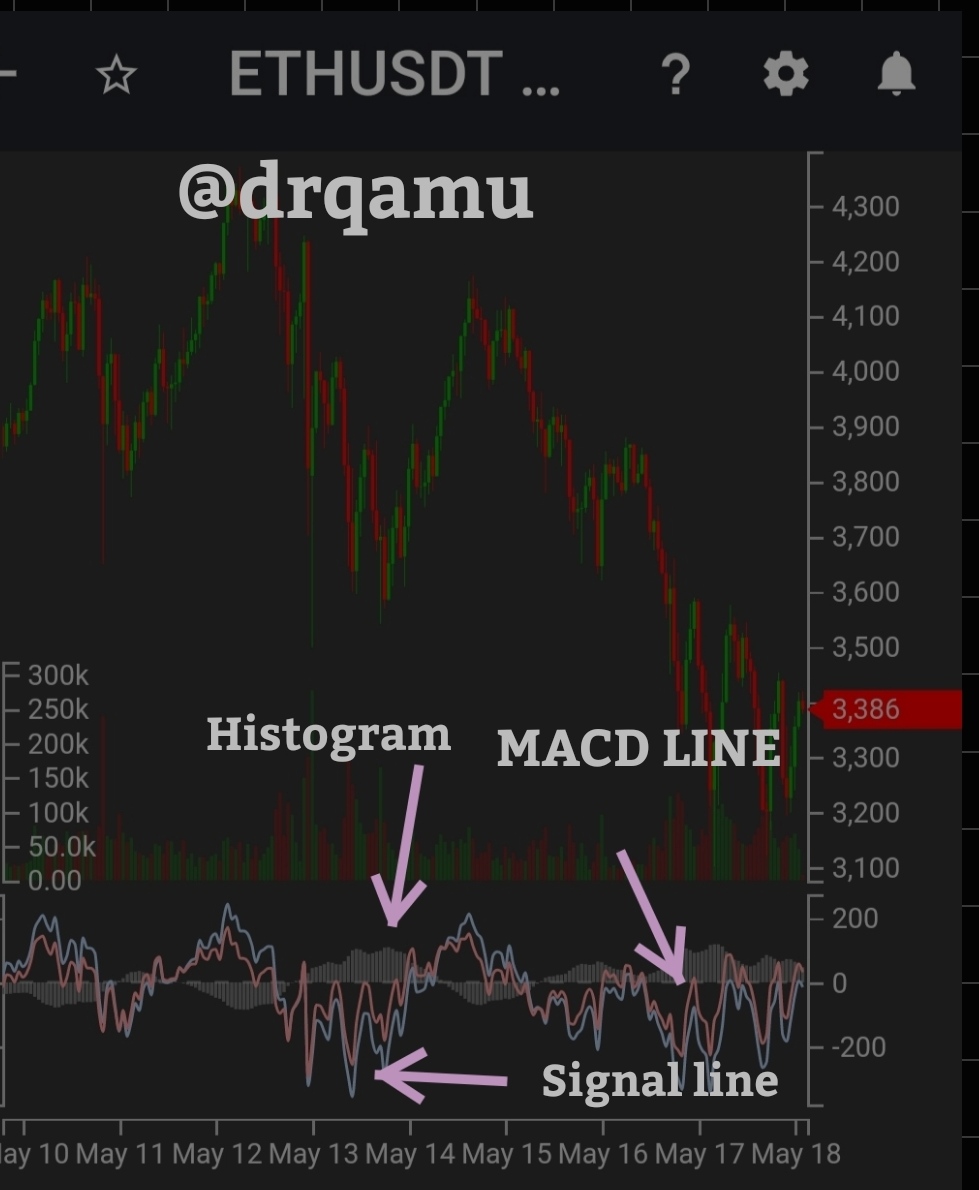
MACD indicator has following components :
- MACD Line .
- Signal line .
- Zero line .
- MACD Histogram.
MACD is calculated by taking differance of two exponential moving averages (EMAs) and the two EMAs that technical analysts have been using for calculation of MACD are 26 EMA and 12 EMA. so MACD line is calculated by subtracting 12 day EMA (short) from 26day EMA( Long).
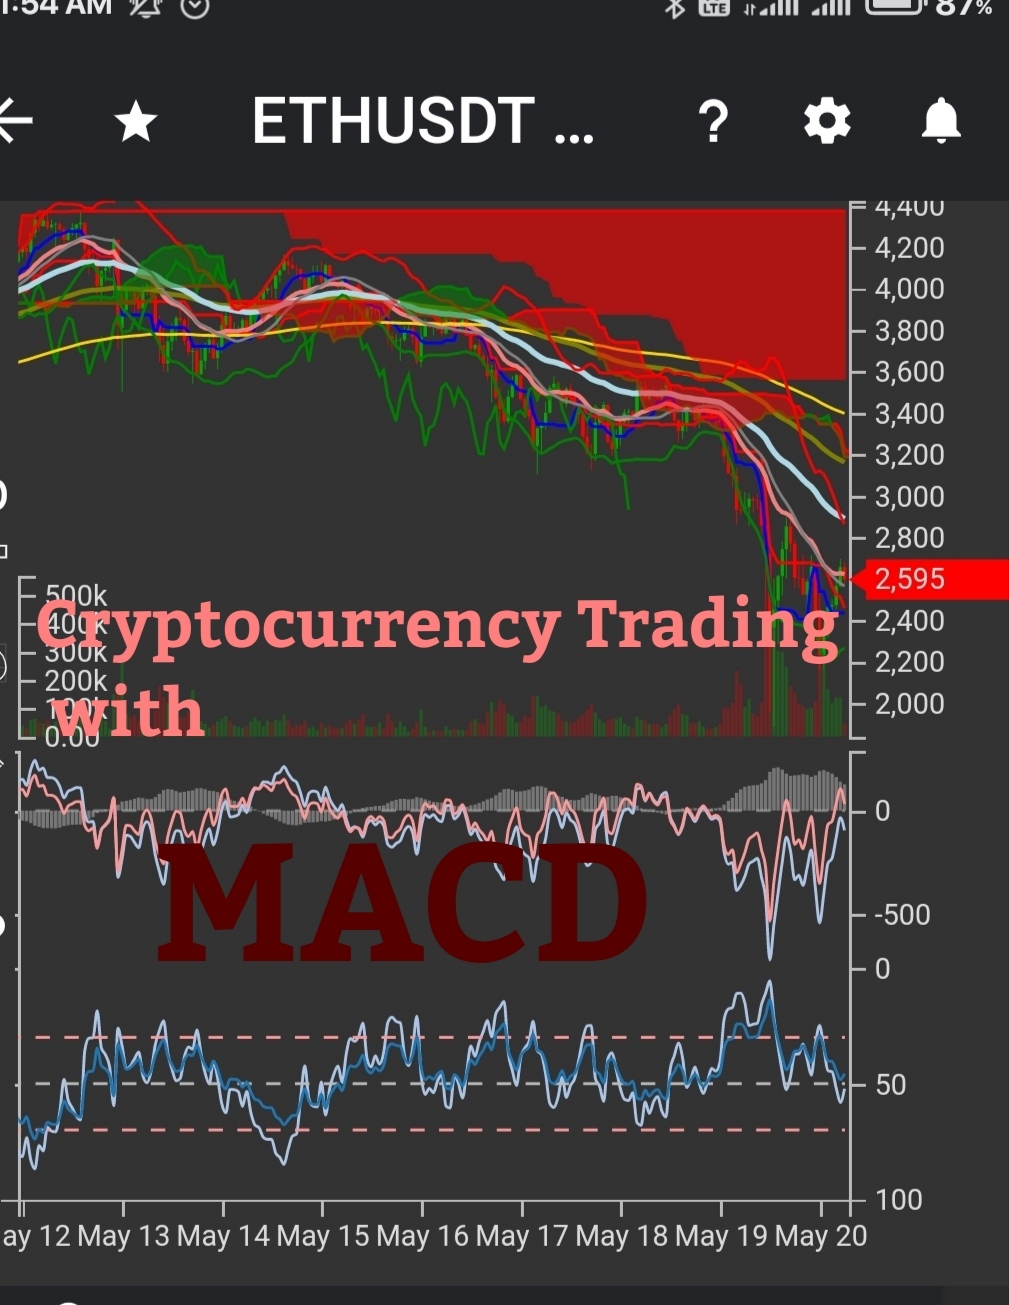
Example, look at above screen shot on 17 May, 12day EMA is 3700 and 26 day EMA is 3500. So MACD is 3500 - 3700 = -200. That is exactly there in MACD graph.
As we are now talking about exponential moving averages. Let me briefly mention, what it is. Exponential moving average is that type of average in which more weight is given to recent prices of an asset as compared to simple moving average in which an equal weightage is given to all prices for periods to be observed.
Signal line is 9 day EMA line.
MAcD histogram is a graphical representation of prices using vertical bars of different lengths between MACD line and signal line.
As for question of using MACD for trading cryptos is concerned , i would say MACD is a good indicator but is not absolute. So we will have to look at it along with some other indicators like RSI, support, Resistance etc. As such MACD is better than RSI, when compared individually. It is because MACD is basically a combination of indicators. So any signal by particular parameter of MACD can be supported by other parametre. Example, if MACD line crosses signal line from below upwards, it indicates bullish trend. To confirm we can look at Histogram which will be showing increasing bullish bars.

How to add the MACD indicator to the chart, what are its settings, and ways to benefit from them? (Screenshot required)
Let me demonstrate it with the help of tradiny app. Open the tradiny and from main page of app, click on top left corner and a drop down menu with cryptos will appear. Select the pair of your choice and refresh the main page.
Price chart of trading pair will load.
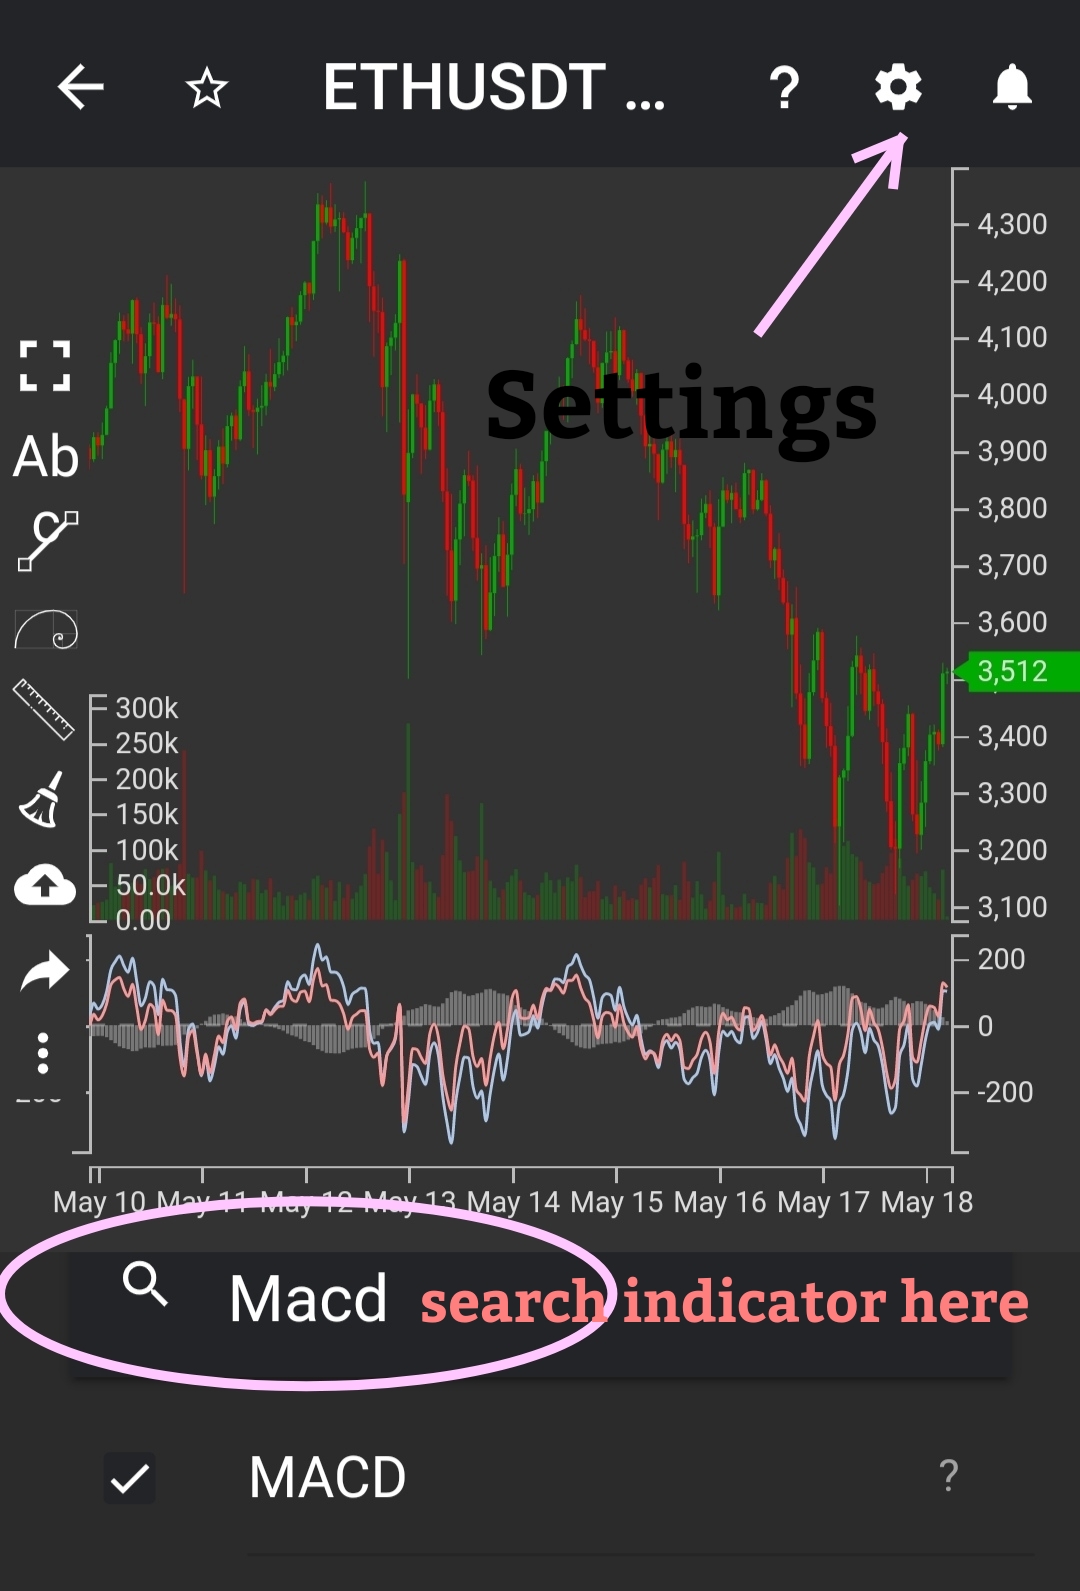
Just below the the chart, there is option " signs". Click on it and a list of indicators will load.
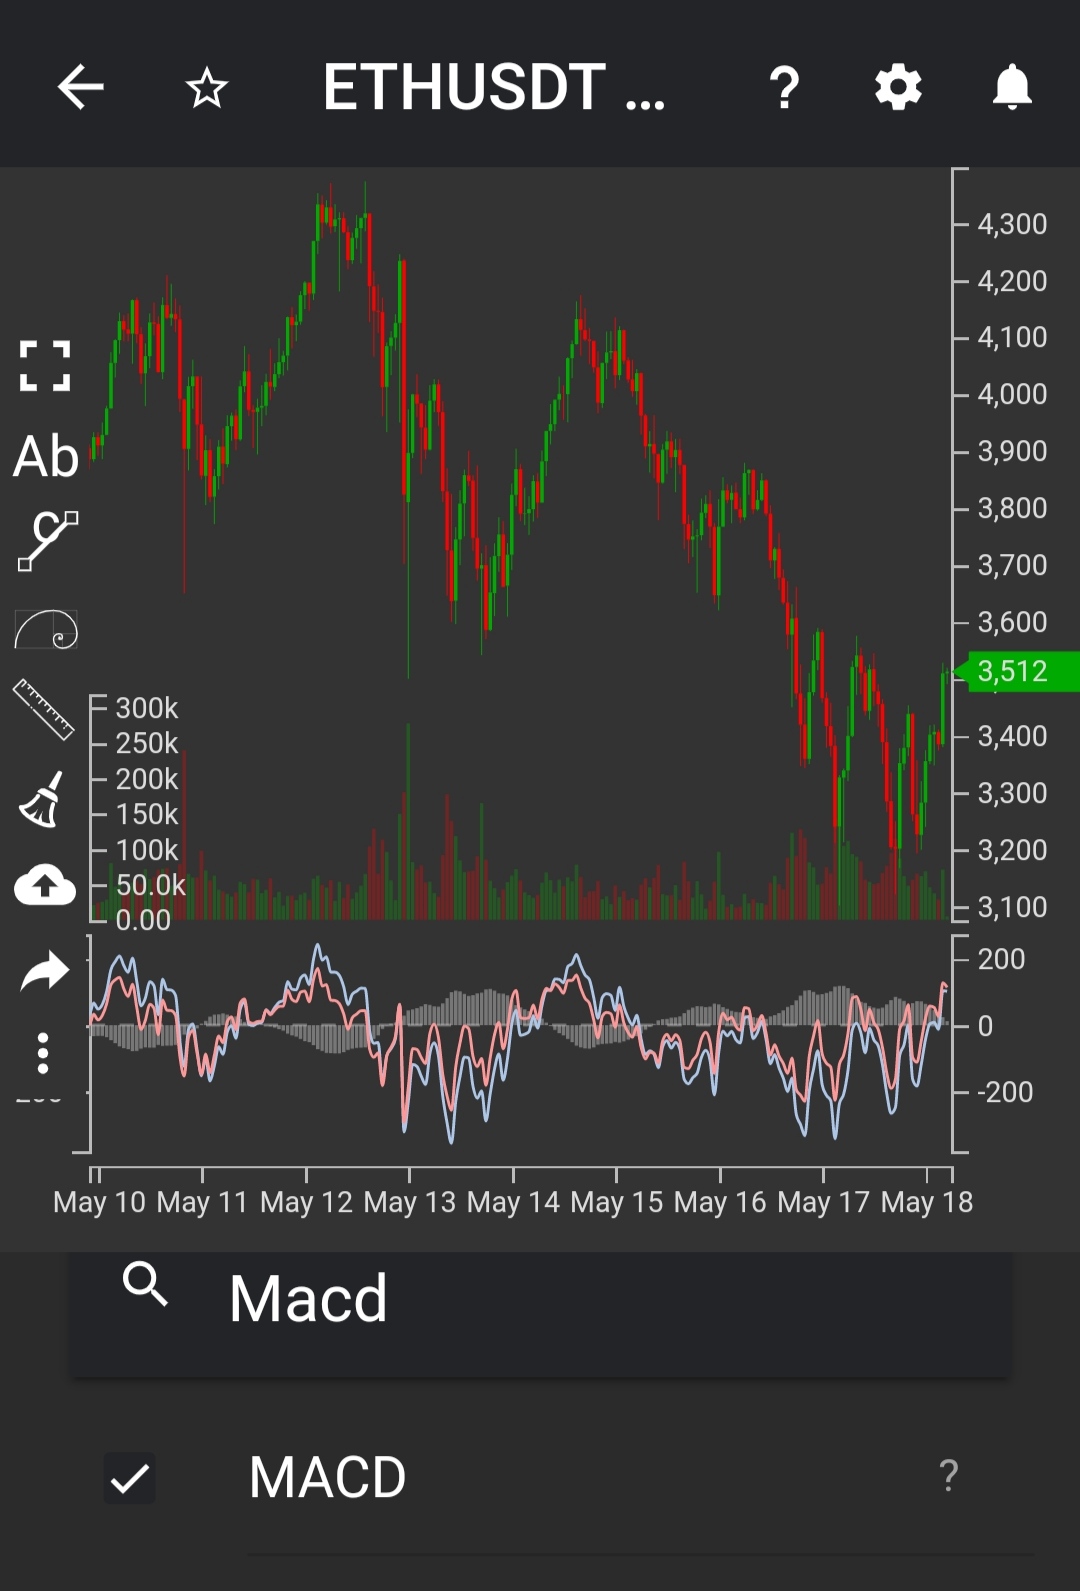
We can also search for indicator, say MACD.
MACD will be loaded just below the chart.
We can add multiple indicator to the same chart.
Next at top right corner, look for settings logo. Click on it
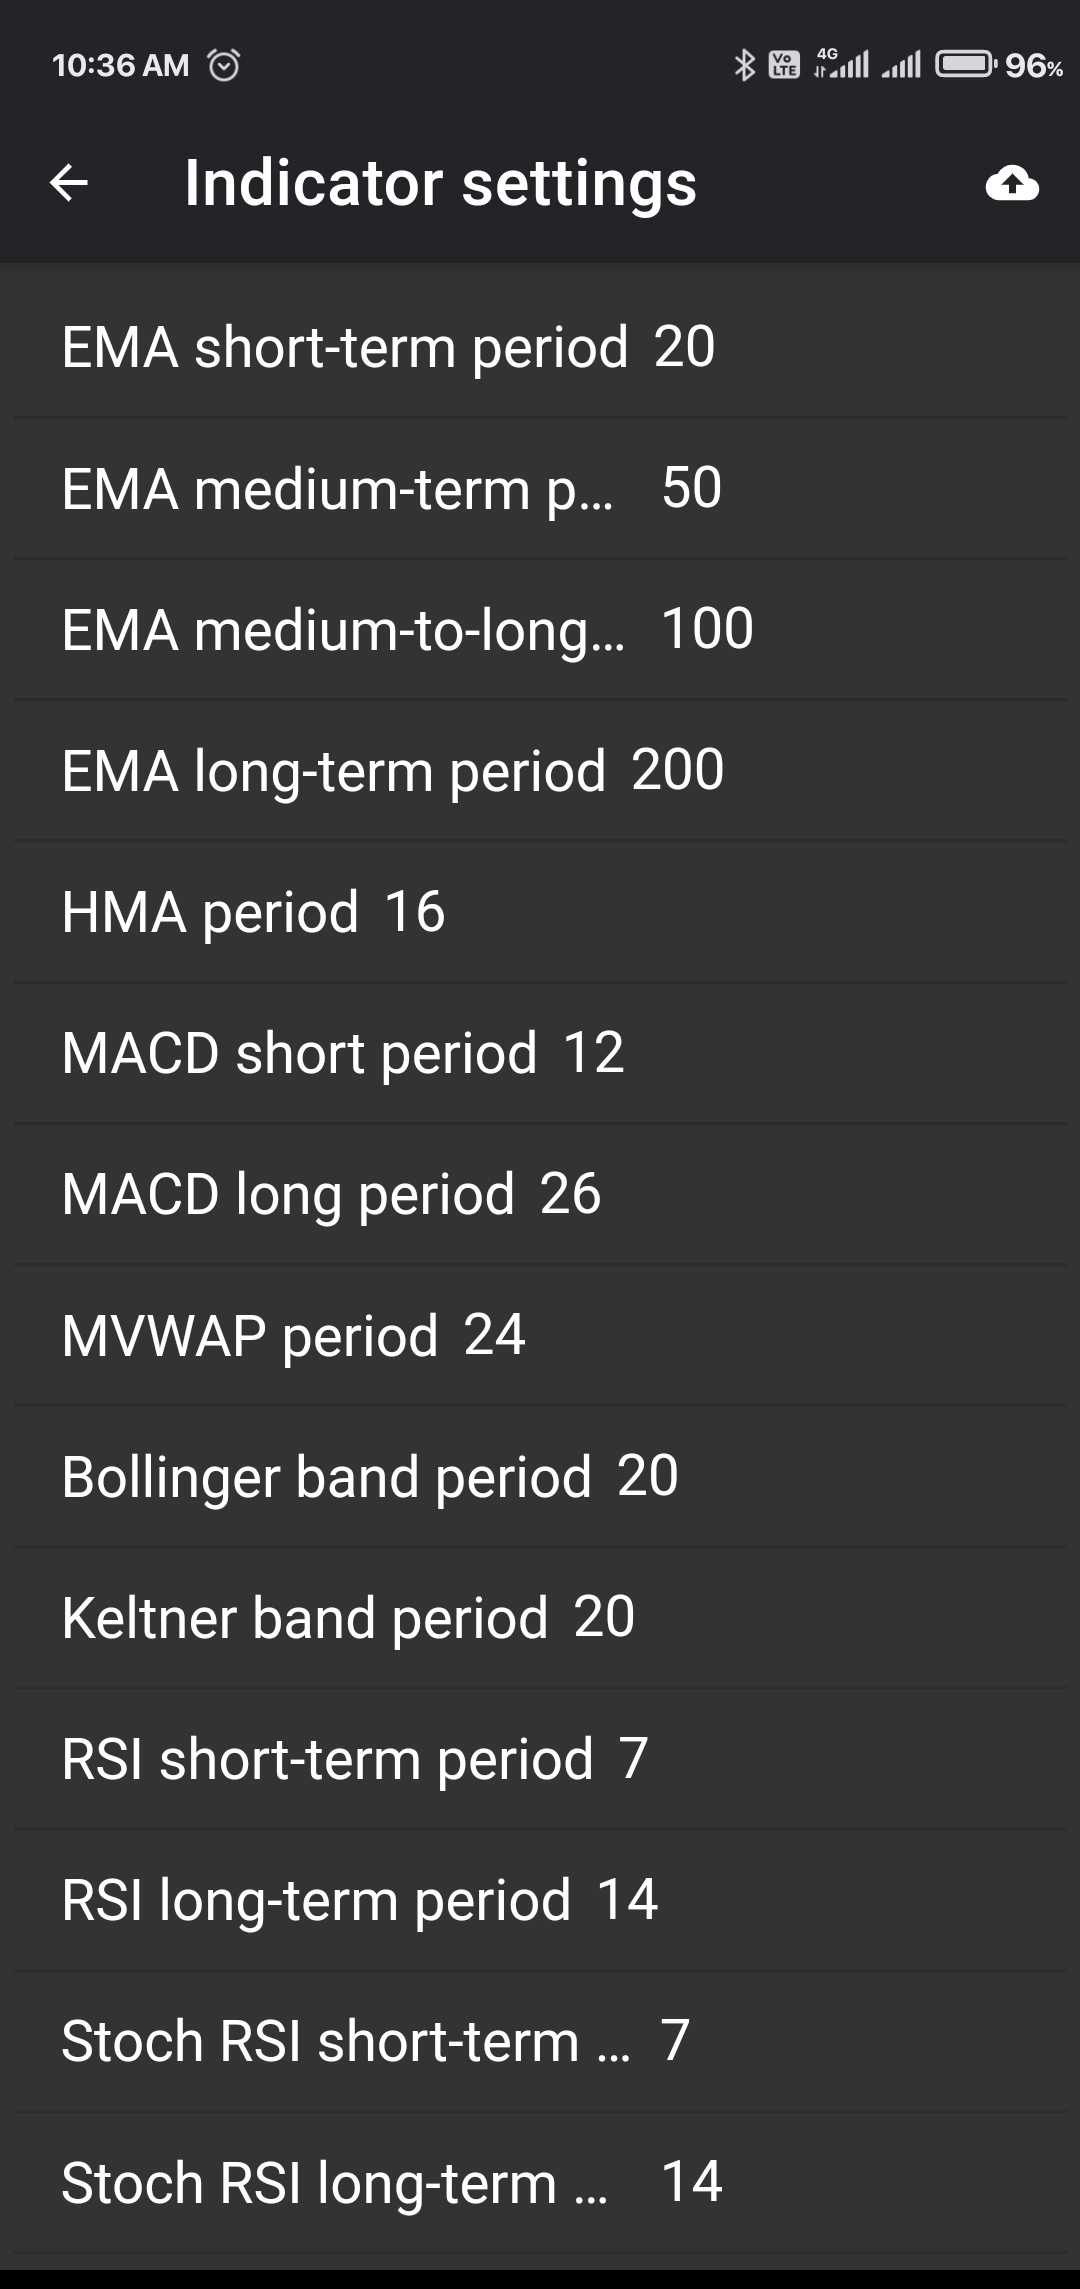
A list of setting will appear like short EMA, Long EMA, time frame. Select as per your needs.
Benefits of configuration.
MACD is differance between short and long EMA. And at the time of configuration, we have to select accordingly. For MACD, we have to select EMA 12 and EMA 26. Similarly, we have to select time frame over which we want to analyse. Also the premium Version provides option to choose color of MACD Line , signal line and color of bearish and bullish histogram bands as well. So configuration has benefit of providing free will to users as per their convienence and trading experience so as to yield good results.
How to use MACD with crossing MACD line and signal line? And How to use the MACD with the crossing of the zero line?
Crossing of MACD line and Signal line.
Here the clue for traders is to look for the movement of MACD Line. If the MACD line moves above the Signal line, it indicates that the market is going to enter into the bullish phase and traders rush to buy the asset, so as to take advantage of the forthcoming bullish market . On the contrary, if the MACD Line moves below the Signal line, it indicates that the market is going to enter into the bearish phase , so it is a signal for the traders to exit so as to avoid loss from the forthcoming bearish market.
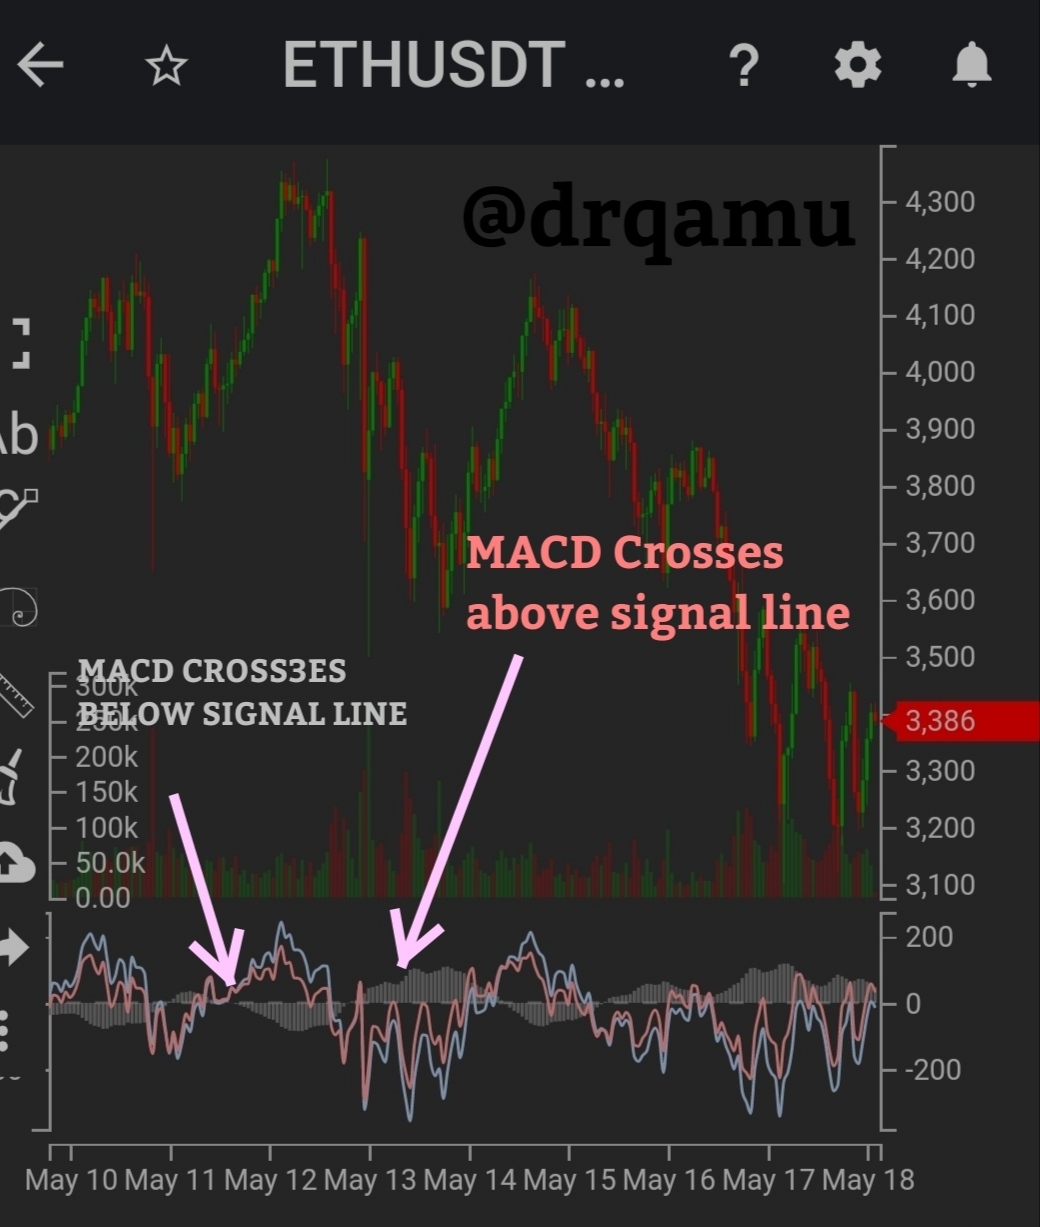
Look at image above , ETH/USDT, i have labelled it. At ist point ( left) , MACD crosses below signal line and look at corresponding price chart, price going down. Similarly look at second arrow, MACD crosses above signal line and corresponding price goes up.
Crossing of MACD and Zero line.
Again look where MACD line goes. If MACD lines crosses zero line from below upwards, it means the market is going to enter bullish phase. So it is a signal for traders to buy the asset and take the advantage from the forthcoming bullish market. On the contrary , if the MACD line crosses Zero line from above downwars , it indicates that the forthcoming market is going to be bearish and therefore signals the traders to exit from the market to prevent forthcoming loss.
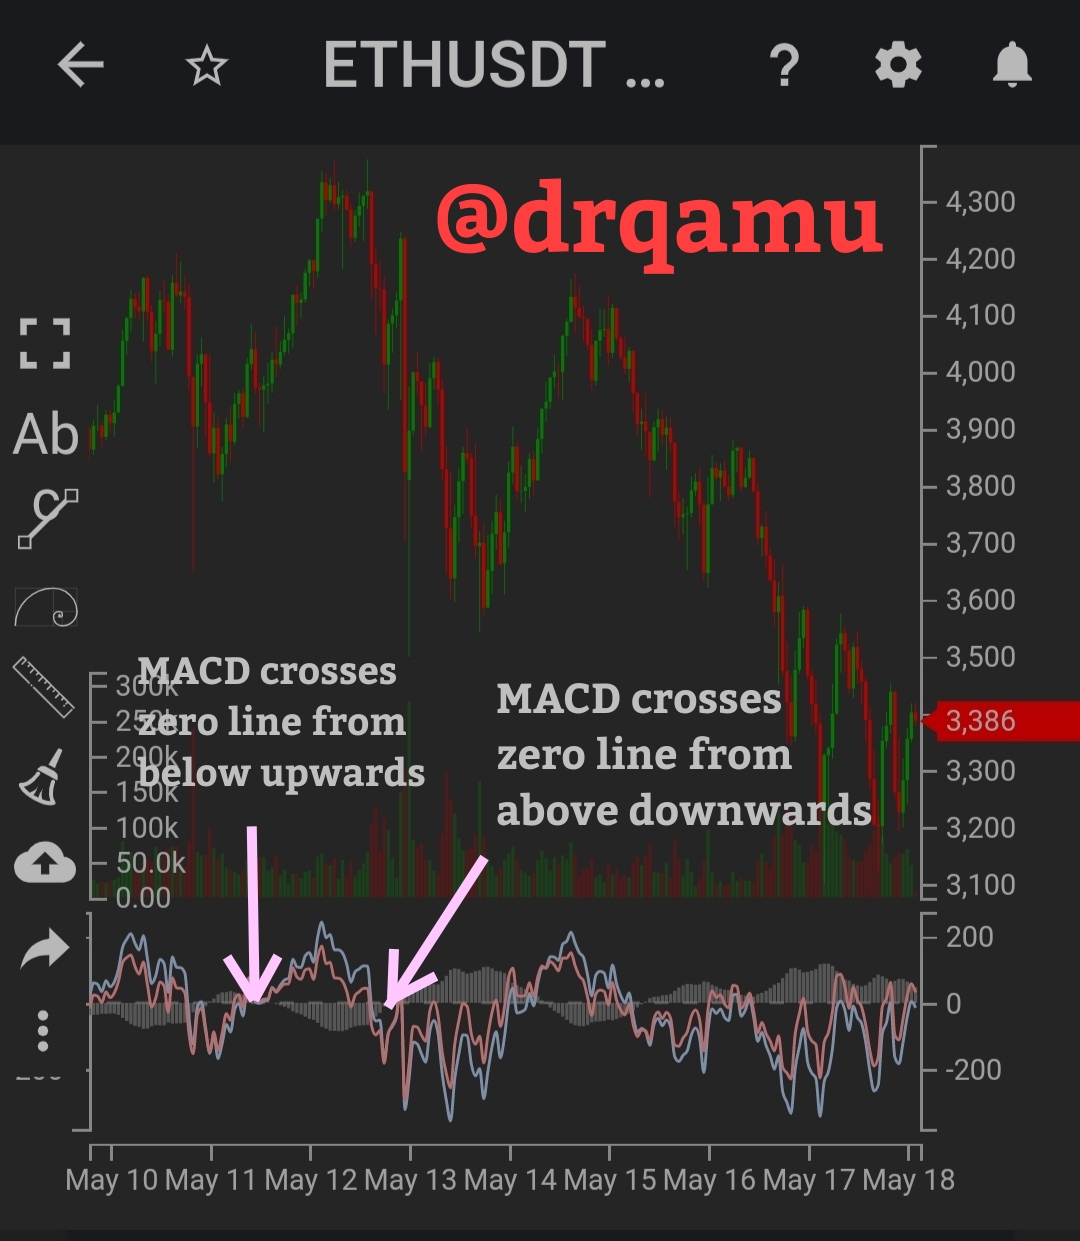
Look at above image, i have marked two arrows, left one is where MACD crosses from below upwards amd corresponding price goes up amd right arrow shows MAcD going from above downwards across zero lime amd corresponding price goes down. Hope it is clear.
How to detect a trend using the MACD? And how to filter out false signals? (Screenshot required)
MACD ia not a single indicator. It is basically collage of indicators under a banner of single indicator. So all these individual indicators within MACD can be used for identifying the trend like crossing of MACD and signal line ; crossing of MACD and zero line. The problem with these crossing is that they don't exactly synchronise with the price change but there is slight lag. The working of these crossovers have been discussed above. Still we are left with the most important component of MACD which can help in spotting trend much before crossovers signal and that is MACD HISTOGRAM. Let's see what it signals.
When the bullish trend in the market is increasing, the bullish bars in the histogram starts becoming longer and when the bullish trend decrease, bullish bars become smaller and collapse towards baseline. On the contrary, when bearish trend in the market grow strong , the berrish bars on the hInstogram grow longer and longer and when the bearish trend decreases, the bearish bars become shorter and collapse towards the baseline. So by looking at the slope of histogram, we can actually predict where the market is going. And when it collapse towards baseline, it signals forthcoming trend reversal.
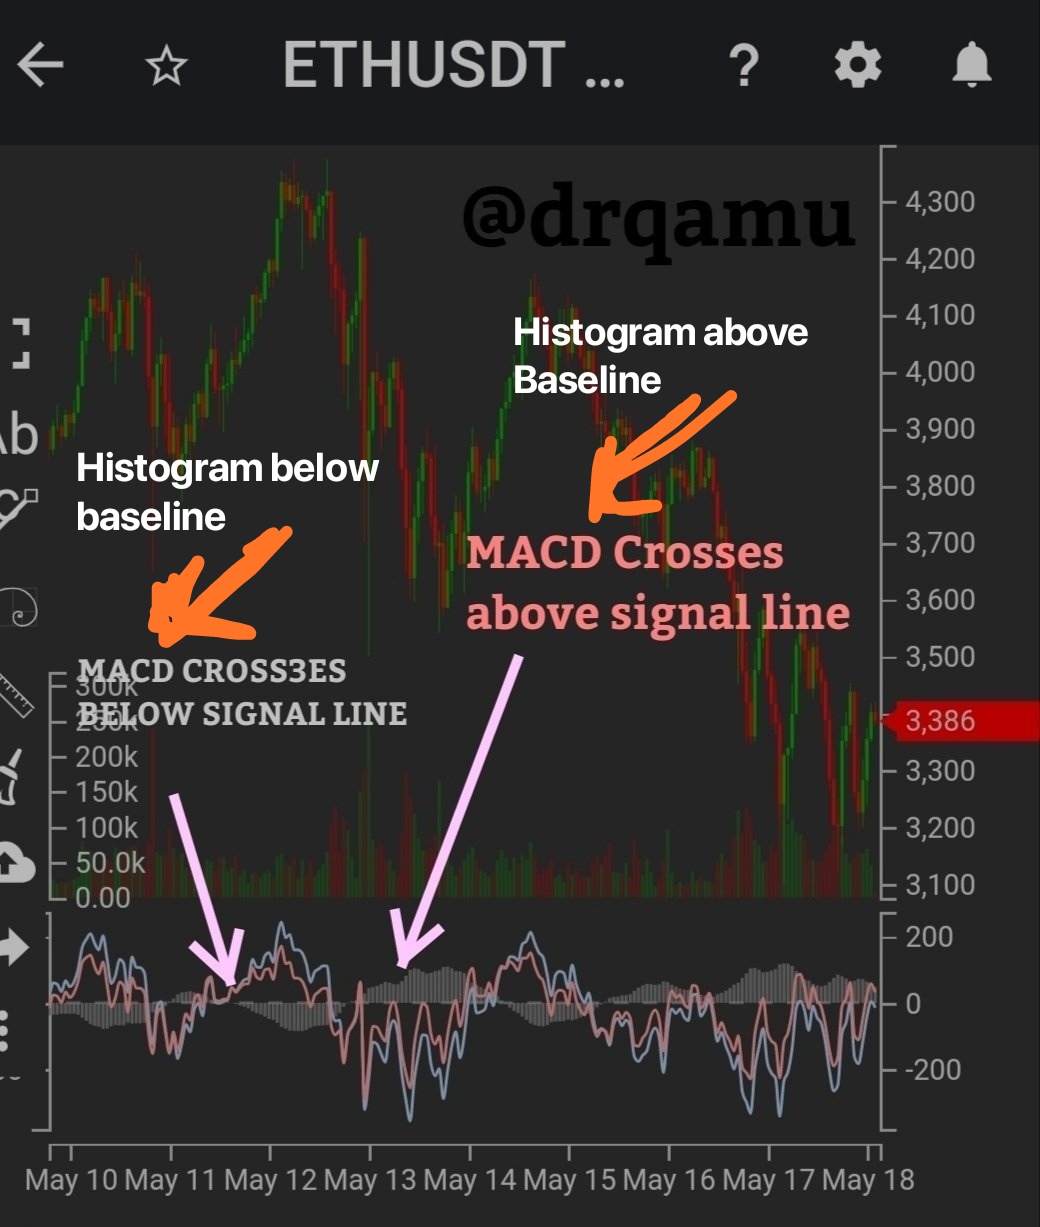
We can further anayse it this way , more the distance between the MACD line and signal line, more will be the slope of hIstogram and lesser the distance between two lines, lesser will be the slope of histogram. Another important point to understand is that, if MACD line crosses above the signal line, the histogram will be formed above the zero line and if it crosses below the signal line, histogram will be formed below the baseline.
False signal filter out.
Nothing is absolute and so is not MACD. It sometimes give false signals. False signals in case of MACD refers to anticipation of trend reversal with no actual reversal in practice.it can be false positive or false negative. One more problem with MACD is that it doesn't even sometimes predict real reversals. The easy way to filter out these signals is to look at price chart in concordance with MACD. If MACD shows bullish divergence ( Price of assets makes lower lows but MACD stuck at higher low) , look at price charts, if it is making lower lows than it is signifies potential and real trend reversal and same holds true for bullish divergences too.
Bullish divergence
One more strategy is not to look at MACD in isolation, take other indicators like RSI, into consideration too. That may also help.
.
Least but not last factor is to look at price chart in different time frames and compare the changes.
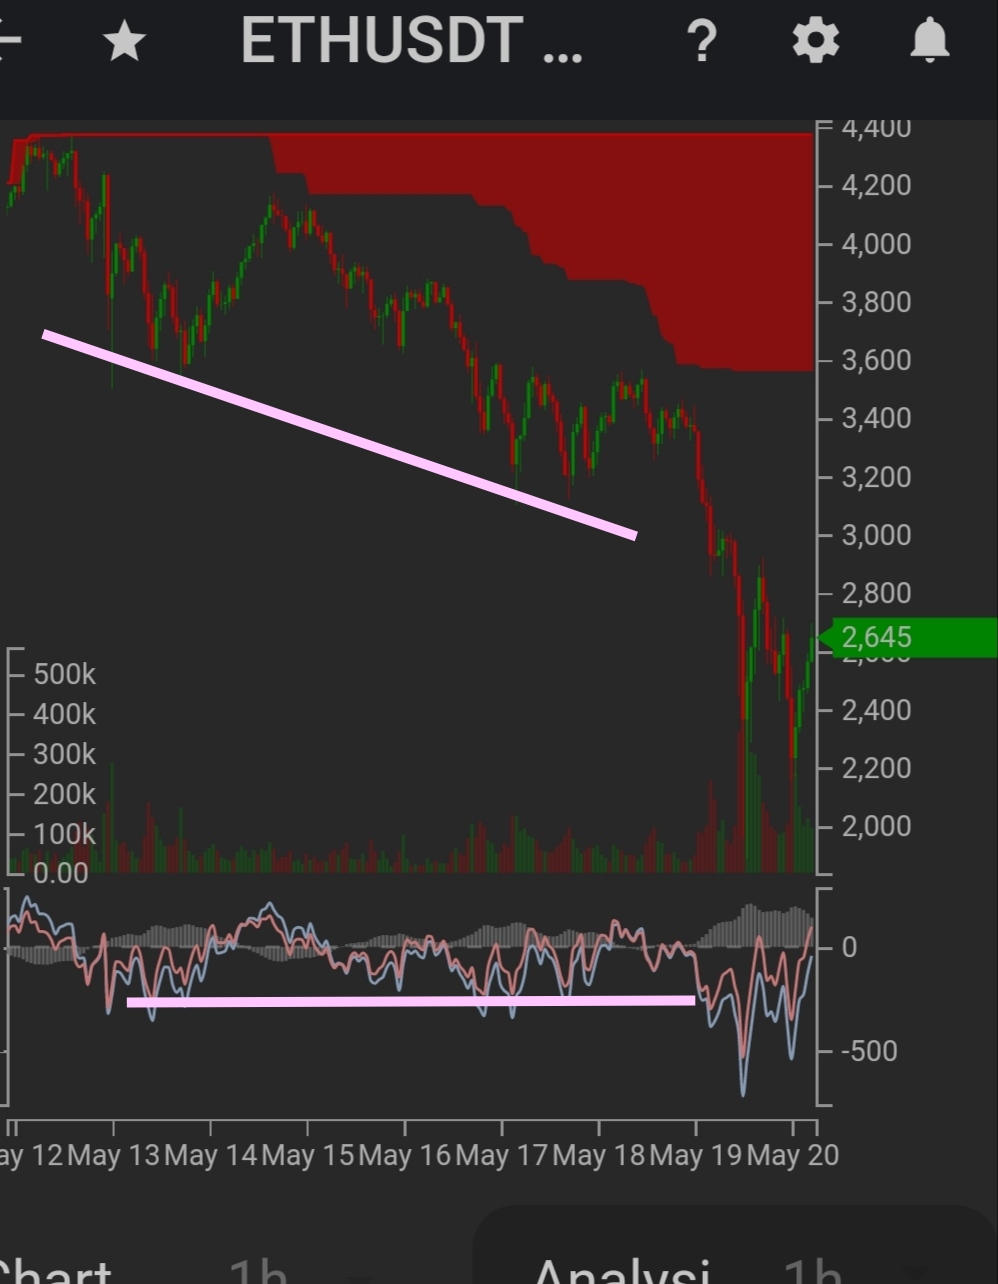
How can the MACD indicator be used to extract points or support and resistance levels on the chart? Use an example to explain the strategy. (Screenshot required)
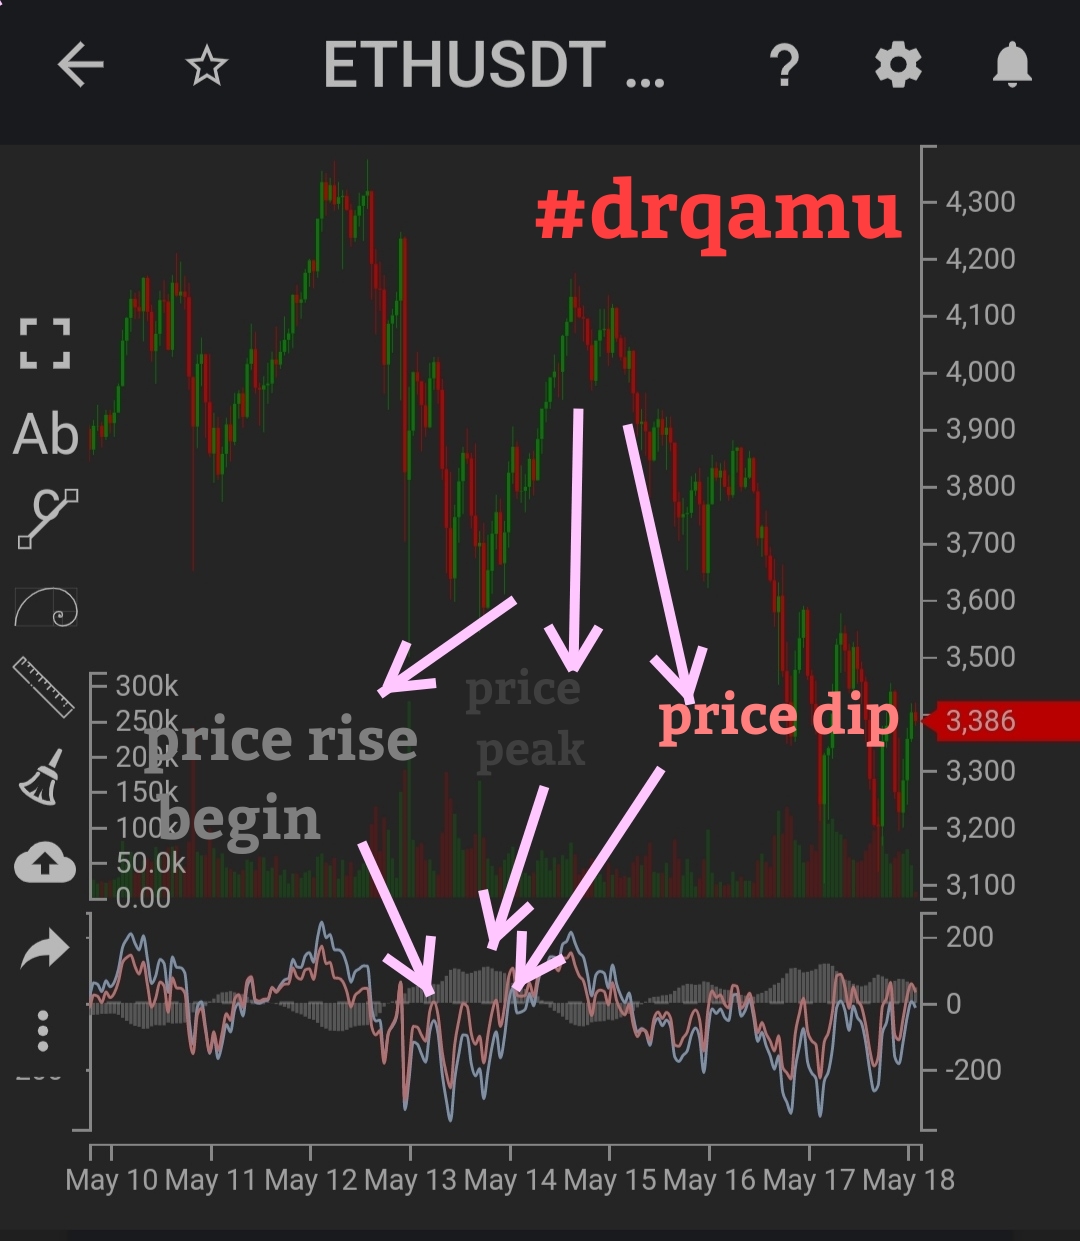
Support refers to assets price kevel where we expect asset price to stop falling further or push up. On the contrary, resistance refers to price level, where an upgoing price trend halts and price is expected to fall. Let's see screen shots below.
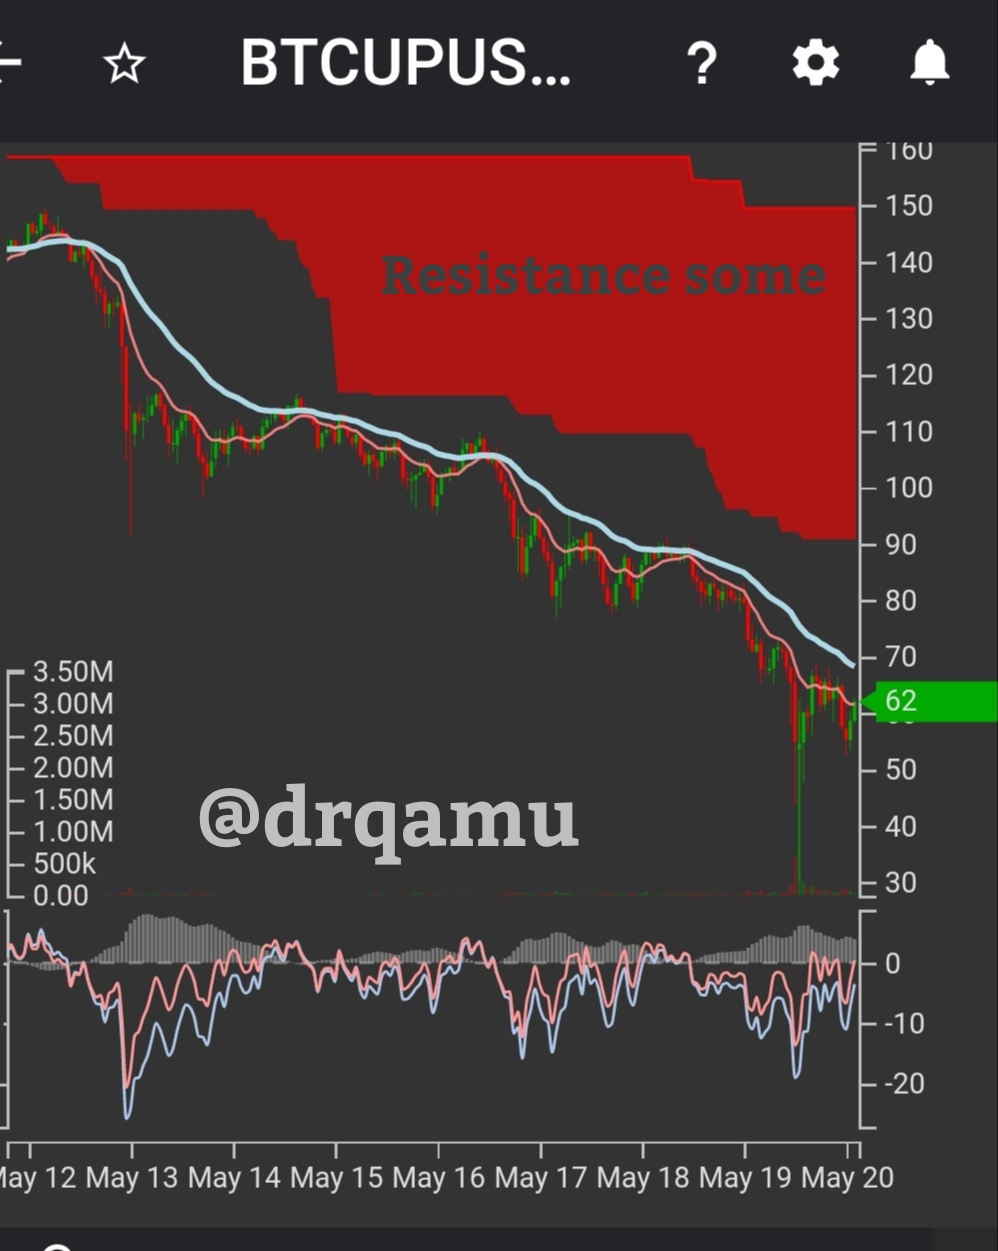
We have 3 points to analyse for support and a resistqnce. In the screen shot one, showing resistance zone, we can see that first point is to establish the resistance level by joining the tops of the uptrending p4ice peaks. As we have to establish it via MACD indicator , next we look at the long EMA of MACD and we can see that it closely correlates the price vhart resistance level and also touches uptrend top.
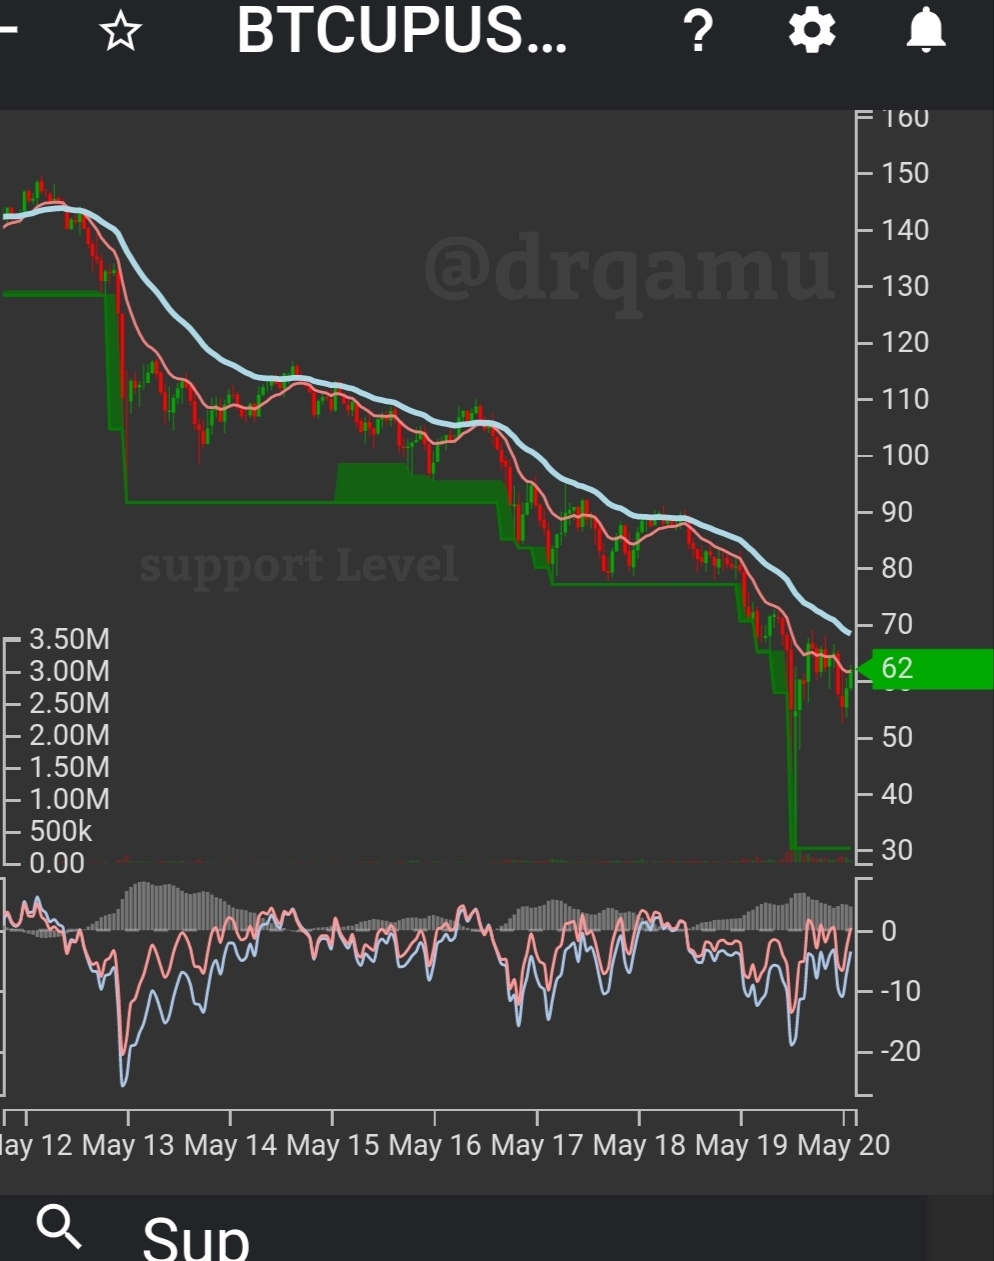
Next look at second screenshot, we can establish the support level by joining peaks of downtrending price peaks.
When we look at MACD, than we can find the support level by joining the tips of the MACD line in downtrend and histogram of the corresponding segment convergs towards the baseline and getting prepared to establish new bullish bars.
Review the chart of any pair and present the various signals from the MACD. (Screenshot required)
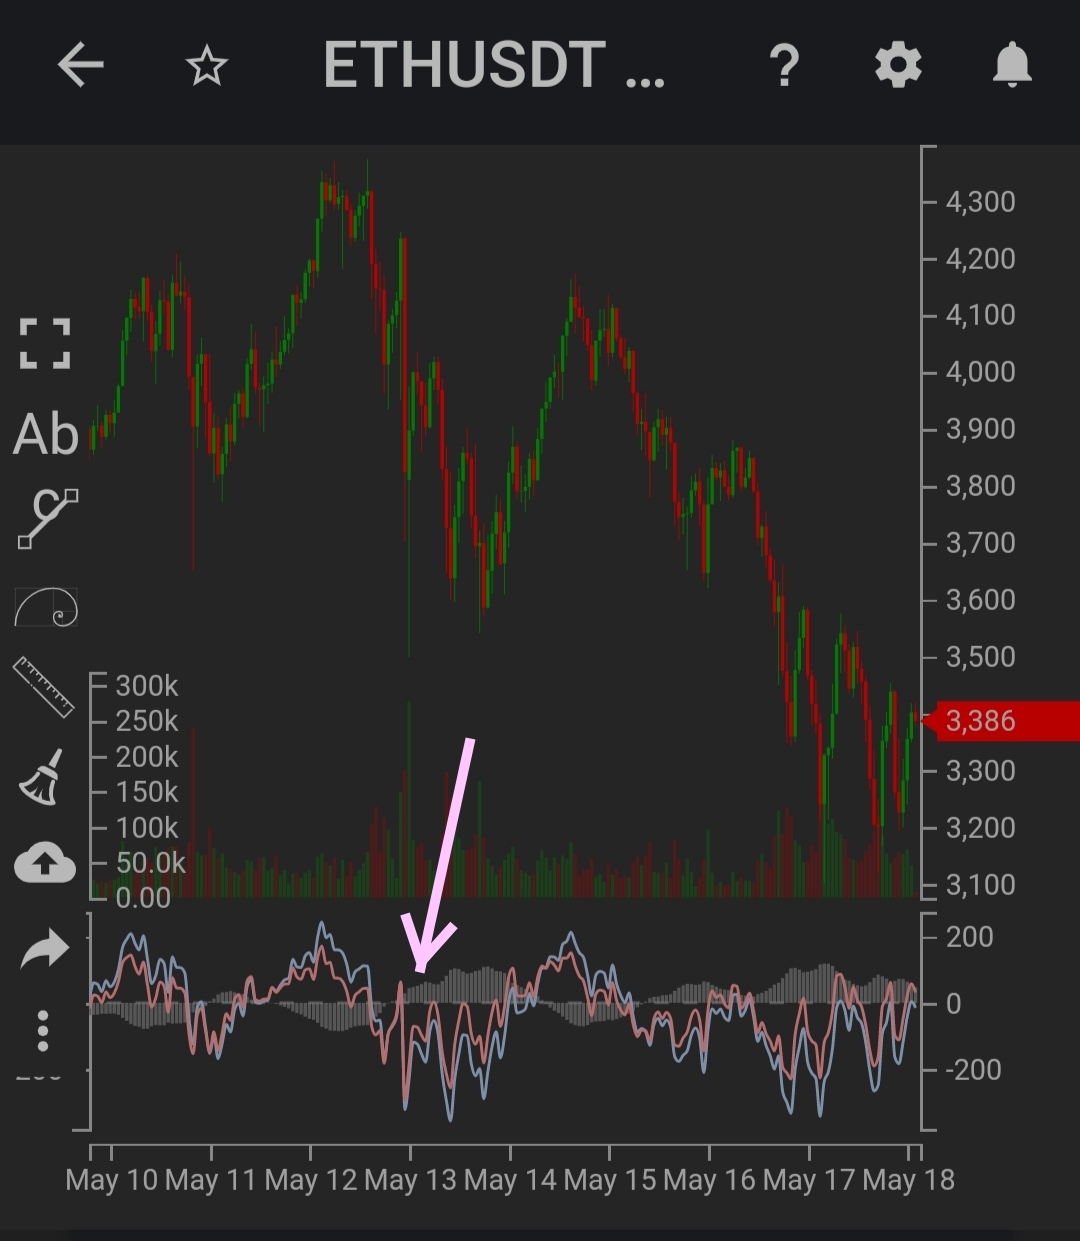
Look at ETH/USDT chart, i have marked arrow at MACD corresponding to 13th May. Here MACD signals BUY, as MACD crosses above signal line. Secondly, the bullish bars of histogram have started to become taller. Therefore, we have 2 indicators withing MACD favouring buy signal.
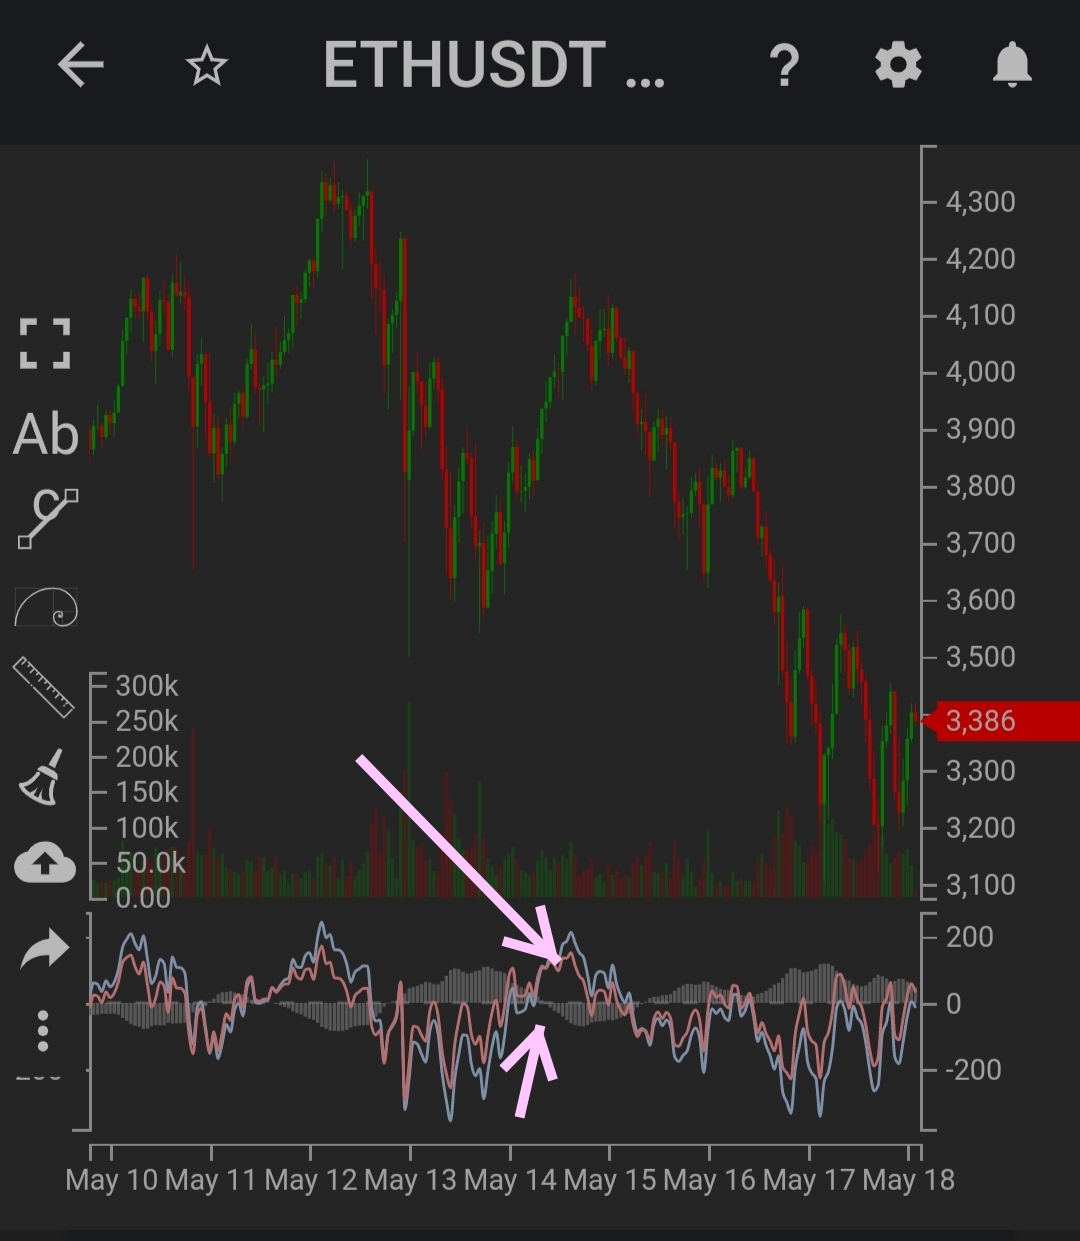
Now look at same pair around 14th May, where MACD triggers SELL signal. Arrow shows MACD crosses below signal line and bearish bars of histogram have started to increase in length.
Thanks
Hello @drqamu,
Thank you for participating in the 6th Week Crypto Course in its second season and for your efforts to complete the suggested tasks, you deserve an 8/10 rating, according to the following scale:
My review :
Good content, through which you succeeded in answering most of the questions successfully, even though some of them lacked some depth in the analysis, such as the comparison between the MACD and the relative strength indicators, as well as tracking the price of the ETH / USDT pairs based on the indicator signals.
Thanks again for your effort, and we look forward to reading your next work.
Sincerely,@kouba01
Thank you sir, I'll be putting more efforts next time.
#affable