Steemit Crypto Academy Season 4 Week 2 - Beginner's Course | Technical Indicators by @dulip for Professor Reminiscence01
Homework Task
Entire Question
a) In your own words, explain Technical indicators and why it is a good technical analysis tool.
b) Are technical indicators good for cryptocurrency analysis? Explain your answer.
c) Illustrate how to add indicators on the chart and also how to configure them. (Screenshot needed).a) Explain the different categories of Technical indicators and give an example of each category. Also, show the indicators used as an example on your chart. (Screenshot needed).
b) Briefly explain the reason why indicators are not advisable to be used as a standalone tool for technical analysis.
c) Explain how an investor can increase the success rate of a technical indicator signal.
Technical Indicators

When we think about the importance of these tools we can identify several benefits.
This will help to predict an accurate signal for traders.
Technical indicates give an accurate signal with a positive probability to decide the decision so that as a trader minimizing the risk they can trade.No need for any previous experiences to use technical indicators
If you are a beginner then using a technical indicator will be very useful to predict future behavior.It shows a very clear image about the market positions
As an example, we can easily identify whether uptrend or downtrend so that easy to take the decision.
Here we discussed the general benefits of technical indicators, in the next chapter, we'll move directly into Cryptocurrency and the relationship and is it worth using any kind of technical indicators in analyzing.
Are technical indicators good for cryptocurrency analysis?
To the above answer here I'll express my personal idea so that my point of view is technical indicators are good analyzing tools for Cryptocurrencies.
"The trend is your friend" is a famous quote in the market so that these indicators will help you to find your friend that means trend. So that if you select the correct indicator for the correct situation you will be a successful trader in Crypto Market. Most investors in Crypto Market use these indicators as a support tool with their other technical tools. Anyhow as a conclusion, we can say these technical indicators are very beneficial for the traders, and they convey a correct signal to the user.
Here we'll discuss how to add indicates to a chart and how to configure them as needed. For this purpose, I use Trading View platform. So that I will explain the above questions by using several steps.
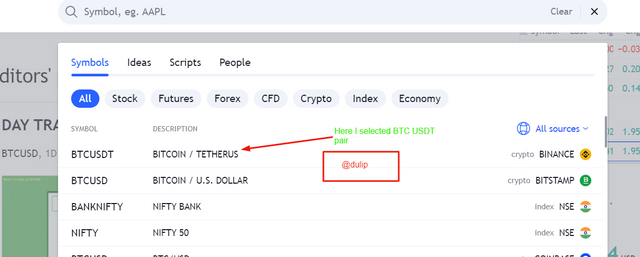
- Step-01
After log in to the trading view platform then as the first step we have to select our trading pair so that here I'll select BTC/USDT pair.
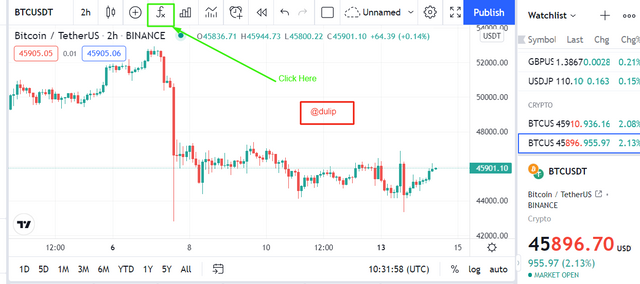
- Step-02
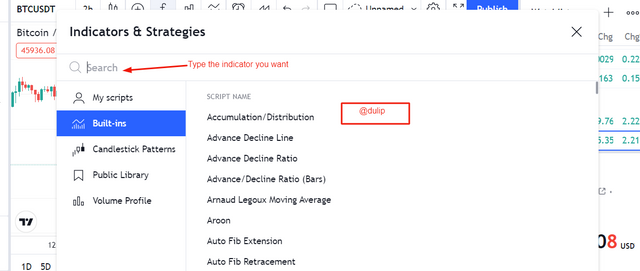
As the second step here you will appear the selected graph. After that click on the indicators and strategies button on the top menu.
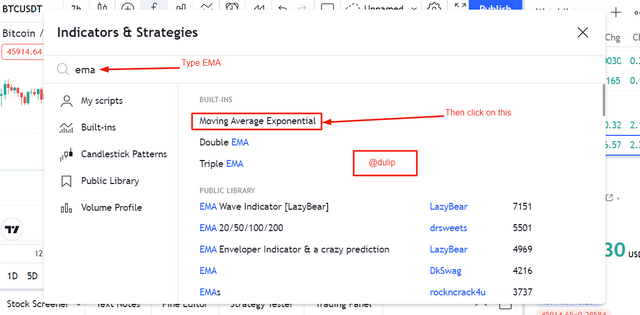
- Step-03
This step is one of the most important because here is the place we can select our indicator by its name. So that here I will write EMA (Moving Average Exponential) as an example to clear the idea.
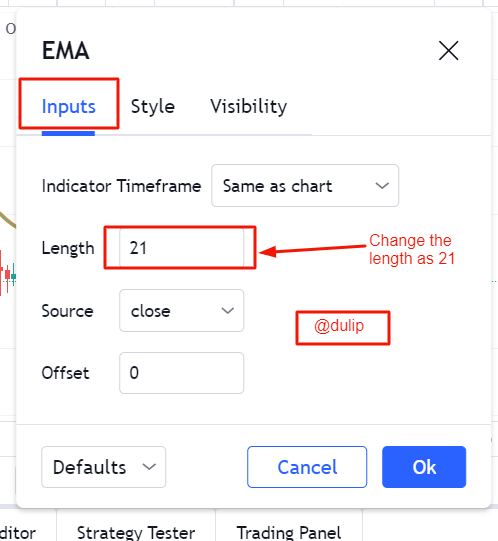
- Step-04
From this step, we can change some settings as per the requirements. So that in the image also you can see there are several options such as Input, Styles, and Visibility but in this example, I use only Input and Style tabs only.
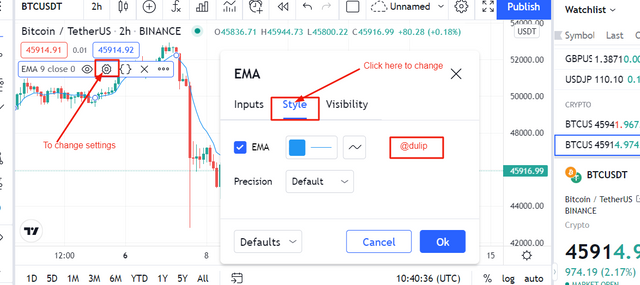
Customize settings Src Step-05
As an additional step where we can change the colour tone also but this is optional.
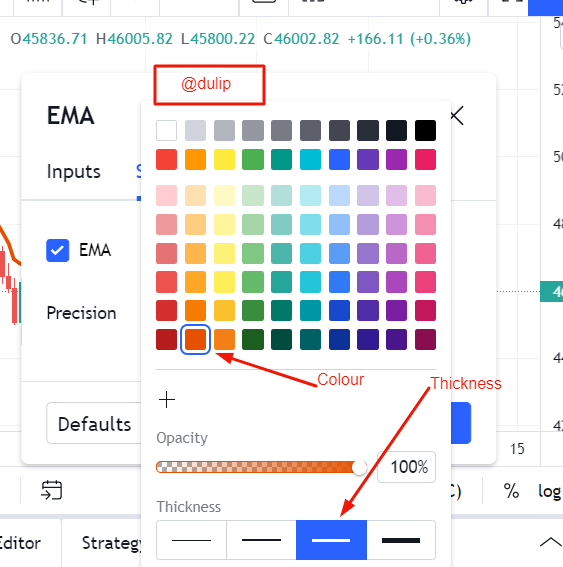
Customize settings Src Step-06
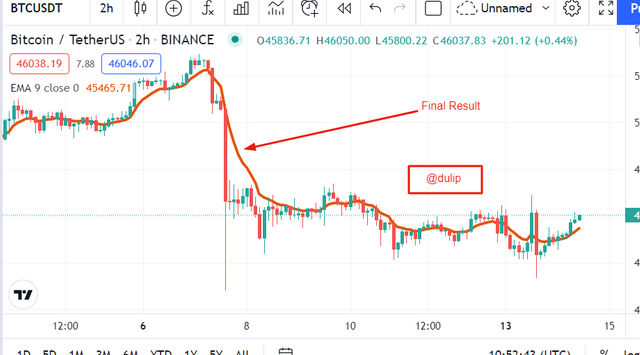
This step shows us the final result of our indicator. So changing the above mention setting we'll be able to get a clear indicator.
Different categories of Technical indicators
In modern days traders use different types of technical indicators so that here basically we can categorize them into three types. Further, we can classify these indicators such as the style of trading and the objectives which you use for the investment. Now we'll discuss those three types one by one.
Trend Based Indicators
If you remember that in the first chapter also I told about trends, so that as I said previously if you identify the trend of the market then it will be an easy job to gain some profit through the trading. Considering these points we can say indicators play a major role to find the future trend by using past data. This will very helpful to identify the strength and weaknesses of the Crypto Market. Here I can give several examples of indicators that fall into this category.
- Ichimoku Kinko Hyo
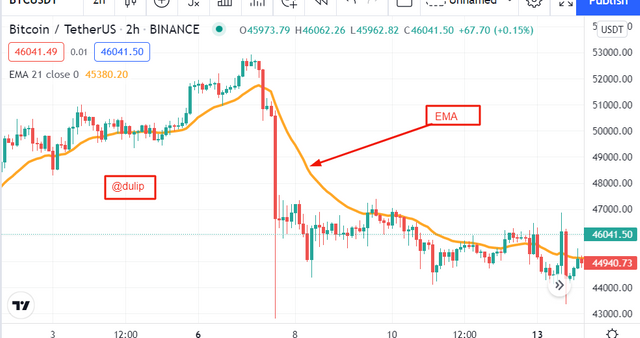
- Moving Averages ( Simple and Exponential)
- Average Directional Index ( ADX)
Here I'll show you a very familiar trend-based indicator that is Moving Averages Exponential. So that it is also known as EMA.
Volatility Based Indicators
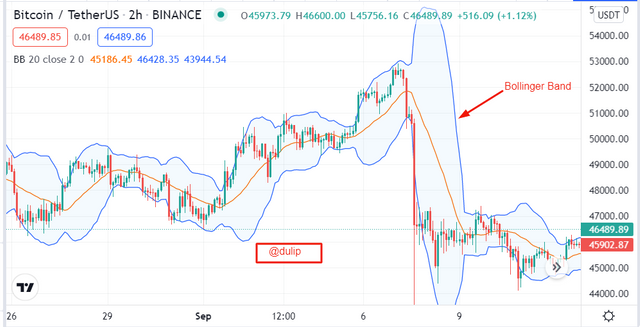
In finance, volatility is the degree of variation of a trading price series over time deviation so that simply we can get an idea about these indicators. If we simplify further then we can say it gives information to the trader when the market swing that means swings low or swings high. Hence it will be a good opportunity for a trader because then he can buy relatively low prices and sell at relatively high prices. There are few indicators that fall into this category.
- Bollinger Bands.
- Average True Range (ATR)
Momentum-Based Indicators
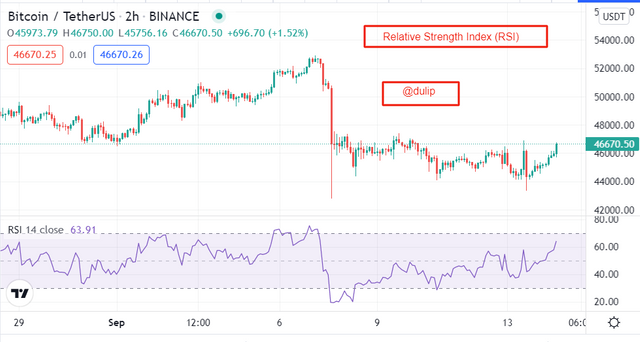
Momentum-based indicators called oscillators are used to analyze an asset that how far has traveled. An asset of a wealthy tendency does not always exist as a bad one. Depending on the forces of supply and demand, these assets become more expensive and investors begin to make profits, which puts selling pressure on the assets. It gives an idea about that asset is over-sold or over-bought. Here I'll mention some examples for this category.
- Relative Strength Index (RSI).
- Moving Average Convergence Divergence (MACD)
- Stochastic
Indicators are not advisable to be used as a standalone tool
Indicators are not advisable to be used as a standalone tool because we can't trust 100% about its accuracy and also it may go wrong so that if we trust a single indicator and doing some trades means we are in the risk zone. So that we have to use more than one indicator before making a decision and the other hand there is some kind of technical issues also such as network lagging.
How an investor can increase the success rate of a technical indicator signal?
First of all, the investor should have a better understanding of his field and also about the indicators which he is using. So that investors should know what are the limitations of using indicators as an example if some indicator gives maximum results for a 2-hour chart then he has to customize it properly as per the requirements.
And the other hand if you can use more than two indicators then you can increase your success rate of the technical indicator signals.
Like that after a small research investors can increase the success rate of the technical indicator signals.
This is all about my homework post and Thank you very much for the valuable time you have spent reading this article.