Price Action + Break-Even Technique - Crypto Academy/S4W4 - Homework post for @lenonmc21
Hello Steemit, it is another interesting class with @lenonmc21. Carefully go through my work.

Price action can be defined in different ways, but I just want to define it simply by saying the trading the money with the market movement which is the price movement alone.
Price action is a type of strategy that focuses only on the price movements or it can be said to use the previous price movement to analyze the current price behavior. In pure price action, all the information is collected from the previous movement of price, no external assistance is needed, no technical indicator is used in pure price action. Pure price action consists of using a pattern, candlestick pattern, resistance, and support, etc. And many other more. Traders just make their trading decisions based on pure price movement.
We are looking at how price is responding to different events. Such as external catalyst, key levels of resistance and support, buyers and sellers. Price action is the price response to different things and events, even to the candlestick, time frame, etc.
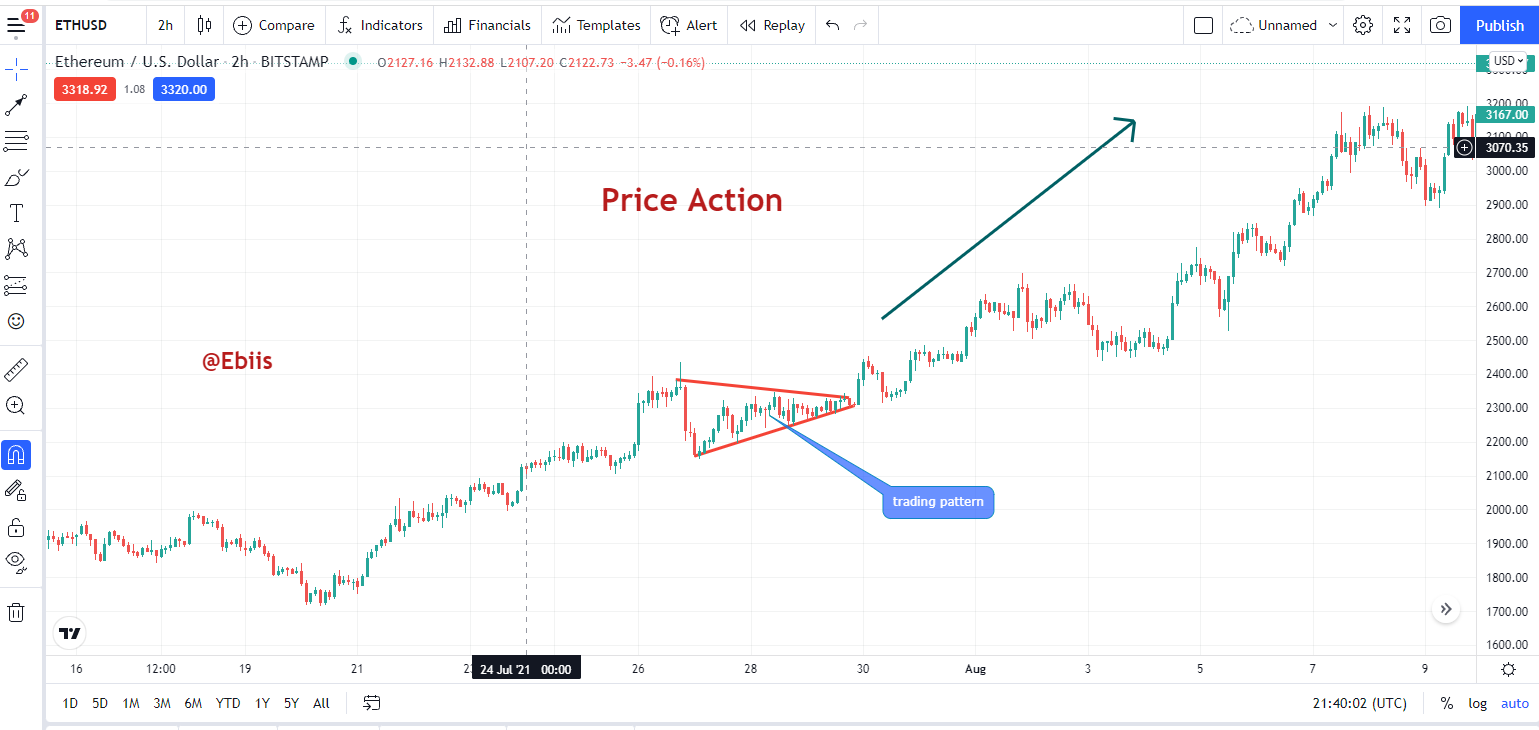
This is a pure example of price action, from the chart of ETHUSD, we saw a wedge pattern that is formed which is based on the pure price action, there is no indicator used in this case.
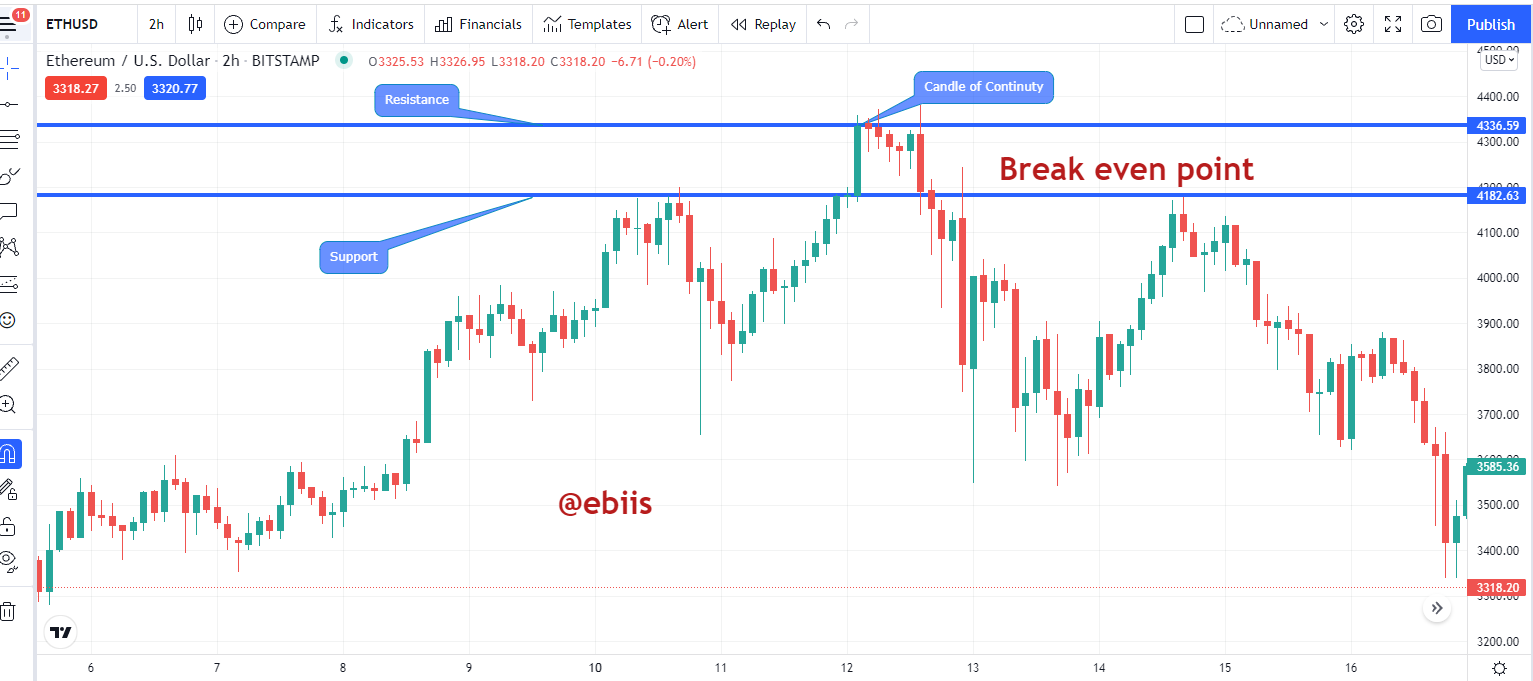
Break-even point is the point that shows the continuity of trend or the retracement of trend by the use of the last candlestick. That last candle either continues a trend or reverses it by using the information gotten from the price. To properly know the last candle of continuity. In getting the break-even point, two lines which are the support and resistance line are drawn using the last candle of continuity top and bottom. Getting the lines accurately, we are one step further for its usage.
The chart of ETHUSD shows a clear example of Break even
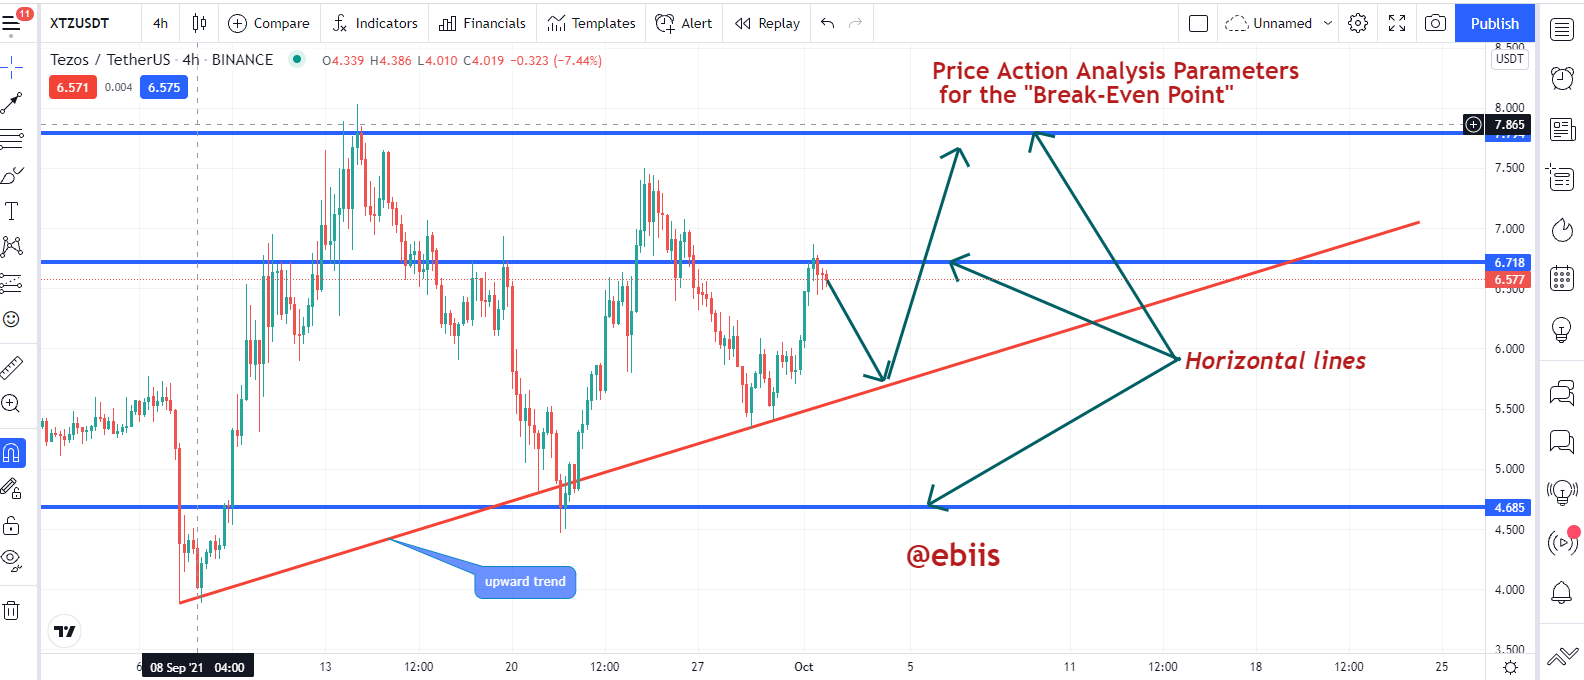
These are the steps in an orderly manner to run a price action analysis with the Break Even Point.
- Select any two-time frame that is comfortable for you in the chart.
- The bigger time frame should be used to know the trend of the market and the smaller time frame should be used as an entry point of the trade.
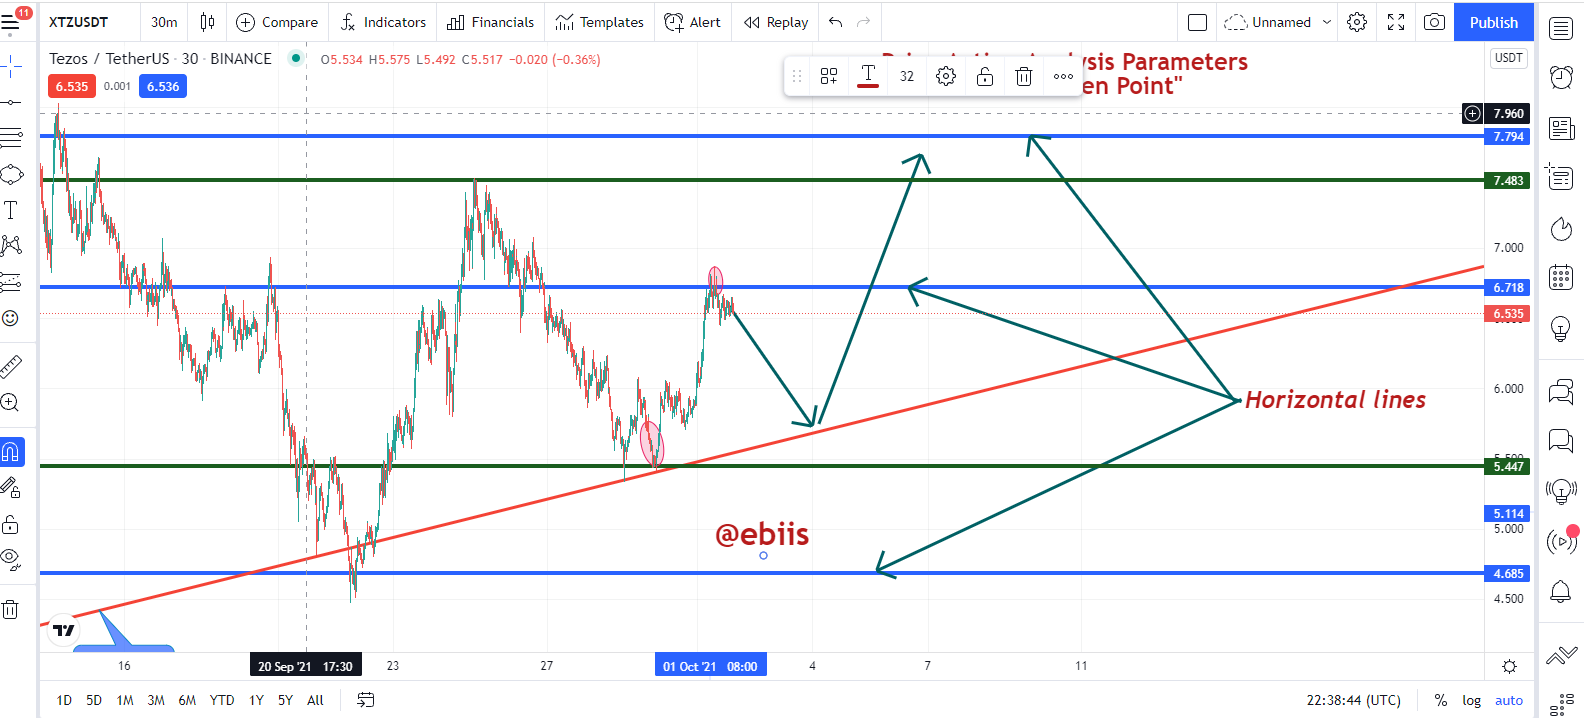
- The bigger time frame, mark the horizontal lines which comprise the supports and the resistance.
- Carefully observe the trend of the market is also the smaller time frame.
- Identify the equilibrium point and then carefully look for potential market entries.

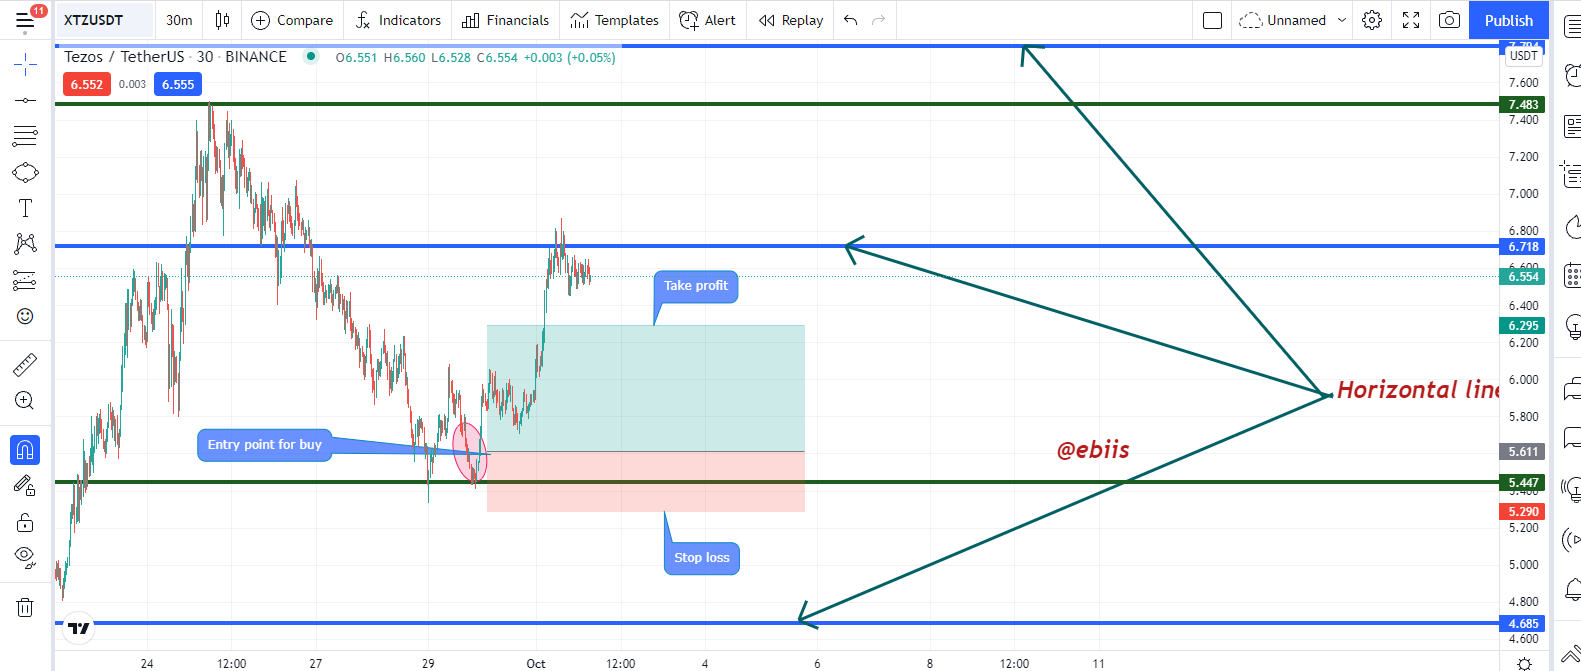
To effectively get the trade properly the entry point and exit criteria for a buy and sell of the Equilibrium point price action technique must be meant and it is as follows.
- Carefully mark out all the equilibrium point using the both time frame, anyone is good for you depending on the kind of trader you are.
- Wait for a break on the equilibrium point
- If the break is on the up of the equilibrium then you should enter a buy order
Exit criteria for buy
- Place the trade
- Your stop loss should be placed below the candle that shows the Equilibrium point.
- Depending on where you place your stop loss, your take profit should be twice of the stop loss that means a 1:2 risk to reward ratio.
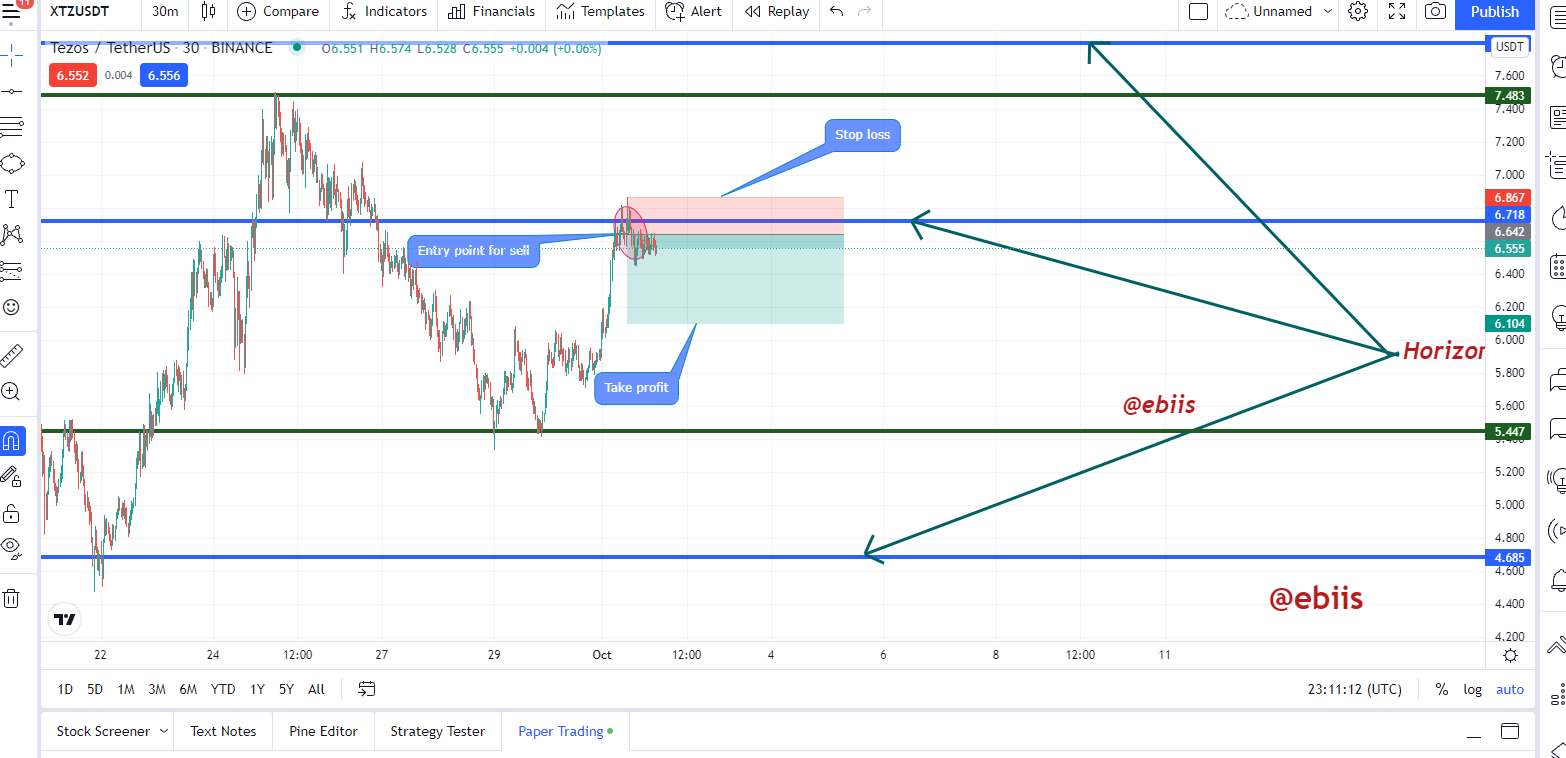
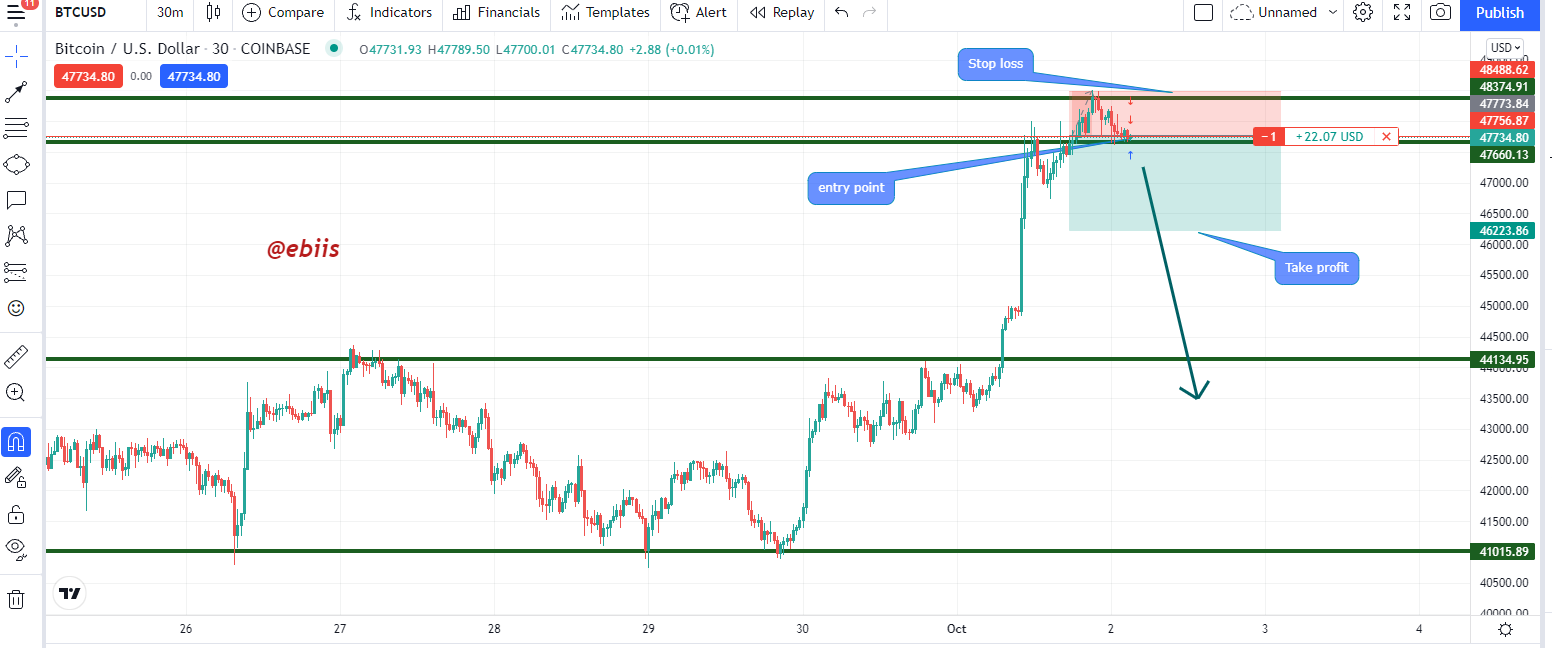
The entry point for a sell
- Carefully mark out all the equilibrium point using both timeframe, anyone is good for you depending on the kind of trader you are.
- Wait for a break on the equilibrium point
- if the break out is moving down then you should enter a sell order
Exit criteria for both sell
- Place the trade
- Your stop loss should place above the candle that shows the Equilibrium point.
- Depending on where you place your stop loss, your take profit should be twice the stop loss that means a 1:2 risk to reward ratio.
For me, the best is the action of the price because even the indicator are gotten from the action of the price. Pure price action, if properly analysed can yield the trader huge amount of profit repeatedly. Action of the eprice is usually goten from the previous movement of the pricce and there is a 100% possibility thatthe movement wiill repeat itself again, that is how price action is gottten but the indicator is a calculation of the price movement and it easily fails one.
In conclusion, price action is very important, but if you want to be master in it, you should practice with your demo account repeatedly, over and over again until you will be use to it. We should note that there are many price actions available, knowing one can make you a king in the market.
Cc: @lenonmc21