Basic Trading Strategy using the Harmonic Pattern AB = CD + Fibonacci Crypto Academy Season 4 Week 2 - Homework task for Professor @lenonmc21
Good day everyone and welcome to my task for this week, taught by @lenonmc21

Harmonic trading patterns are useful to know when price trend is about to change so traders can get in early and take advantage of the price change. It's term, "harmonic" comes from the theory that trade patterns repeat themselves as with other patterns in nature. Whatever pattern is occuring are repetitions of previous ones and they form wave patterns. It works hand in hand with Fibonacci retracements.
There are different types of Harmonic trading patterns and the AB=CD pattern is one of them. Others include the butterfly pattern, the crab pattern and others.
The AB=CD pattern is a harmonic pattern. It is used with Fibonacci retracement to detect possibility of a trend reversal. It consists of a wave like pattern, with four nodes touching high and low points on the chart, labeled A, B, C, D. Each node has certain positions where they should fall into to be classified as AB=CD pattern. There's the bullish and bearish AB=CD pattern.
For a bullish AB=CD pattern, it is used to tell if the market would turn bullish. It usually starts from a downtrend. This is where you look for the bullish AB=CD pattern. When you draw points A,B,C and D, you then use the Fibonacci retracement to confirm the pattern. Point C should be between the range of 61.8 and 78.6% Fibonacci retracements and point D should be between 127.2 and 161.8% Fibonacci retracements. Usually point C is higher than points B and D but lower than point A.
For a bearish AB=CD pattern, it's practically the reverse of the earlier stated. Here, it starts from an uptrend, hence, it is used to predict if the market would reverse and turn bearish after point D. Like stated above, you draw your points and use Fibonacci retracements to confirm the pattern. In this case, point C is below B and D but higher than point A. The range of values for points C and D is the same as that of the bullish pattern.
Whether to buy or sell depends on whether the pattern predicts a possible bullish or bearish trend. Once we have confirmed that it is indeed an AB=CD, then we look at the entry point. Normally, the right point of entry is after point D, if the next candlestick indicates a reversal of trend, then one enters the market and either buys or sells depending on the next predicted trend.
For exit, it is advisable to set stop losses and take profits, to avoid being too greedy. This would help you to know when to leave the market and handle losses properly. Different people have different risk management strategies and configure theirs according to their strategy. It is advisable however, not to set really risky positions for take profits and stop loss, especially for beginners. It is advisable that one sets limits at 2% of his initial capital.
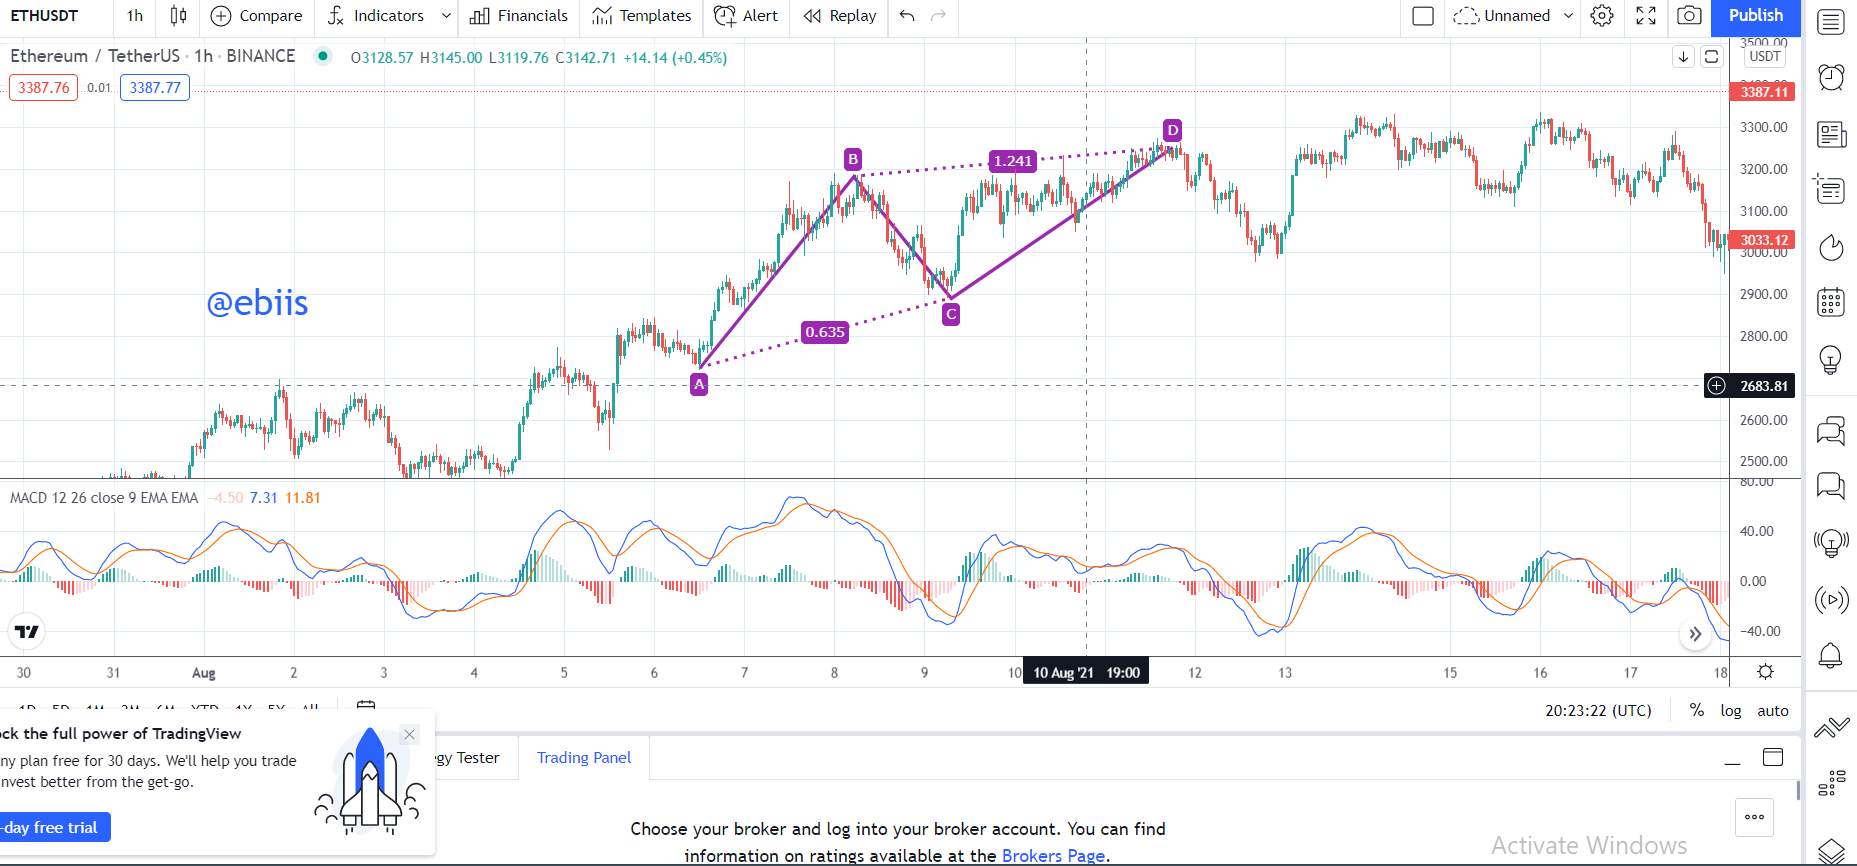
Let's look at the chart below.
.png)
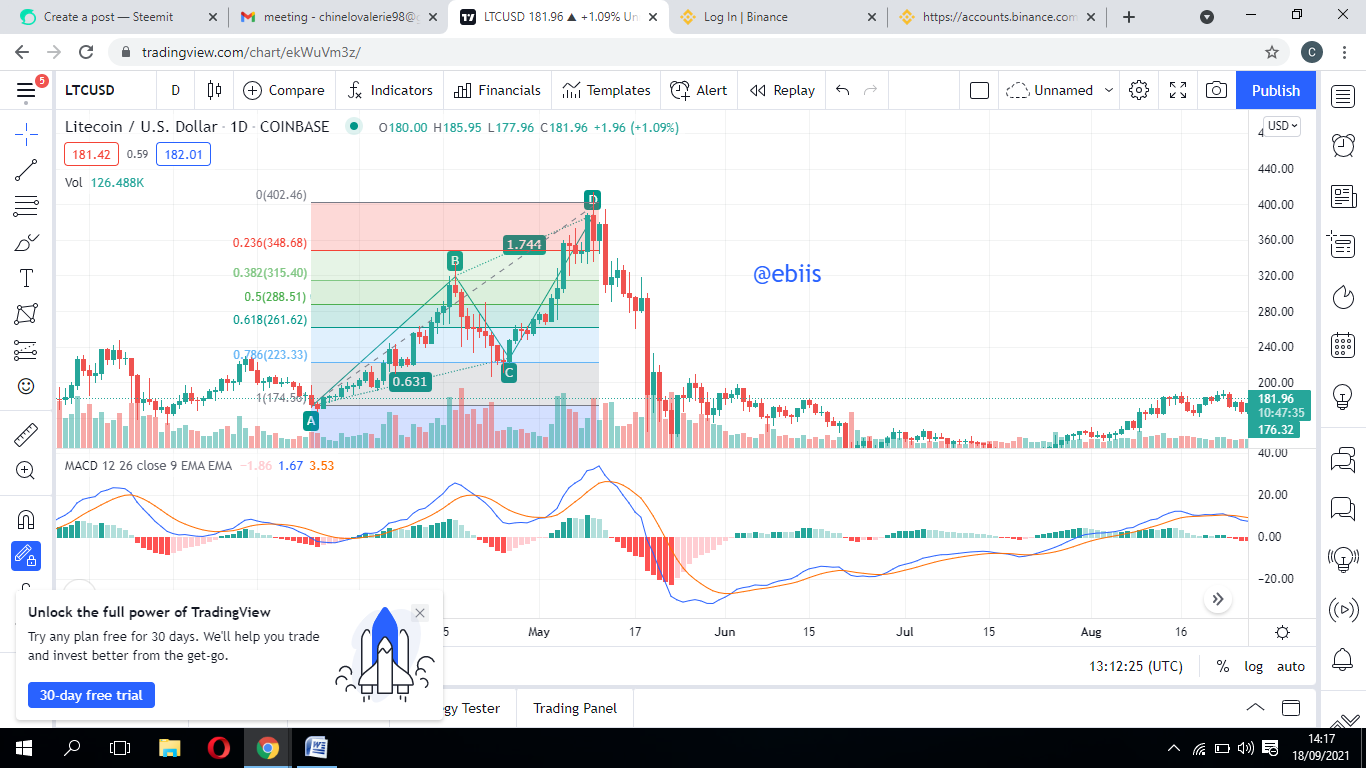
Looking at the LTC/USD chart below, we notice a downtrend pattern or bearish one. We do remember that to identify a bearish pattern, we start from an uptrend. After putting our points A,B,C and D, we then draw out our fibonacci retracement as seen above. As we can see, the points C and D fell within our specifications as listed above and even looking at our indicator downwards, we can see that the market is about to get bearish.
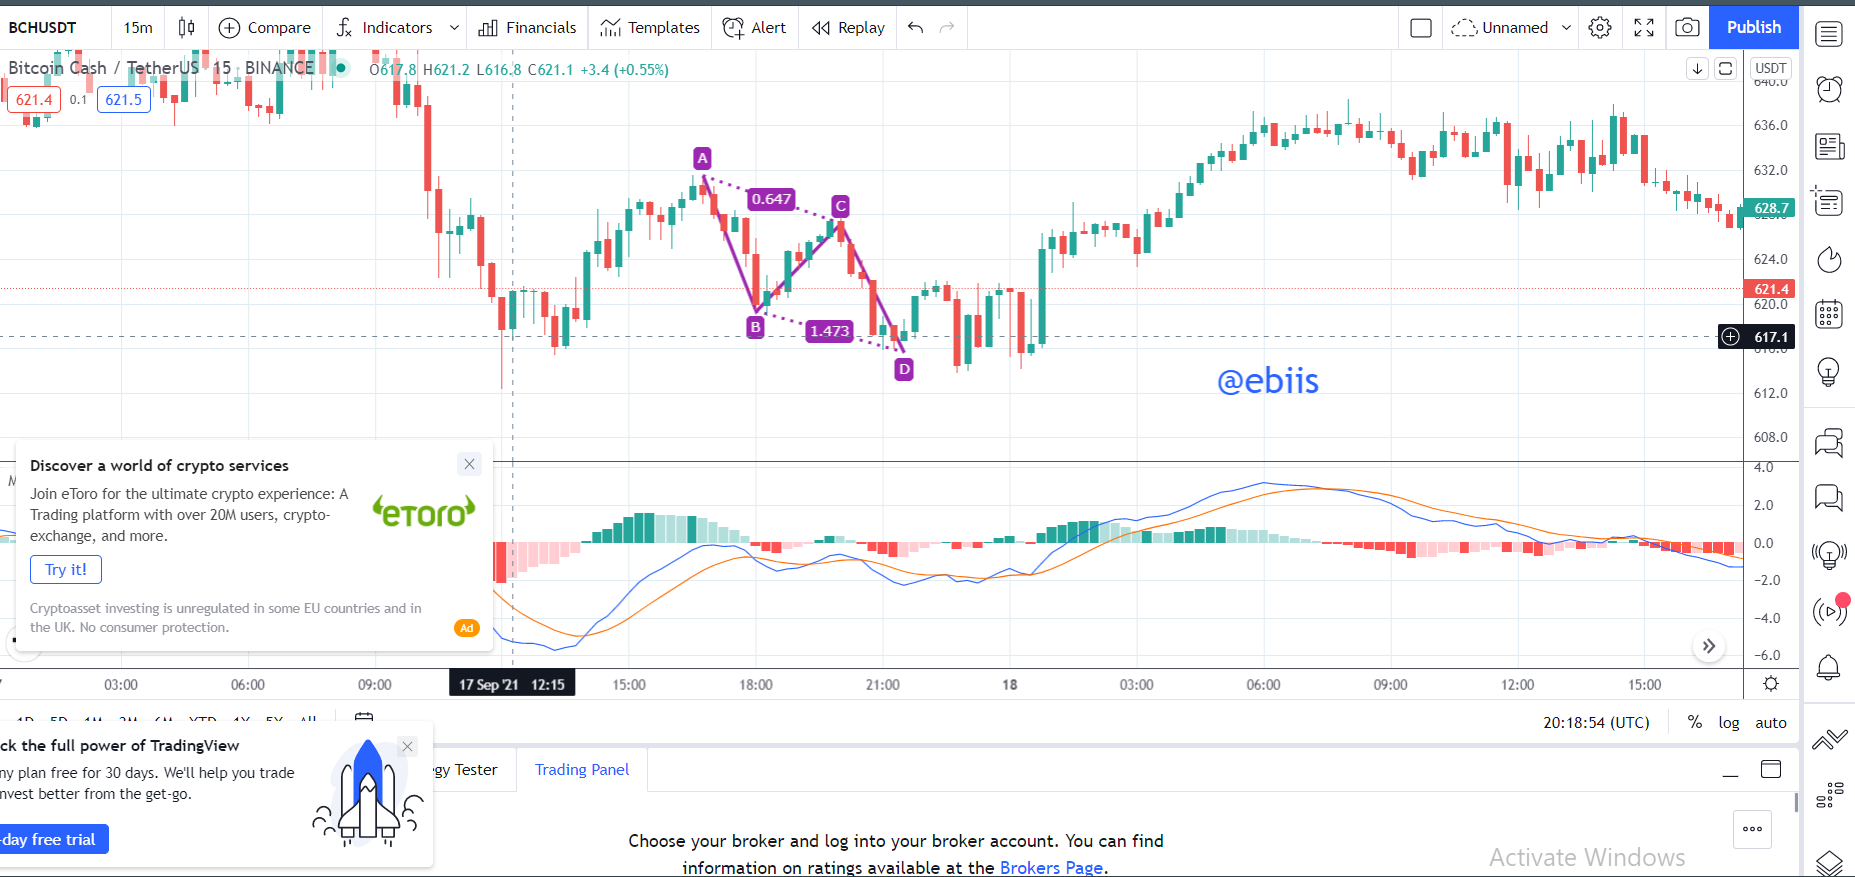
Let's look at another chart below.
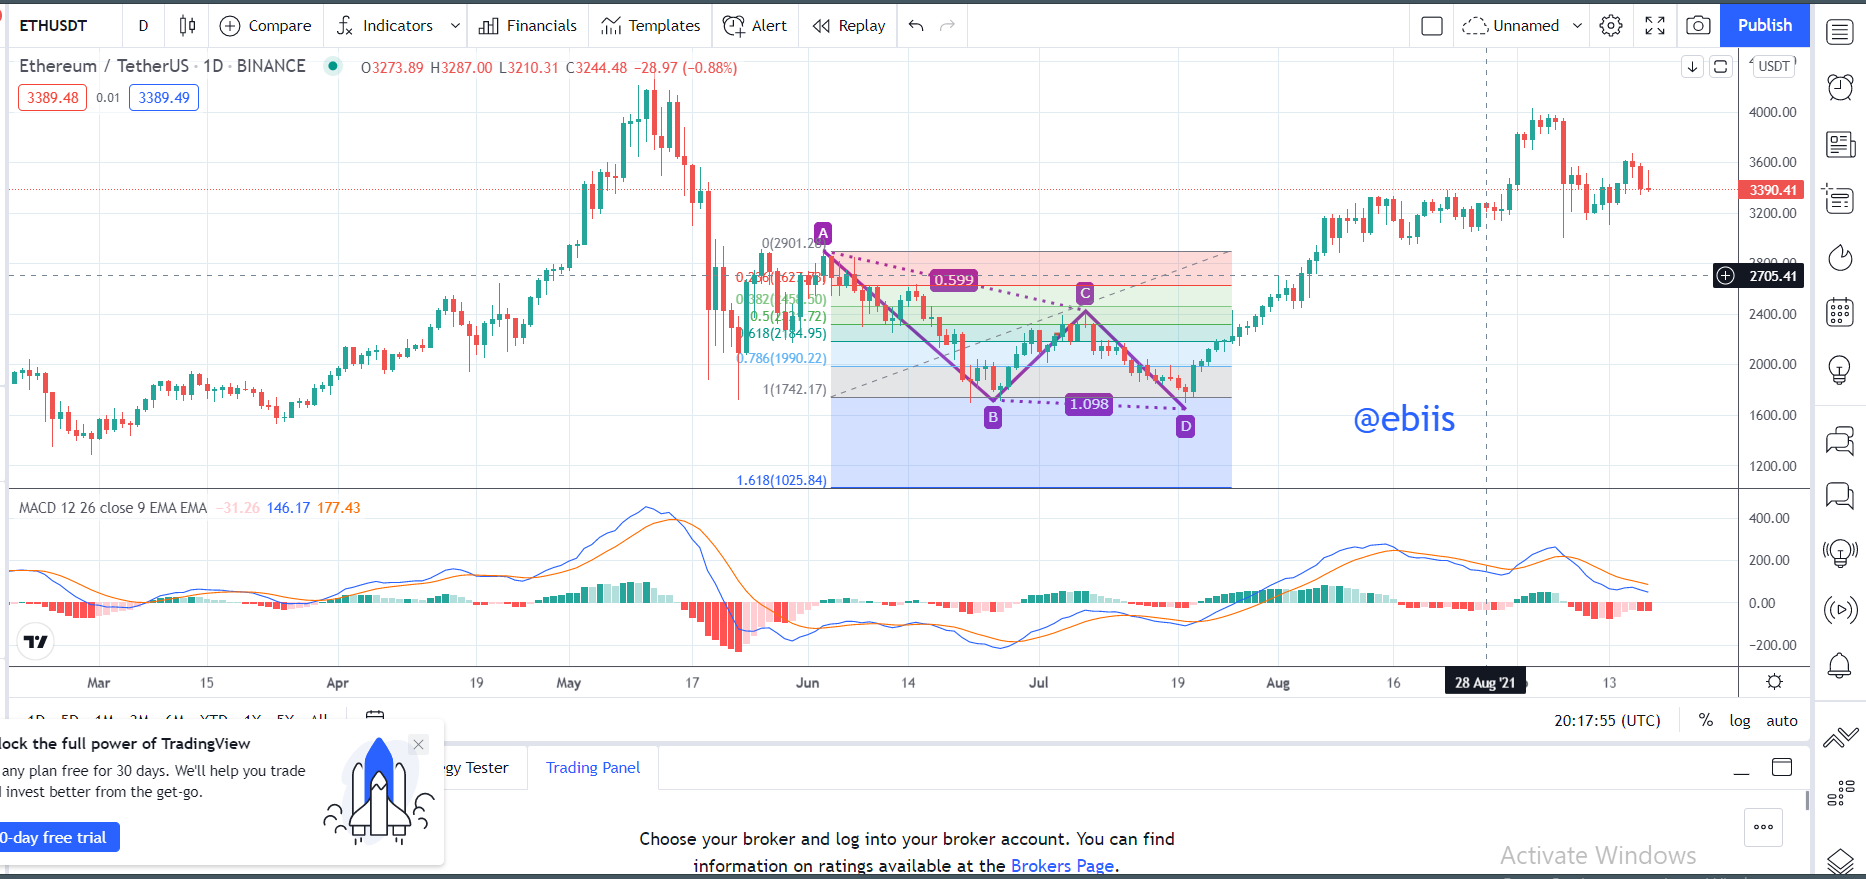
From the chart above, we can see that this is a bullish AB=CD pattern according to our description above. Clearly, it started with a downtrend and we were able to draw our points A,B,C and D. After confirming our C and D points with the fibonacci retracements, we have them confirmed that the market is going to turn bullish as can be seen afterwards.
Harmonic trading patterns like the AB=CD pattern are very good for determining price change and enabling the trader to react quickly and make good trading decisions. They’re easy to spot once one knows the rules to confirm the pattern. One should note that it’s not advisable to just draw conclusions and jump into a trade using confirmations from harmonic patterns only. One is always advised to use it in combination with other technical indicators.