[Beginner's Course | Technical Indicators 2.]Crypto Academy / S4W4- Homework Post for @reminiscence01
Hello steemit, technical indicators are back again, let's explore and learn more

b) With relevant screenshots from your chart, give a technical explanation of the market reaction on any of the examples given in question 1a. Do this for both leading and lagging indicators.
I am sure by now we all know what indicators are in the crypto market, An indicator that helps to properly analyze the market to make have effective profit from the market. Indicators are used for different purposes in the market. We know that indicators are gotten from the mathematical calculations of the previous behaviors of the candlestick of the market. Indicators help to identify a good entry point and also exit point. The indicator also helps us to know the strength of a trend, not only strength but also the direction of the trend which I am sure that every effective trader is looking for.
From our previous class, we have learned some categories of the technical indicators, so we are going to explore more. We will start by explaining in detail what these two indicators are.
- Leading indicator
- Lagging indicator
Leading Indicators: Leading indicators help to predict price movement by using a shorter period in the calculation. As the name suggests, leading indicators give signals before the price change occurs, They are mostly leading the price. A leading indicator is designed to lead price movement, which means that the indicator is providing an early signal or indication to the trader that a trend is about to reverse or continue before it happens. These indicators are used to identify a possible trend reversal, they are leading indicators because they signal a reversal before it happens. However, leading are bad for their fake signals, they give false signals some of the time, which results in losses most of the time. The leading indicators are best used in a ranging market to get good profit. Most of the leading indicators are oscillators, RSI, stochastic, etc. These indicators are plotted within a bounded range. The Oscillators usually move from overbought to oversold conditions which are based on the sets, level of the specific indicators.
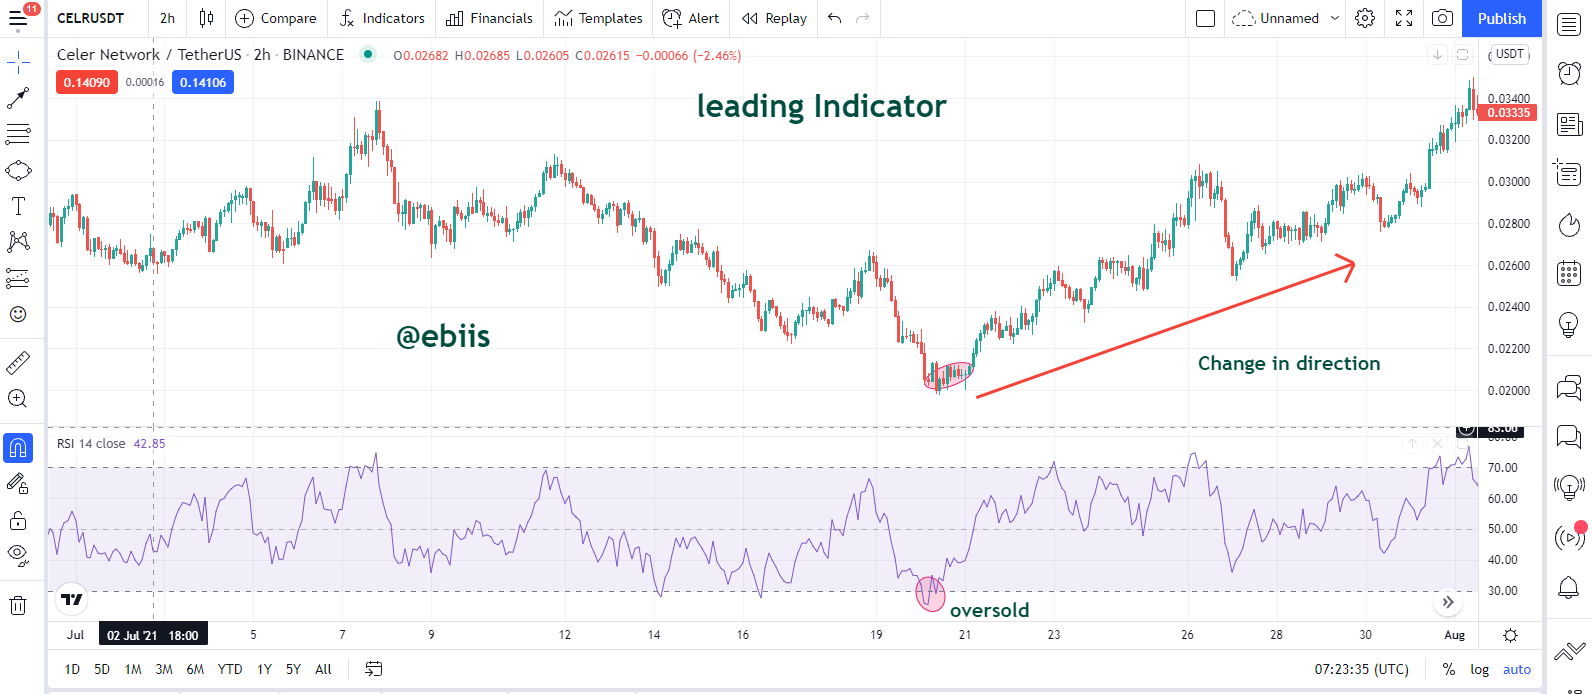
We can see an example of the leading Indicator in the chart of CELRUSDT in a 2 hours time frame, in this chart, we use a leading indicator called the RSI which is used to spot possible reversals by using the specific level to spot the oversold or bought. In this case, we spotted an oversold, which indicates that the price direction is about to change, and as we have seen, the direction change to a bullish direction.
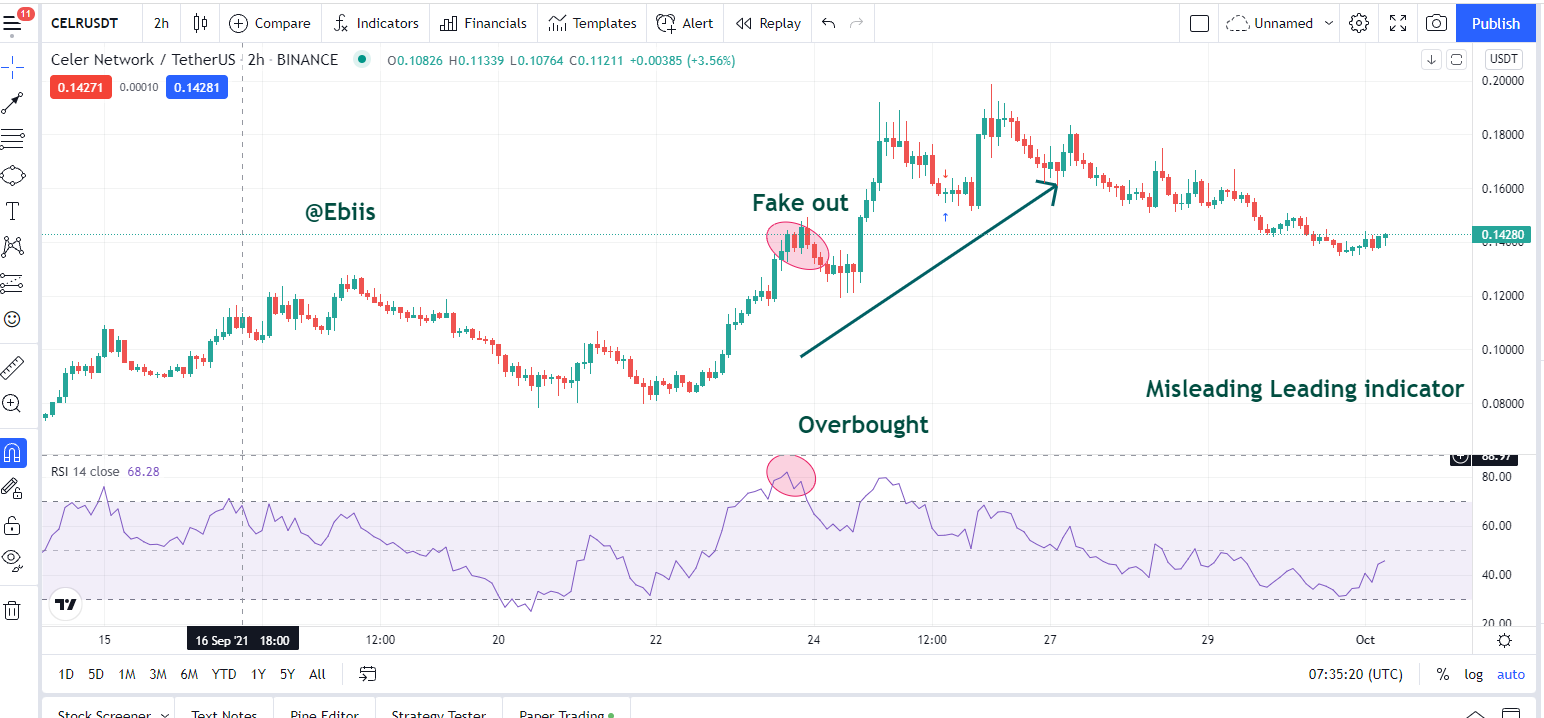
From the chart above, we can also see how a leading indicator can also mislead someone, making them lose a lot of money. We can see from the chart that the RSI indicators have signaled an over-bought which we were expecting the price to a reversal but the price did not reversal, rather, it kept going upward. That is a major fake-out.

Lagging indicator: A lagging indicator is used to confirm price action, this is done by telling the trader when the trend is about to begin after the trend has already begun. A lagging indicator normally confirms a trend after the price has moved. For example, if a trader is looking at a price chart, A lagging indicator will be able to confirm the trend direction And how strong it is. Lagging indicators also help confirm reversals in price direction. The indicators are usually faster than the price movement which makes them trusted in a long-term trend. Fake outs hardly happen using the lagging indicator because the trend has started already. Some example of the lagging indicators includes the moving average, Bollinger bands, MACD, Parabolic SAR, etc
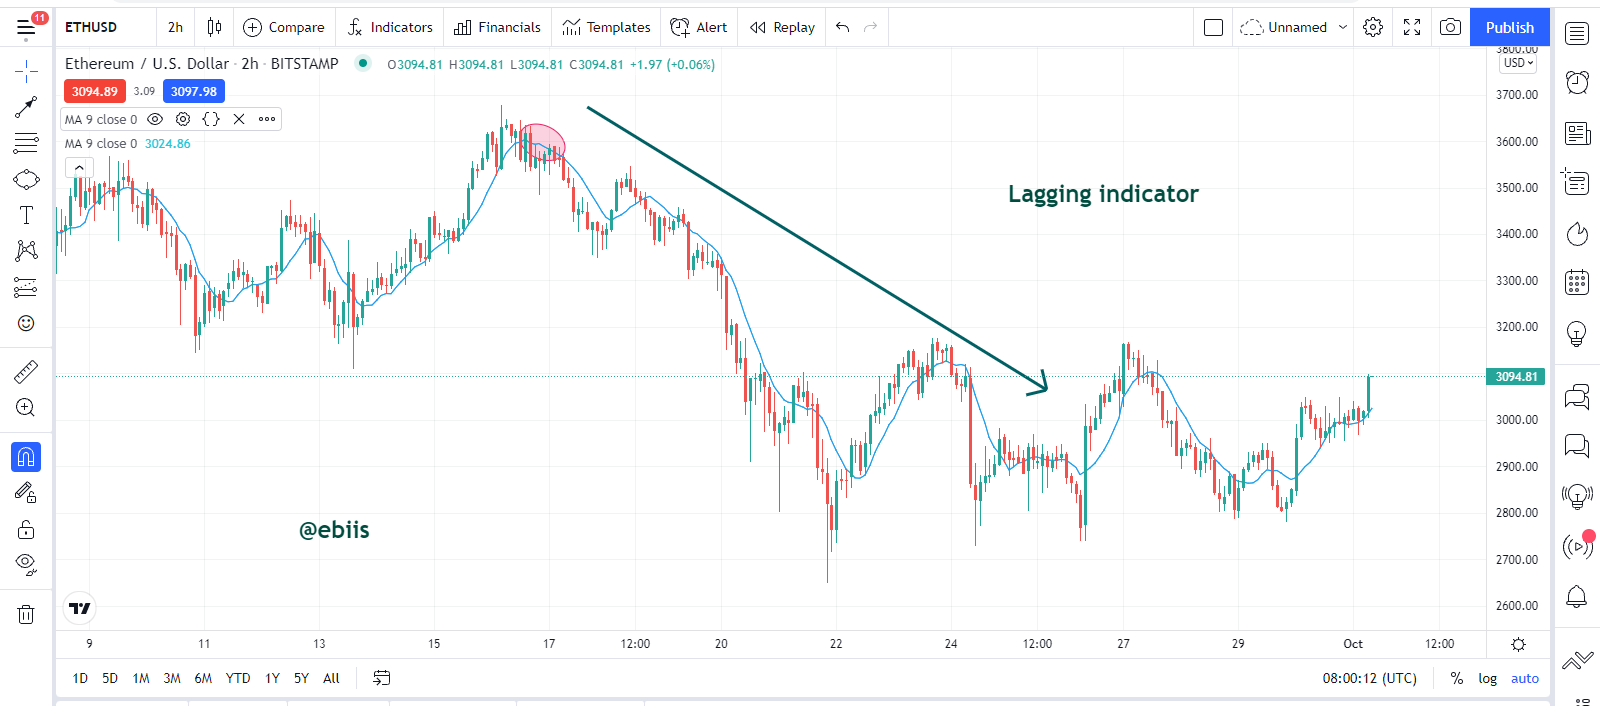
We can see from the ETHUSD chart in the 2-hour time frame, where a lagging indicator was used. The lagging indicator used in the case is called the moving average with a period of 9, this moving average was used in the chart to confirm a price action of reversal after it has occurred. Fake-out is less when we use a lagging indicator.
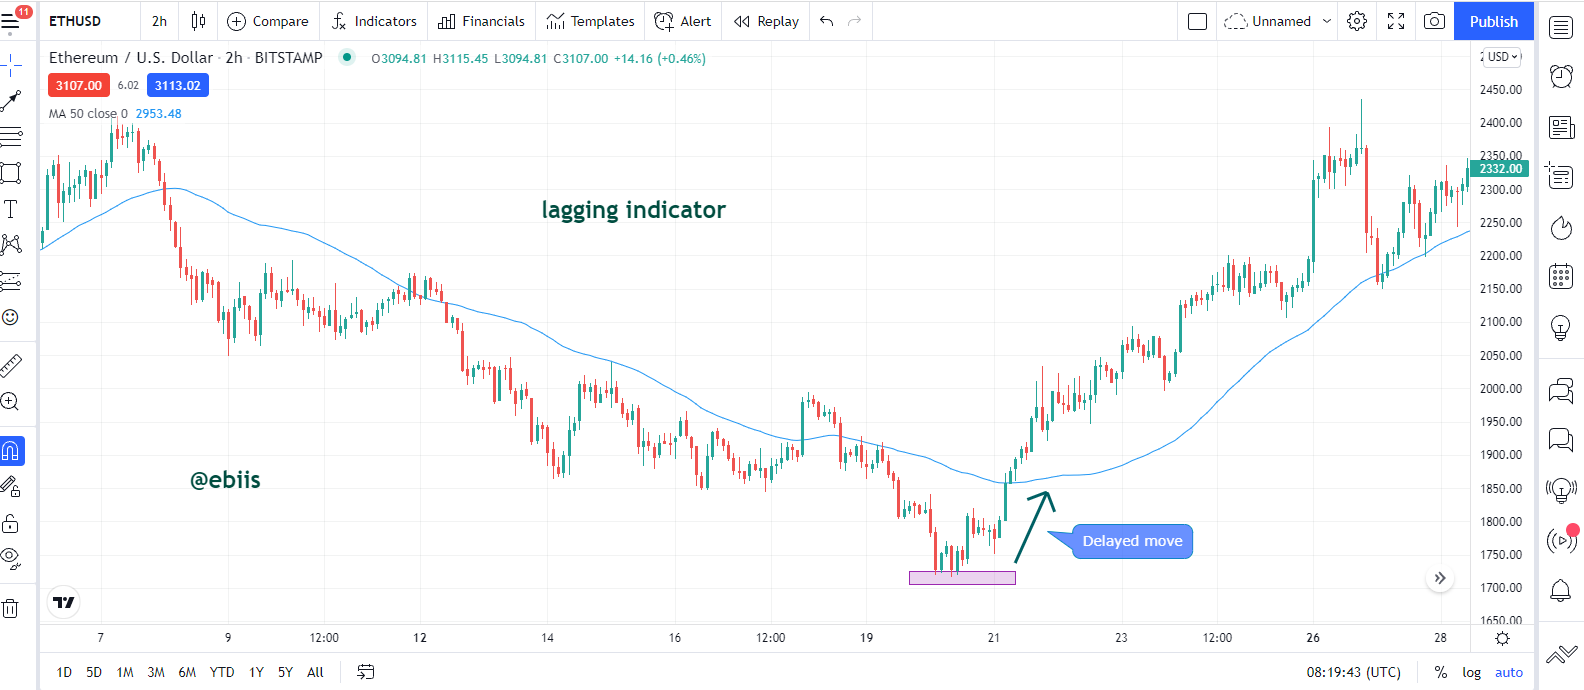
We can also see some flaws were using the lagging indicator in an ETHUSDT chart in a 2 hours time frame, where a potential delay occurred, the delay that occurred are profits, had it been the trader entered from the beginning, he could have made a whole lot of profit.
Indicators have proven for years to be one of the surest tools used in the market to make a quick profit but if not properly used, then you always be on the losing side. So we are going to look at some factors you should look out for before making use of any indicator in the market.
The Category/type of Indicator:
Knowing the type of indicator to be used in the market, we give an edge while trading. Knowing if the indicator is leading the price or lagging behind the price, will affect your trading decision, and the decision might lead you to make a huge profit. Knowing the type of indicator to use helps you to be aware of the market movements and you make sure to be careful with the trading management. Using only RSI can make you lose money, because of the bad fake-outs it has. Knowing that RSI is a leading indicator, will make you more conscious and apply all the necessary precautions needed.
Market Trend:
Understanding the market trend is another key factor you should consider before using a technical indicator. Knowing about ranging or trending market is another factor, most traders just jump into the market without considering this, and most of the time they come out with huge losses. It is advisable to use the lagging indicator for the long-term trend, and the leading indicator for ranging indicators to avoid fake-out, using the region between the oversold and overbought to scalp the market, if you are using the stochastic or the RSI which is leading indicators.
Have a Strategy for trading:
This is the fundamental of every trader, it is expected that every trader should have a trading strategy, that he should stick to. Having a strategy will reduce the number of indicators you will be using for every trade. It will help you understand the Indicator better. Having a strategy for trading will also determine the kind of trader that you are if you are a scalper, position trader, or longer-term trader.
At some times, most technical indicators can be misleading, and this has made traders lose huge sums of money. So a trading principle called Confluence was introduced. What is Confluence? Confluence is simply the use of the combination of a trading indicator and pure price action to confirm a trading decision. This can be the Bollinger band and the harmonic pattern to confirm either a good entry point or an exit point in the market.
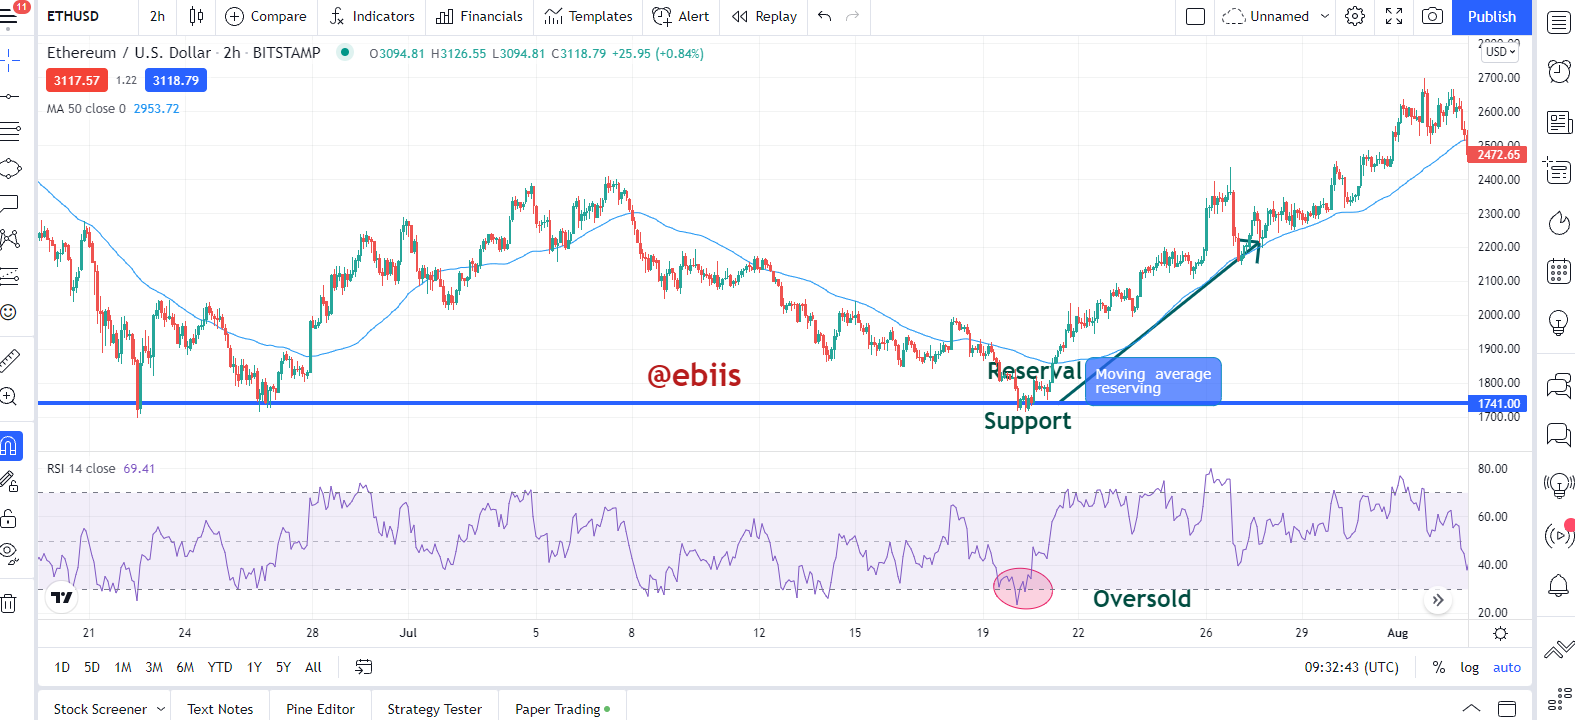
From the chart above of the ETHUSD pair, we can see an example of a confluence, the confluence comprises of a major support line, RSI indicating oversold, even the Moving average indicating an upward trend, the combination of the technical indicators (RSI and the moving average) and the technical analysis tools (Support line) to get an entry point for a bullish trend just happen in the chart.
False signal has become rampant in the market because most traders have only relied on the technical indicators both leading and leading. It is of high importance to eradicate false signals if possible. How can this be achieved? This can be achieved by the use of Confluence which is the combination of a technical indicator and a pure price action to confirm an entry point, trend, or even an exit point in the market.
This can be seen in the chat below.
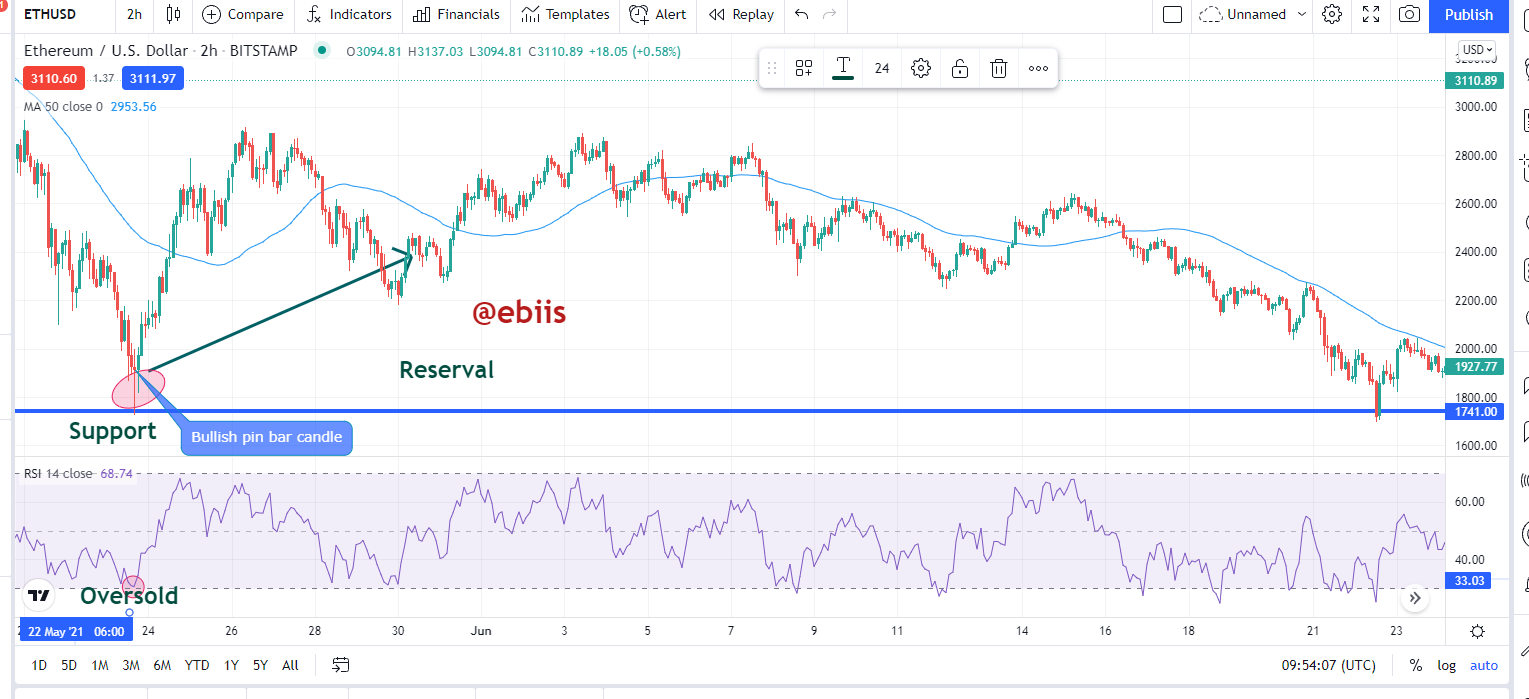
In the chart above of ETHUSD, the signal for a buy was gotten by the use of confluence. Which helped us eradicate the false signal. This is a combination of support, bullish pin bar candlestick which is pure price action, and the RSI which at that moment was indicating an oversold, and the moving average which also indicated a reversal in the trend to make it a bullish trend and an entry point for a bullish market.
b) Explain your understanding of divergences and how they can help in making a good trading decision.
Most of the time when using the RSI indicator, we normally see the price after reaching the overbought or oversold, it moves in the opposite direction thereby not obeying the predicted price direction of the RSI indicator. This can be said to be called a Divergence. As the name implies, the Price in the market is not moving in alignment with the technical indicator, this is called a divergence. Divergence is used to know when a trend is about to end and a new trend is also about to begin.
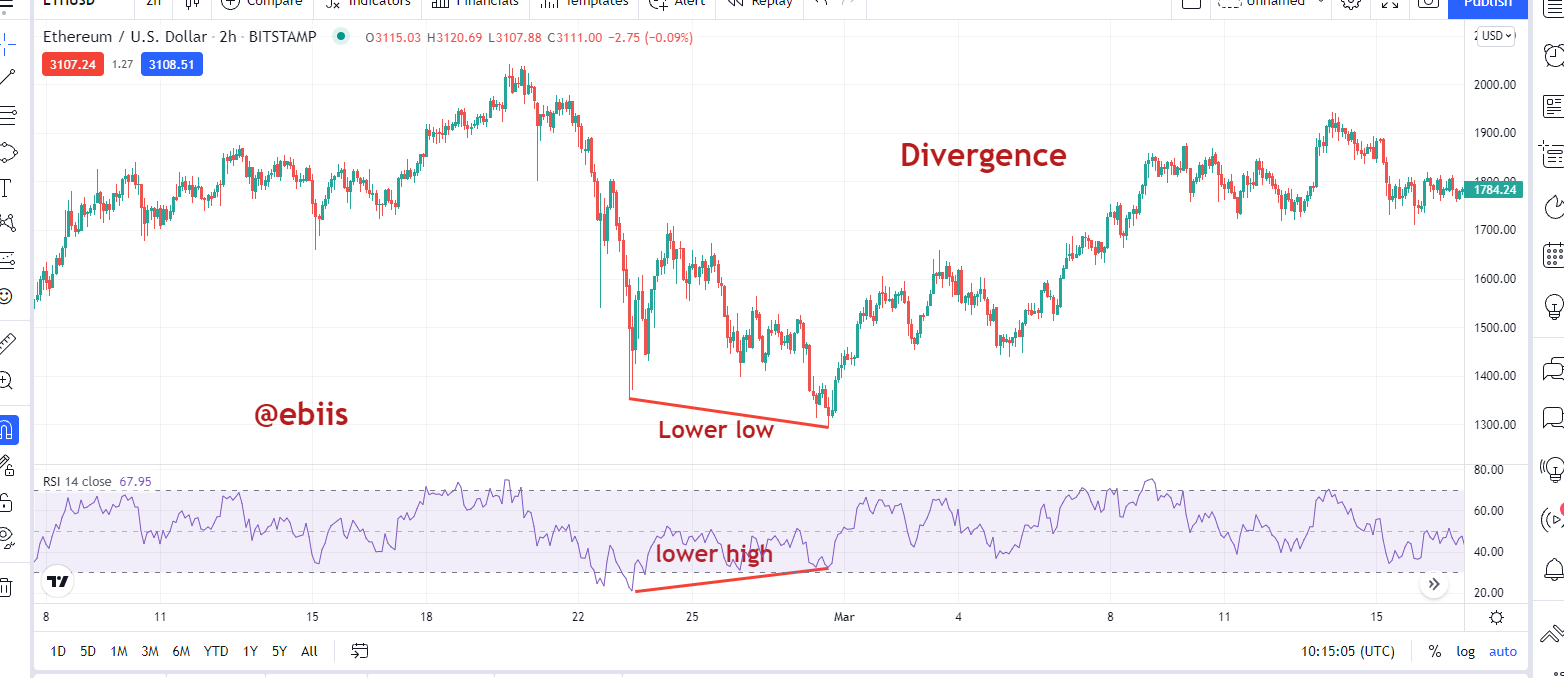
From the chart below, we can see that using the RSI, we spotted a divergence where the price was going lower low and the indicator was moving in a lower high direction.
This is a typical example of divergence.
c) Using relevant screenshots and an indicator of your choice, explain bullish and bearish divergences on any cryptocurrency pair.
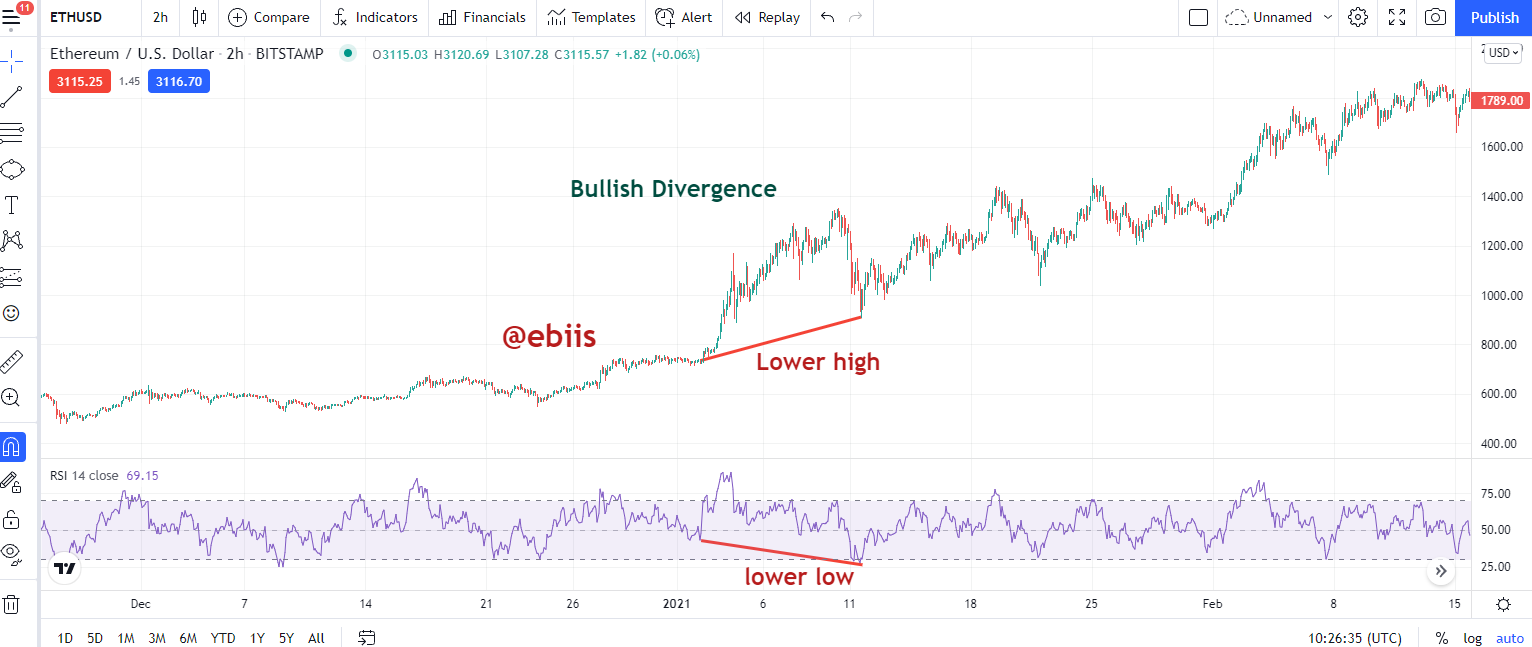
This is a Bullish divergence. This divergence normally occurs at the lower part of the candlestick. It normally leads to a change in the direction upward. Which can be called a bullish movement. We can see from our chart that the price was in a lower high direction while the indicator is in a lower low direction, making both of them diverge. The divergence leads to a bullish trend.
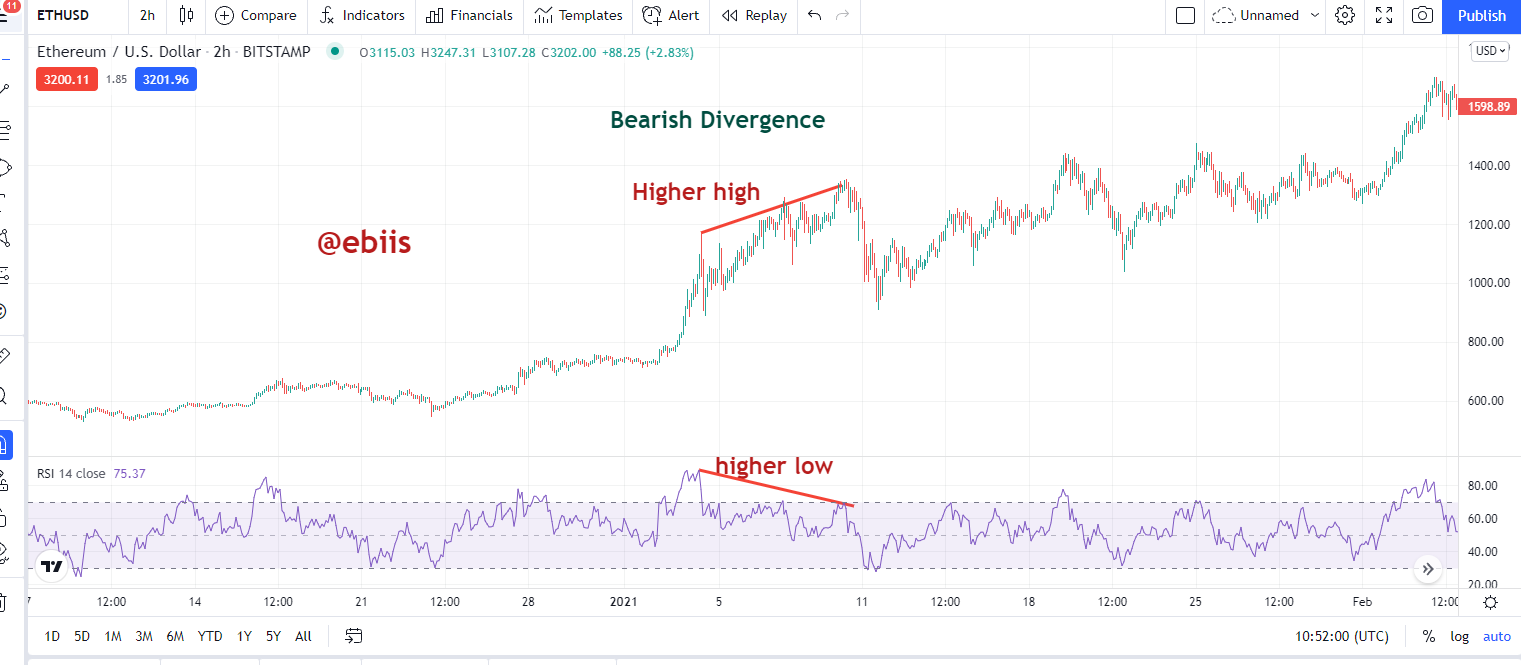
This is a Bearish Divergence. This divergence is the opposite of the Bullish divergence. The divergence normally happens at the top of the candlestick which leads to bearish movement of the price. It can be said that it forms a reversal pattern of price. This is seen from our chart when the price moves in a higher high direction and the RSI indicator moves in a higher low direction, causing a divergence there.
In conclusion, technical indicators are very good for traders to use but when combined with the technical analysis tools they become more better and reliable. For you to make it big in the crypto market you must have proper knowledge of the indicators and how to make use of them effectively.
Cc: @reminiscence01