Candlestick Parterns - Steemit Crypto Academy Season 4 - Homework Post for Task 10
Hello all, welcome to another of my fixed courses for the steemit crypto academy.

"1a. Explain the Japanese candlestick chart? (Original screenshot required)."
The Japanese candlestick chart is a price charting technique developed by Munehisa Homma around the year 1700.
The Japanese candlestick chart divides price data into the open, close, high, and low, with the Open position being the start of the price during that time interval, the Close position being the close of the price during that timeframe, the High position being the highest point price gets to during that time interval, and lastly, the Low position being the lowest point price gets to during that time interval.
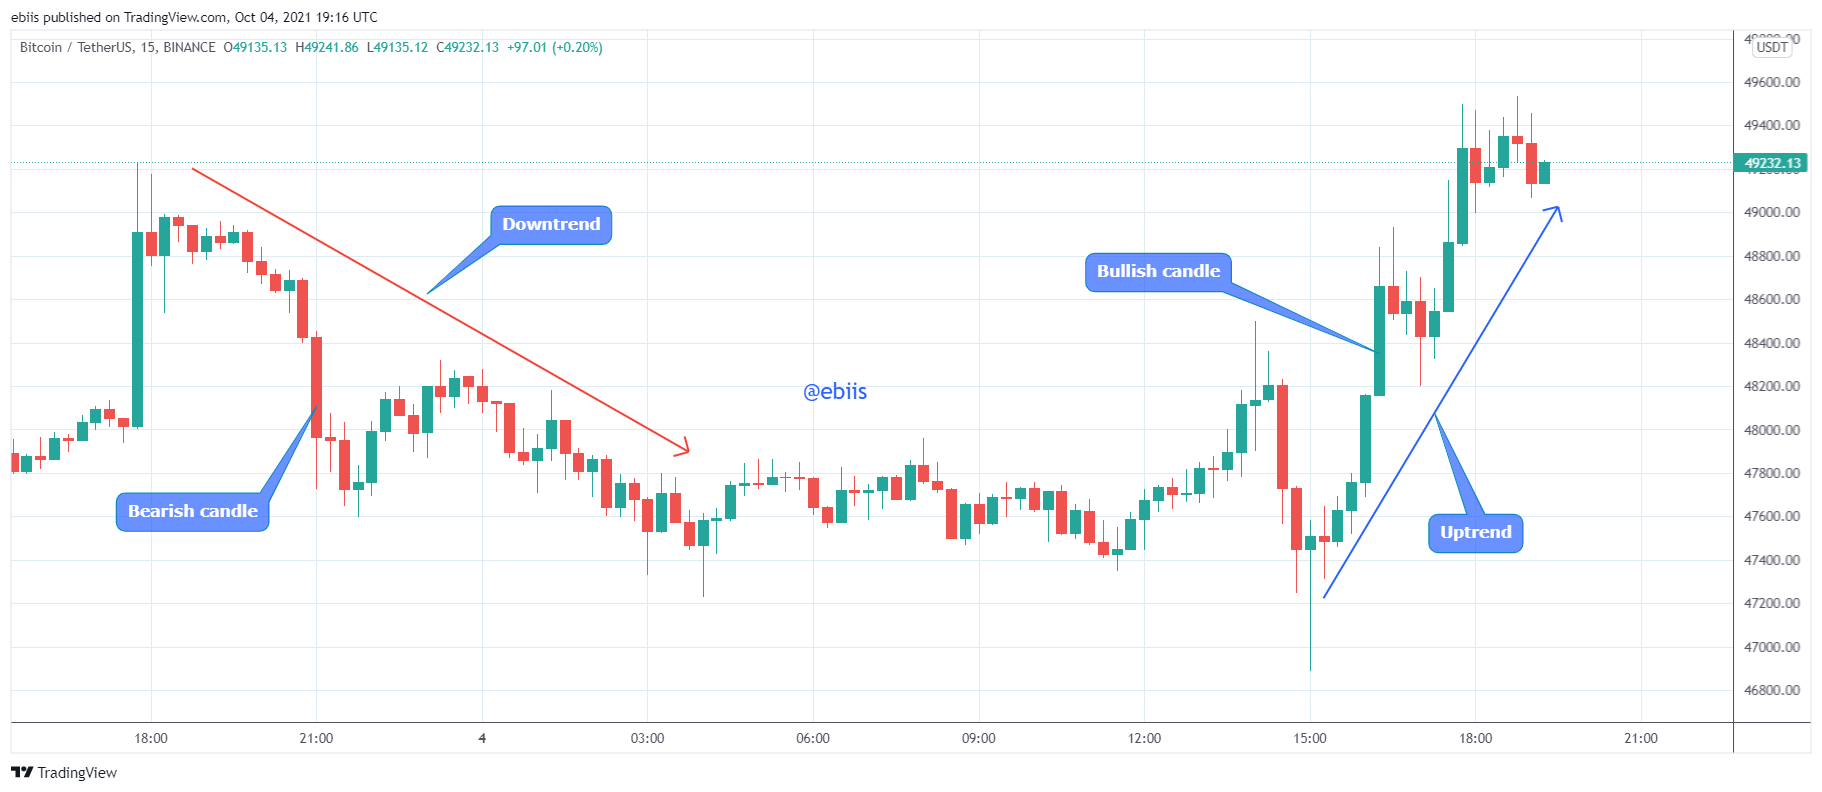
The Japanese candlestick with recent times has also become very colorful so traders can easily detect either bearish or bullish trends and make good quick positions.
Other Charting technique that seem similar to the Japanese candle stick are:
- The Heikin Ashi
- The Histogram charting technique
The Japanese candlestick is usually more preferred by traders because of its ease of charting, the amount of data it gives, and its brilliant colors. It is the only charting technique used by millennial traders.
"1b. In your own words, explain why the Japanese Candlestick chart is the most used in the financial market."
The Japanese candlestick chart is the most used charting technique because of the amount of data it gives traders in one picture.
The Japanese candlestick chart gives traders the open, close, high, and low data for every time frame traders had set for predicting price.
The Japanese candlestick chart also gives a good pictorial view of the bullish and bearish prices, with bullish candlesticks being either blue or green and bearish candlesticks being either red or black. This way traders can easily tell where the price is going and make profitable entries.
"1c. Describe a bullish and a bearish candle. Also, explain its anatomy."
As stated in question 1, the Japanese candle can either be bullish or bearish. Below is an explanation.
Bullish Japanese candlesticks start with a relatively low open position, then end up trending upward, closing with a higher position. The Bullish candlestick may have a bearish neck but the final position is always above the opening position.
Bullish candlesticks are usually blue or green, this way traders can easily spot them and make good entries.
Anatomy of Bullish Candlesticks
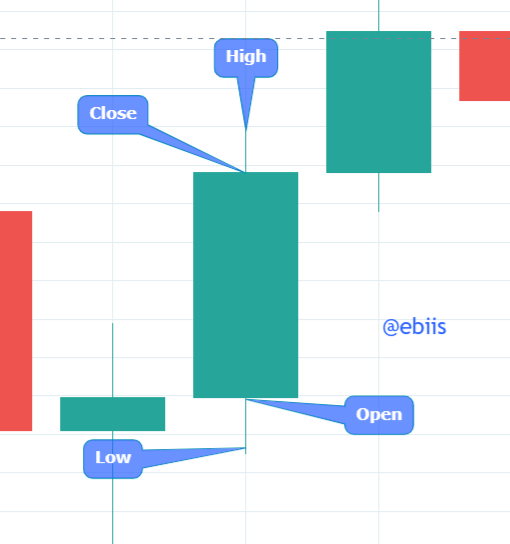
Open
This is the start position of the Candlestick, for bullish candlesticks, the open position is relatively lower
Close
This is the close position of the candlestick, for a bullish position, the close position is relatively higher
High
This is the Highest point price went during the time interval, the high position is independent of the trend of the candlestick.
Low
This is the Lowest point the price went during the timeframe, the low position is independent of the trend of the candlestick.
Bearish candlesticks are downward-going candlesticks as their open positions are relatively higher than their close positions. Bearish candlesticks start with a higher open position then trend downward closing lower.
Bearish candlesticks are usually colored red or black, this way traders can easily spot them and make good entries.
Anatomy of Bearish Candlesticks
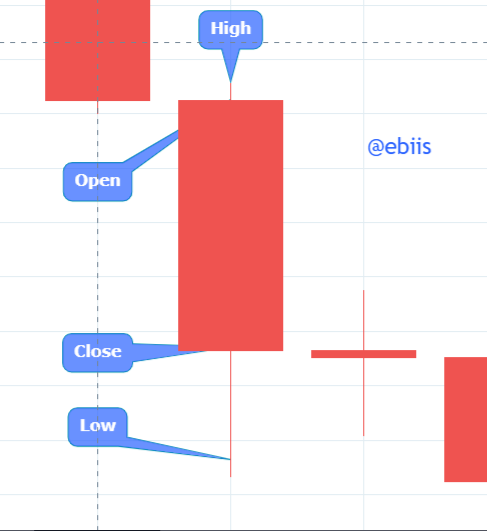
Open
This is the start position of the Candlestick, for bearish candlesticks, the open position is relatively higher
Close
This is the close position of the candlestick, for a bearish position, the close position is relatively lower
High
This is the Highest point price went during the time interval, the high position is independent of the trend of the candlestick.
Low
This is the Lowest point the price went during the timeframe, the low position is independent of the trend of the candlestick.
The Japanese candle stick has been widely accepted as a charting technique because of its simplicity and details.
Thanks to professor @reminiscence01