Steemit Crypto Academy | Season 3: Week 7 || How to create an account on TradingView, how to use indicators,tools, features of tradingview
1. Define the trading view website and how to register an account in trading view. What are the different registration plans?
Trading view is a social networking service used by traders to study charts, chat with fellow market enthusiasts and get information and carry out analysis of different markets and also place trades. When it comes to technical analysis, trading view has a wide array of tools and an easy to use user interface which makes it a very good option to use for technical analysis. Since changes in the market are quickly reflected here, it gives users accurate data they can work with to carry out analysis properly.
Registering an account in trading view is quite easy. One can go to their website or download the app on chrome. An option will be given for you to sign up and link any of the following to your account.
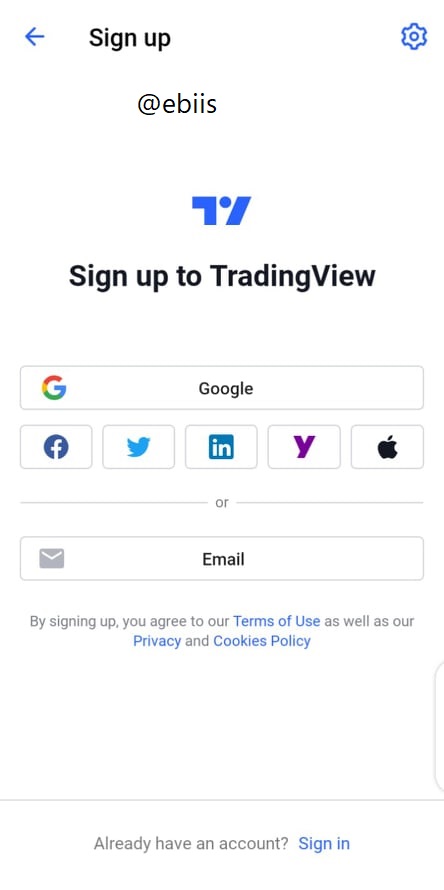
I'm choosing my email. It then opens up to a page to put in your username, email address and password. Your username is usually a unique one. Here is a screenshot below;
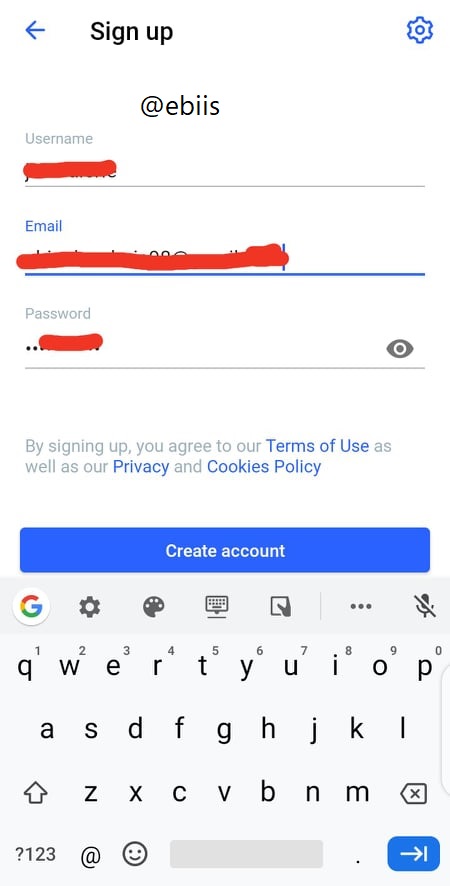
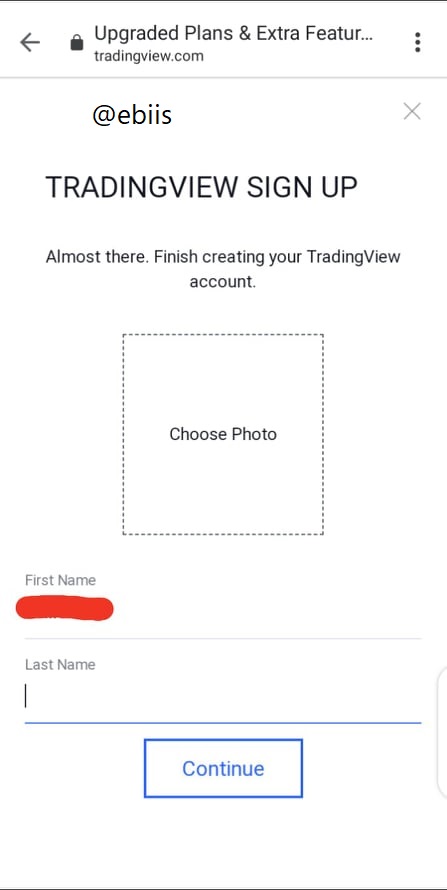
A link is then sent to your email to complete the registration process. It opens up to a page with the screenshot below. After filling in everything, you then click on continue and your registration is done.
There are different registration plans.
The free basic plan: this is advisable for traders and investors who are still just starting. Although you could get adverts occasionally, it shouldn't be too much of a big problem. This is the account that you use when you first sign up on trading view. There's a lot of limits especially on the number of tools one is allowed to use.
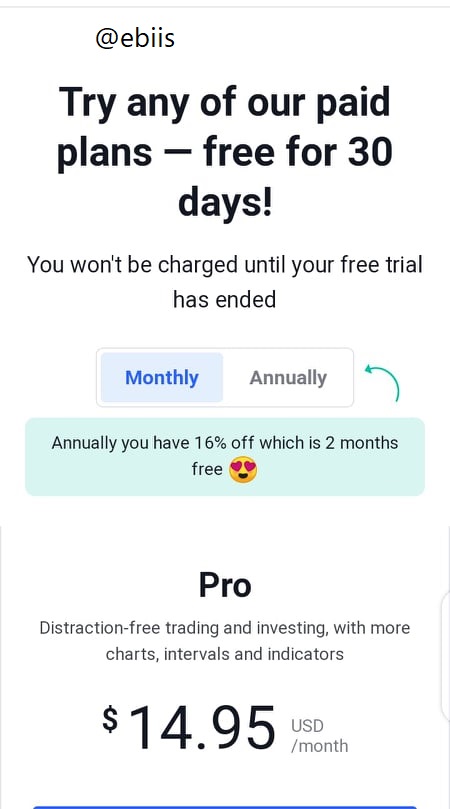
The pro plan: This contains features listed on trading view. These includes the removal of ads, 5 indicators per chart, volume profile indicators and others. There's also the added advantage of removed ads. One can get a free one month plan as to get a feel of the plan before paying. You can choose to pay monthly or annually and the fee is written boldly. Here's a screenshot below;
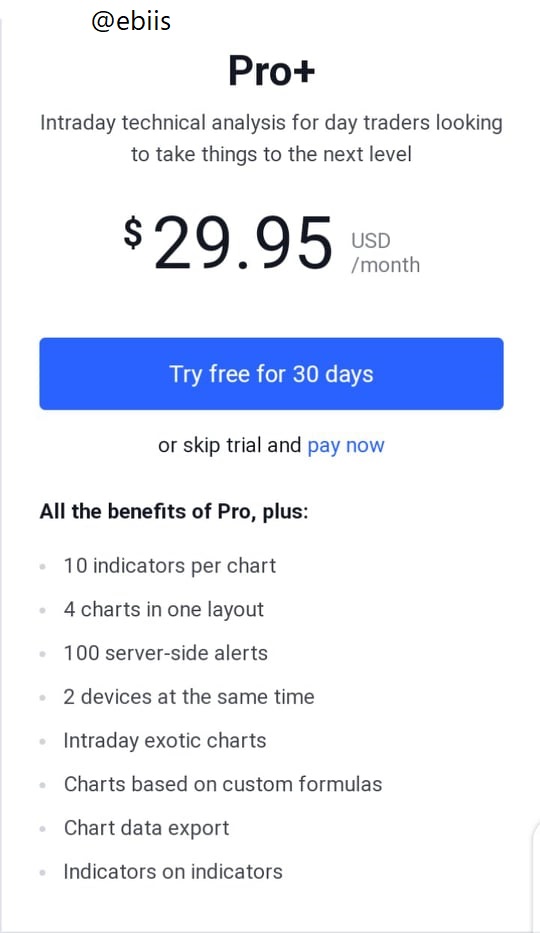
The pro plus plan: This gives access to more indicators per chart, intraday exotic charts and many added advantages listed there. This is of course more expensive than the pro plan. Here is a screenshot below;
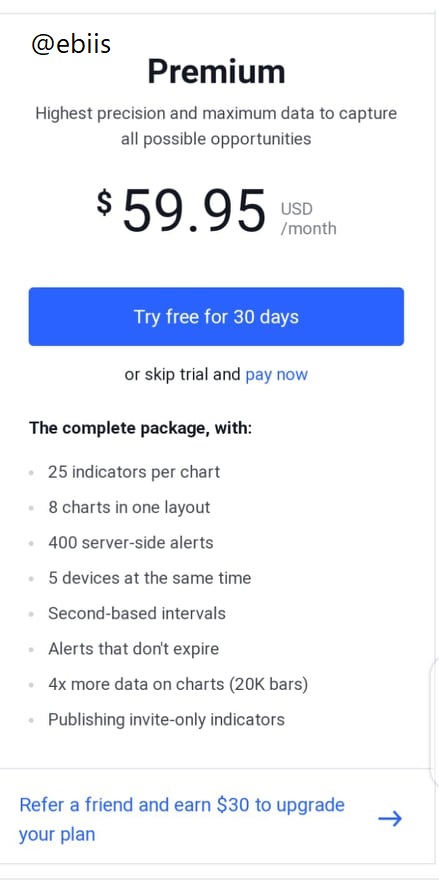
The premium plan: As stated on their page, it gives highest precision and maximum data. One can use up to 25 indicators per chart when using this plan and data up to second based intervals. This is practically the most rounded package among all. Screenshot below
2. Explain the different features of trading view. What is your favorite feature and why?
I will be showing a screenshot of different features below.
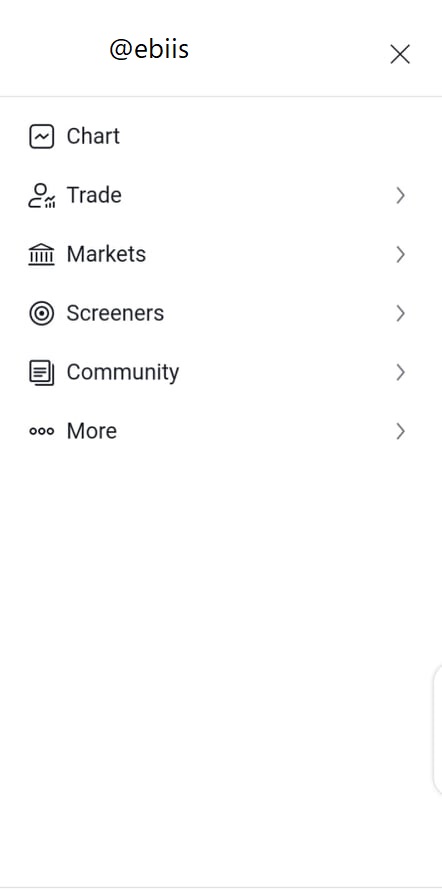
Chart: This shows the price fluctuations of different commodities in the form of a chart. Any form of analysis is usually performed using data displayed on the chart. One could set the time frame one wants to be reflected in the chart.
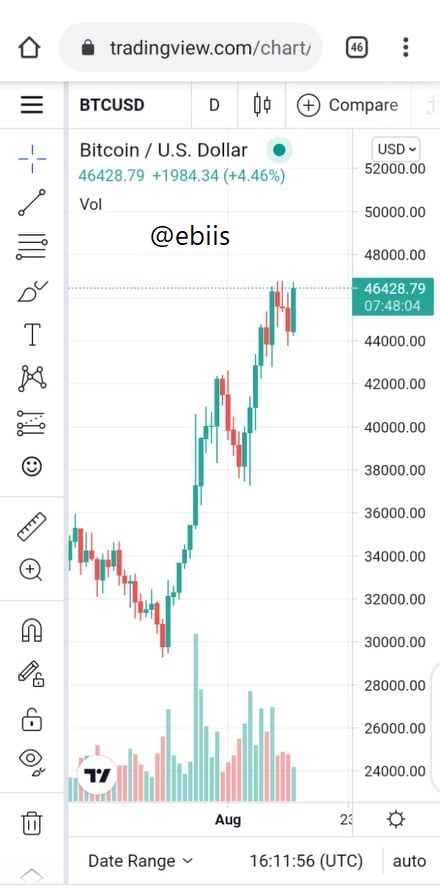
This is an example of a BTC/USD chart
Trade: This shows options for top brokers on trading view and Broker awards.
The option for top brokers is a list of top brokers on trading view. It shows their ratings, reviews, their offers and what they offer. People can then get a chance to choose which they want after going through this information instead of choosing blindly.
The option for broker awards is a list of the most prominent brokers in different areas, rated based on genuine reviews from people. It contains different categories like broker of the year, social champion, best crypto broker or exchange and so on
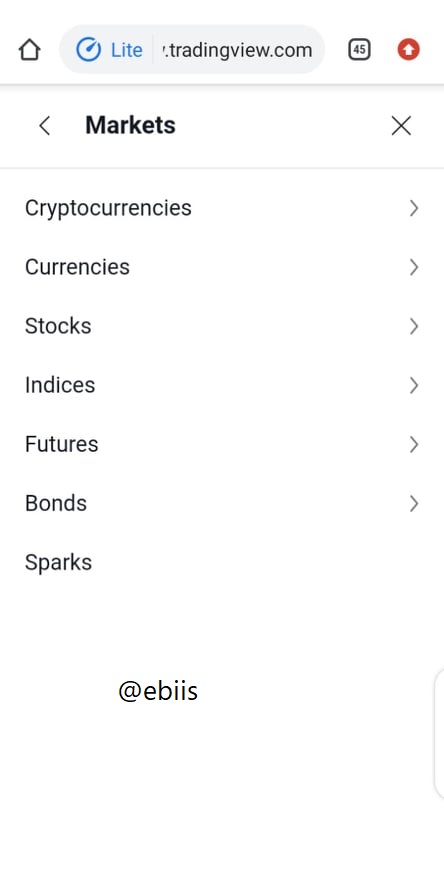
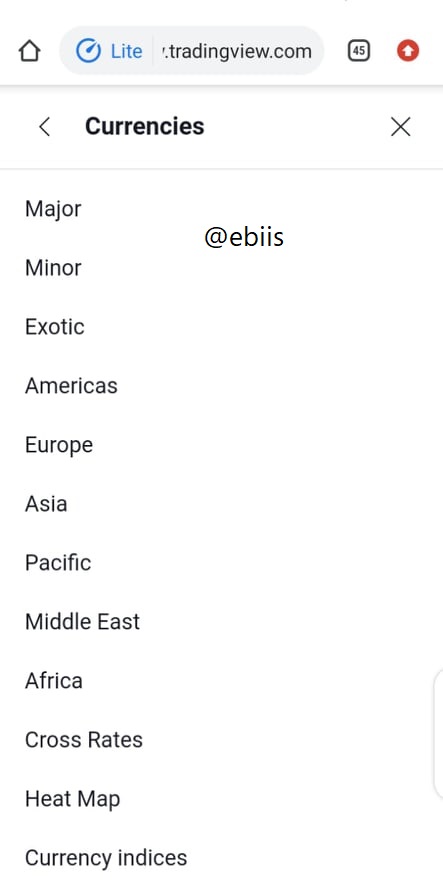
Markets: These show the options of different markets available on trading view. They include crypto currencies, currencies, stocks, indices, futures, bonds and sparks. Each option shows everything you need to know concerning the market for the different options available on trading view. Here is a screenshot of the "currencies" option.
Screeners: This tool helps traders and investors narrow down on their options based on their preferences and it makes things way easier for users. There's options for either stock screener, forex screener and crypto screener.
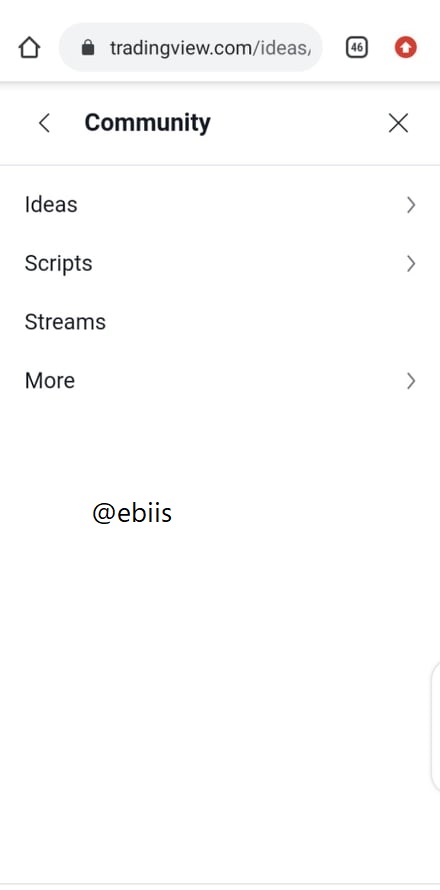
Community: Just like the name implies, users can get access to different opinions and get to learn a lot from here. A lot of information available about different indicators, trends and a lot. There's so much to learn here.
More, which includes pricing, features, help center, about and options for business.
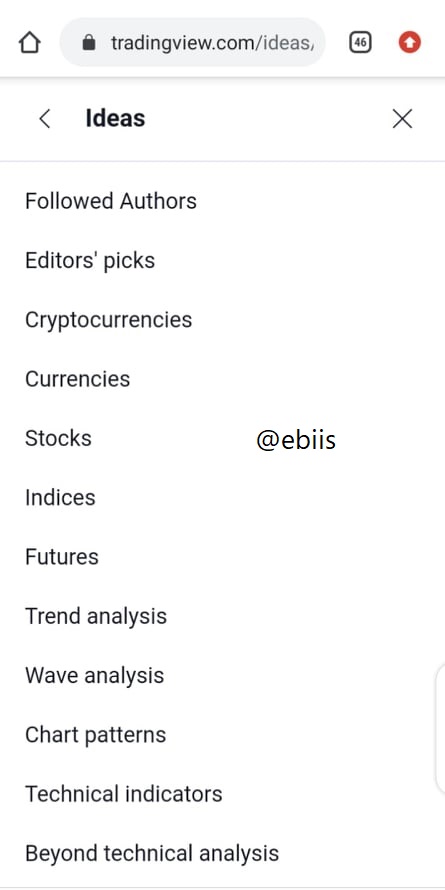
My favorite feature has to be the community. Screenshots of it's features are seen above. It has such a wide range of things to learn especially for someone new and is still trying to get a grasp of everything, like me. The option for ideas as seen there is really fascinating. A lot of forecasts and opinions with different reasons for them. One can learn almost anything one wants to learn as there are trading ideas, educational ideas and scripts. Take an example, learning about Fibonacci, here is a screenshot below of different attempts at explanations.
3. How to set up a chart in trading view and use two tools to edit it.
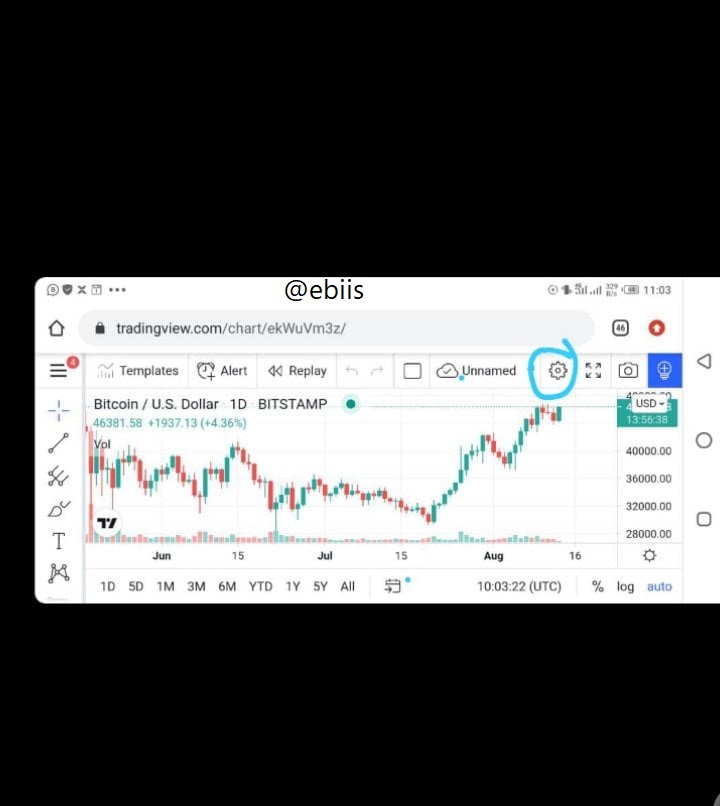
This is quite easy to navigate. You can click on the "chart" option as seen in the screenshot below. Different people like to customize their charts in a certain way for faster and better understanding of things their way and for it to be more pleasing to the eye.
To set up a chart, we can go to settings, as shown in the screenshot below.
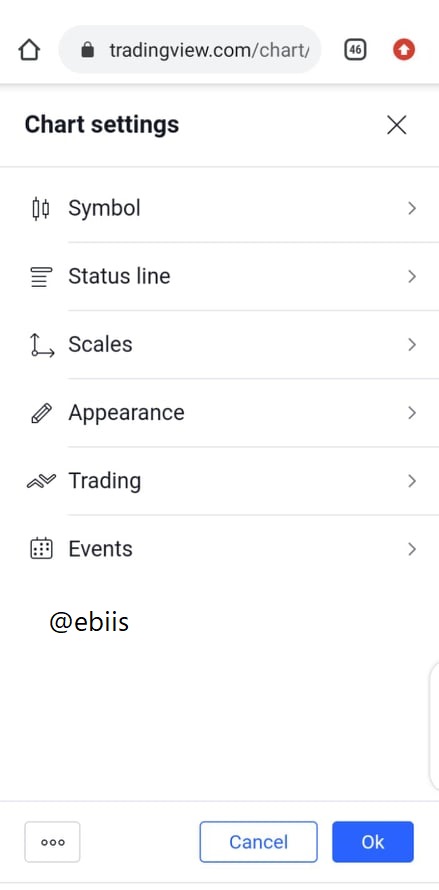
From there, we are shown options of settings for symbol, status line, scales, appearance, trading and events.
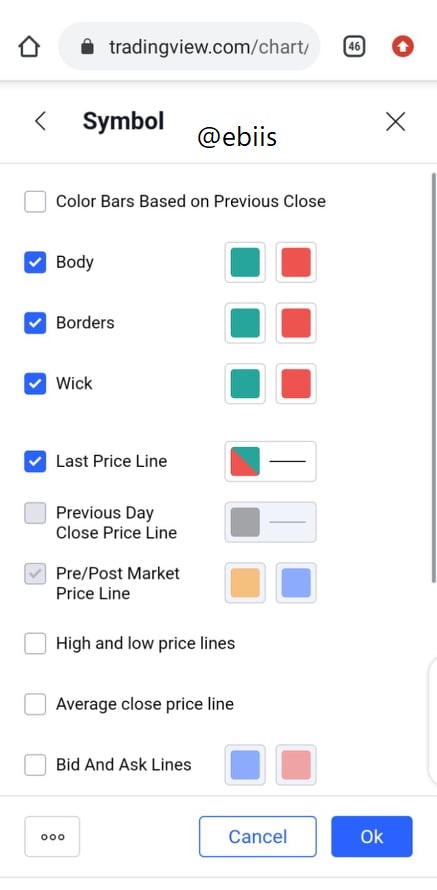
For the symbol for example, we have options for Body, Borders, Wick, we can change the colors of these to whichever one we want. We can even put our one time zone. Here is a screenshot below.
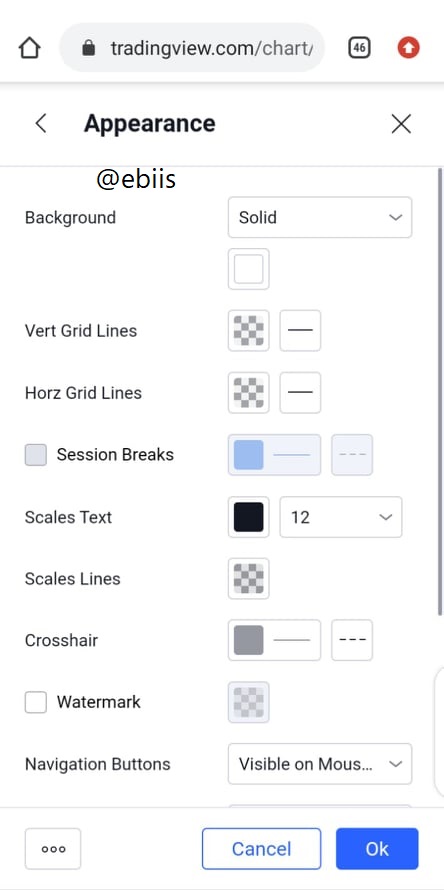
Let's take another one, the appearance. Here, we can see different options for different colors, certain background colors, even certain margin sizes.
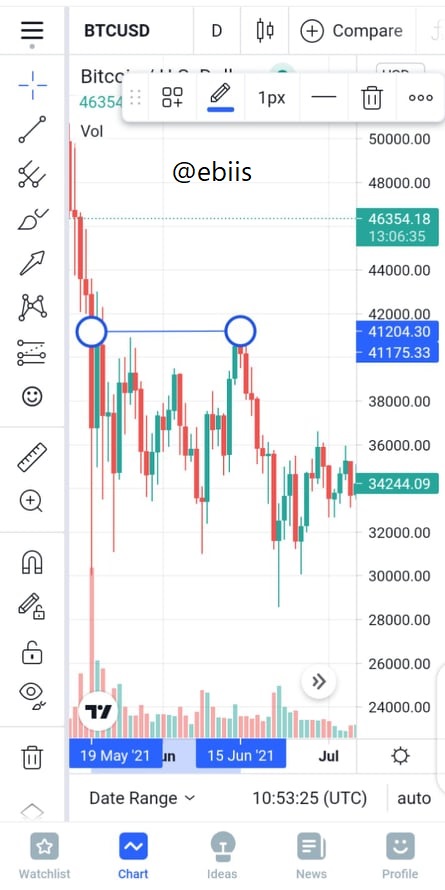
We're going to be using two tools to edit our chart below
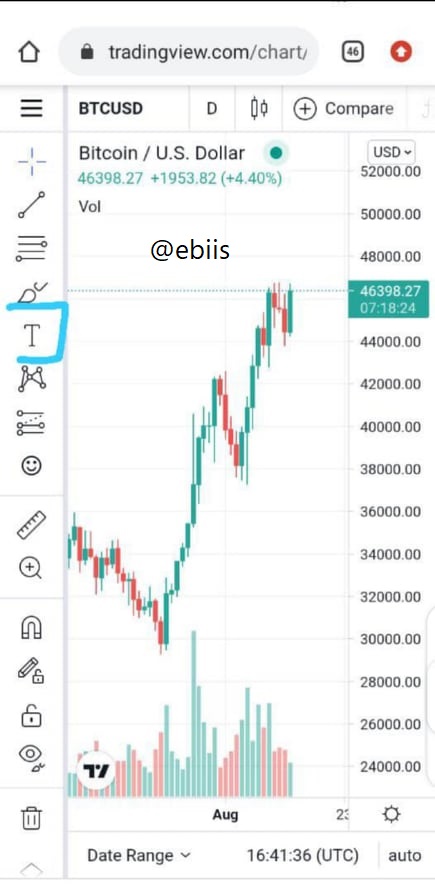
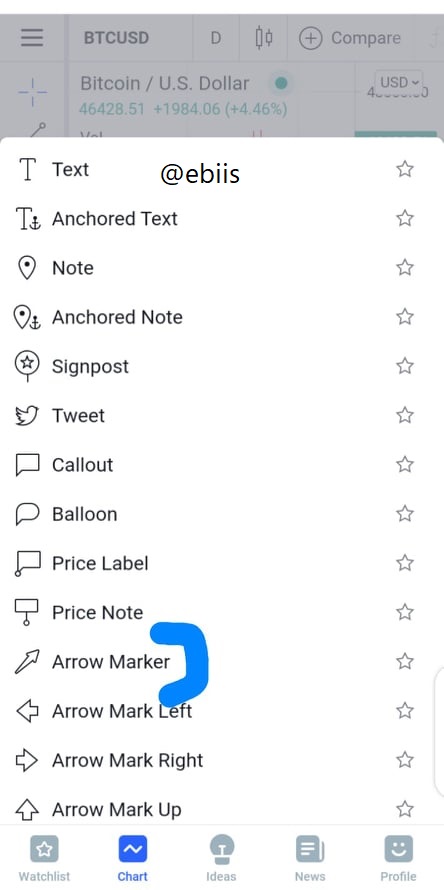
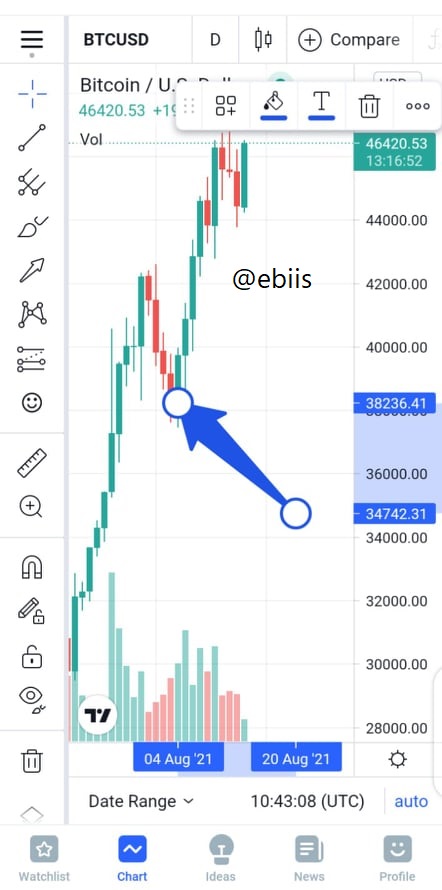
I'm going to be using the tool marked "T" for text. It opens to a drop down menu on which different options are displayed. As shown in the screenshots below. I'll be clicking on "arrow marker". Then clicking on the point where you want the arrow to point to, you then drag out the arrow from that point. Note that you can customize the look of this arrow to the way you wish for it to look. Options for this are shown on the top right of the chart.
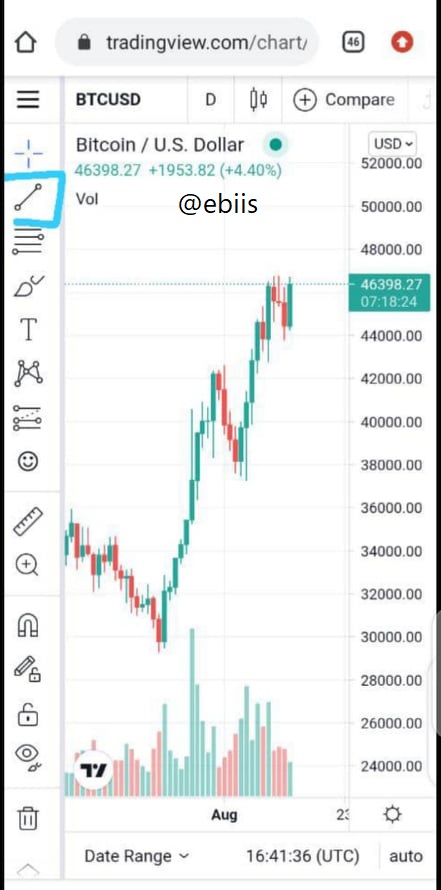
The second is the trend line. Like we did with the previous one, we click on the symbol and options open before us. Click on the one in particular you want, in my case, trend line. We then click on a point in the chart and drag out our trend line.
4. Explain how to add indicator in chart. What is your favorite indicator and why?
The ability to add indicator to our chart on trading view is one of it's enormous advantages although the number of indicators one can add per chart varies, depending on the particular plan one is using as discussed above.
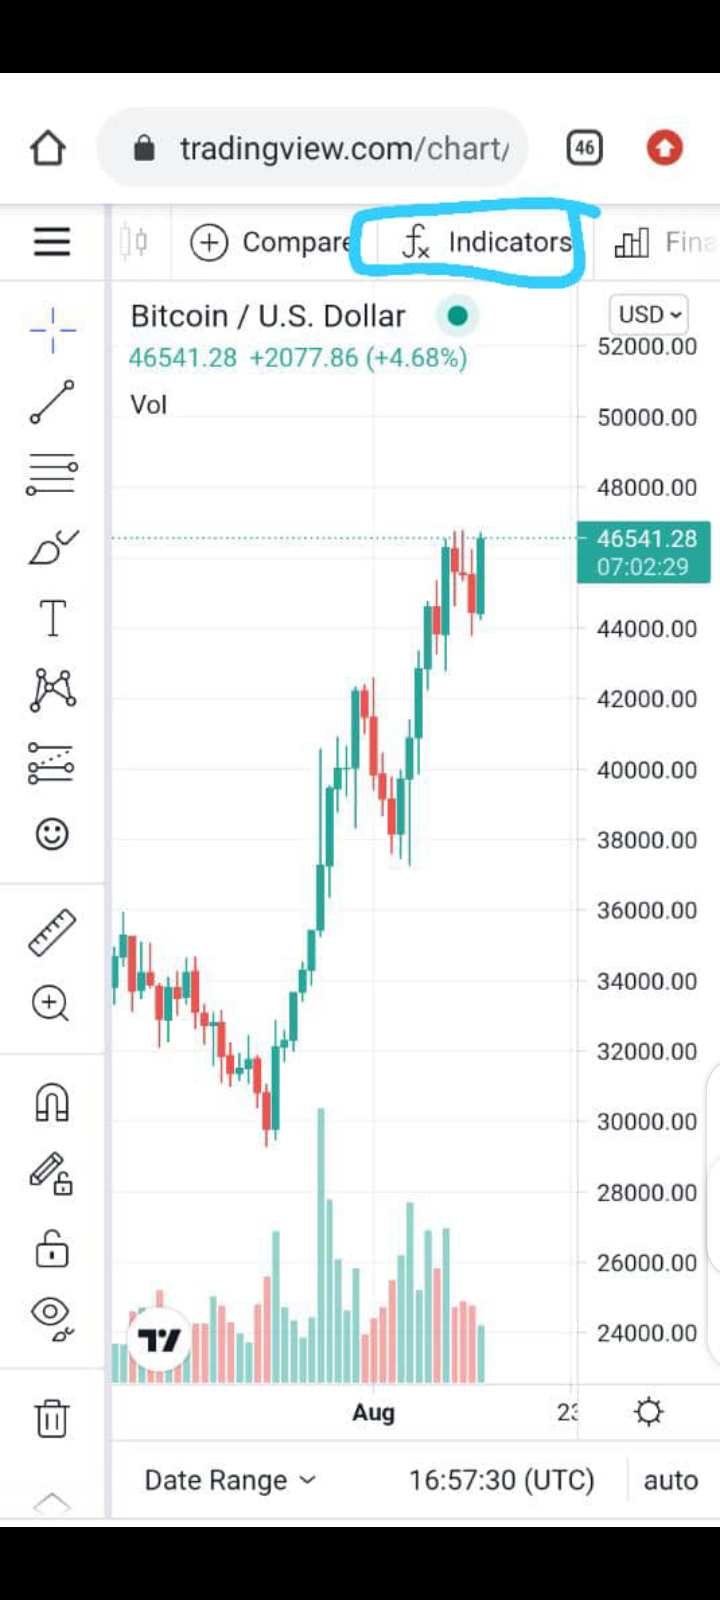
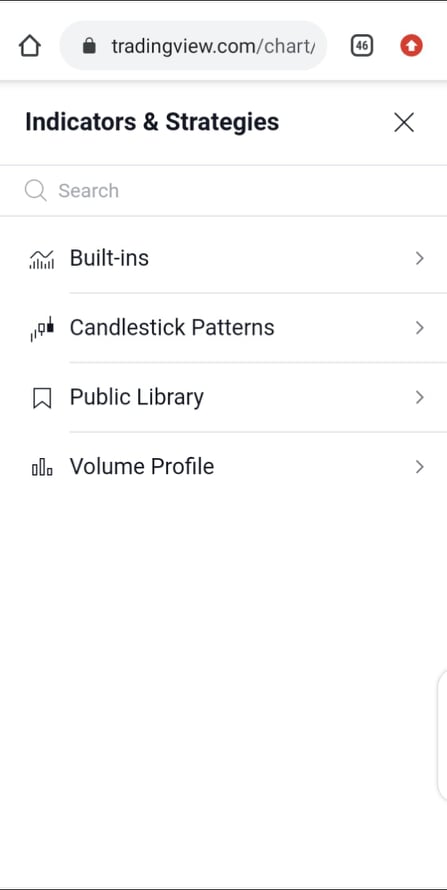
Adding an indicator to a trading view chart is equally quite easy to do. Looking at the top of the chart, the options for indicator is written above with the fx symbol beside it. When you click on this another menu bar pops up. You can search for the indicator you want or you can go through the options to get whichever you want. There are options for "Built-ins" showing trading view built in indicators, options for "candlestick patterns", showing different candle stick patterns, "public library" showing options of different users and their indicators and "volume profile".
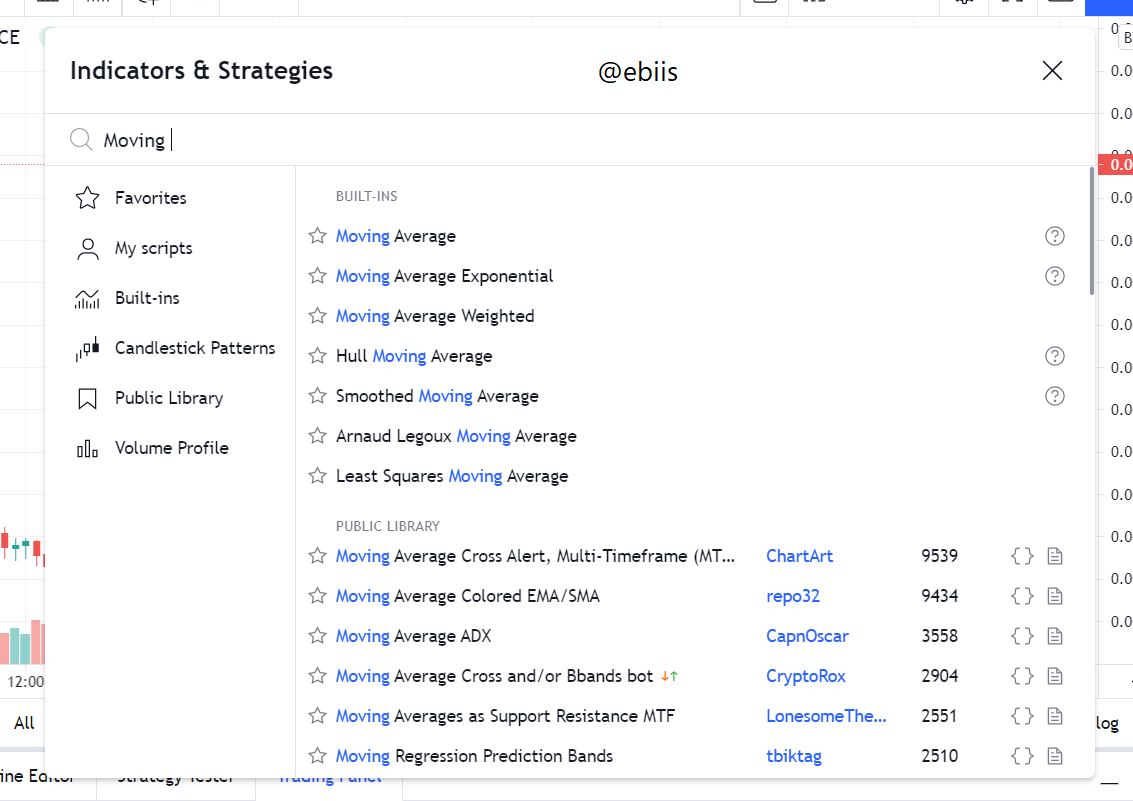
By typing out the indicator I want, in this case, moving average and this has been added to the chart as shown below.
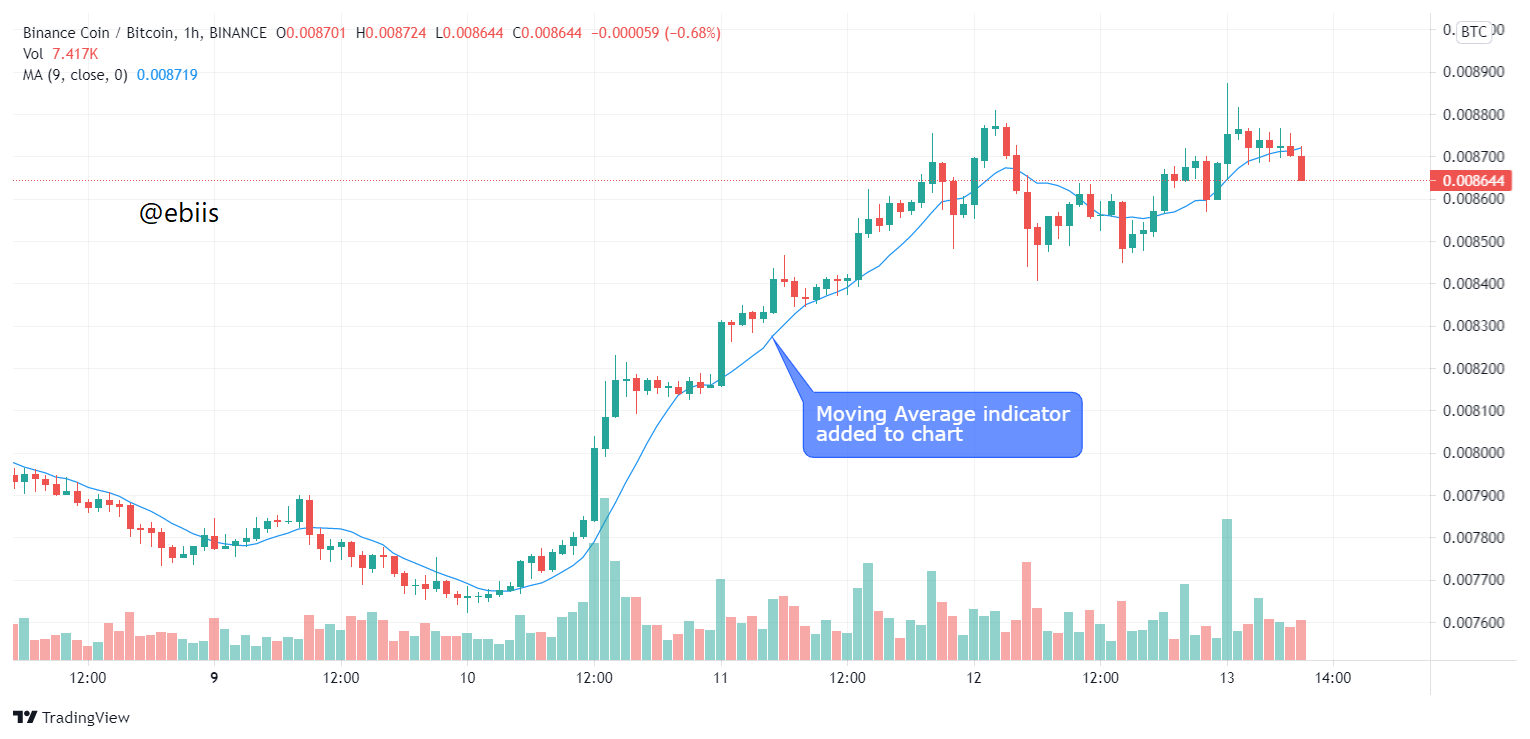
My favorite indicator is the moving average, as it is really simple to use and can be used to get support and resistance lines. It also gives us a kind of basic laid back view of the trend so your can then use other indicators to predict how the trend will go based on previous information.
5. Do you think trading view is useful in predicting the market for crypto currency trend/price?
Yes, I do think trading view is very useful in predicting the market for crypto currency trends and prices as it's wide array of tools are very useful for technical analysis which is used to predict the market. You can see that on the chart page as we attempted to show a few. In fact, almost everything that would be needed for technical analysis is there and could be at one's disposal, depending on the plan one is using. Even the "community" feature can prove very useful in fundamental analysis as a lot of current news in the crypto space can be found there and one can be able to discuss ideas with other people interested in the crypto market and know what the public is saying.
6. Conclusion
In conclusion, trading view is a unique website that is used by traders, investors, market enthusiasts or whatever people interested in different markets. They cater for the needs of stock market traders, currency, crypto, indices, futures bonds, sparks and forex traders and they have features which makes analysis easier and faster for traders like the screener and others which we have learned. They also provide a form of social networking platform where traders can chat with each other and get better as time goes on.
Respected first thank you very much for taking interest in SteemitCryptoAcademy
Season 3 | intermediate course class week 7
thank you very much for taking interest in this class,