Crypto Trading with Moving Average - Steemit Crypto Academy - S6W2 - Homework Post for @shemul21
Hello All Steemians !!!
Today I'm going to make my Steemit Crypto Academy Homework task by professor @shemul21 that talking about Crypto Trading with Moving Average. Actually I have very little knowledge about this, but on this occasion I will try to discuss it to improve my writing skills.


Explain Your Understanding of Moving Average
In the world of cryptocurrencies, trading using technical indicators is an important factor that every trader should do before executing a trade properly. Technical indicators play an important role in helping traders to analyze the cryptocurrency market over time. Moving Average is one of the technical indicators that is very good and popular among traders where this indicator is able to identify price movements and market trends so that traders can place buy or sell entries well.
Moving Average is an indicator that is very effective and has a good level of accuracy in analyzing price movements because this indicator runs based on the mathematical equation of each candle that is formed on the graph and price data within a certain period of time. This indicator gives traders several indications regarding the current trend, trend reversals and profitable trading signals. It is able to filter out the high volatility that occurs in the market so that every trader can execute trades at the right time based on the results of the analysis.
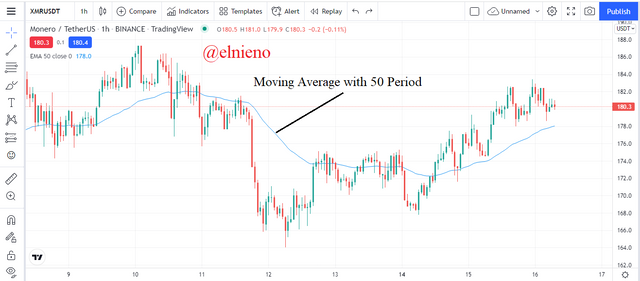
Based on the chart above, I analyzed the XMR/USDT market using a 50-period Moving Average. This period can be configured according to the trading strategy of each trader. This indicator shows a Moving Average line that identifies the current price movement and trend. XMR/USDT price movements indicate rising prices and an uptrending market. This indicator also functions as dynamic support and resistance that traders can use as a reference to place buy or sell entries that can maximize profits and minimize losses in executing trades.
What Are The Different Types of Moving Average? Differentiate Between Them
Simple Moving Average (SMA)
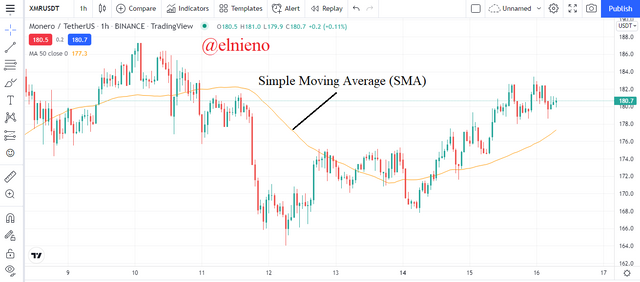
Simple Moving Average is a type of moving average that has a simple mathematical calculation. This indicator runs based on price data and each candle that forms on the chart within a certain time frame. This shows the calculation of all price data equally so that the resulting analysis corresponds to the actual over the period configured by the trader. This indicator shows dynamic lines that move according to volatile price movements. This is shown as the chart below:
Simple Moving Average formula is as follows:
- SMA = ( A1 + A2 +...+An ) / n
- A = Price / data point in given time period
- n = Time period
Exponential Moving Average (EMA)
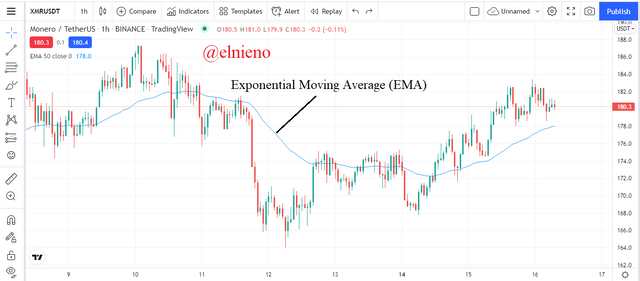
Exponential Moving Average is a type of moving average that is similar to the SMA but has a more complicated mathematical calculation. This indicator has a higher level of accuracy because its calculations have better weight for changes in the latest price data and each candle that is formed on the chart. This indicator is more suitable for traders who run short-term trading strategies because it has a faster response. The combination of SMA and EMA can be used by traders to determine short-term and long-term price movements so as to increase accuracy to provide good trading signals. This is shown as the chart below:
Exponential Moving Average formula is as follows:
- EMA = [Price Today × (smoothing / 1 + days)] + EMA Yesterday × [1 - (smoothing / 1 + days)]
Weighted Moving Average (WMA)
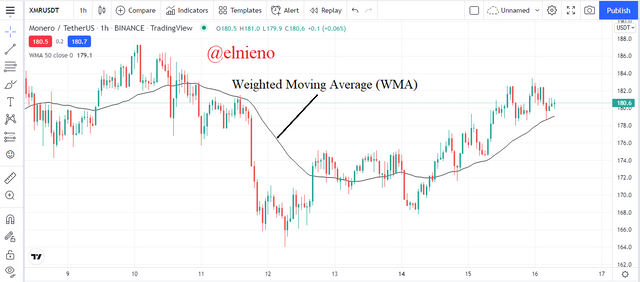
Weighted Moving Average is a type of moving average that focuses more on current price data than previous price data. This indicator also has a complicated mathematical calculation because it shows a greater weight on the latest price data and a smaller weight on the previous price data. This indicator shows a faster response than SMA and EMA so it is very suitable for short-term trading strategies because any price changes in the market will be identified quickly. This is shown as the chart below:
Weighted Moving Average is as follows:
- WMA = (Price1 × n + Price2 × (n - 1) +...Price n) / [n × (n + 1)] / 2
Difference Between EMA, SMA and WMA
| SMA | EMA | WMA |
|---|---|---|
| SMA has simple mathematical calculations based on actual price data within a certain time period | EMA has complex mathematical calculations based on current price data and multiplier | WMA has complex mathematical calculations based on more focus on the latest price data than previous price data |
| SMA is more suitable for long-term trading strategies because the indicator has a slow response to price changes | EMA is more suitable for short-term trading strategies because the indicator has a fast response to price changes | WMA is more suitable for short-term trading strategies because the indicator has a faster response to the latest price changes |
| SMA that has a higher value is better at providing accurate trading signals and good analysis | EMAs with lower values are better at providing accurate trading signals and good analysis | WMA which has higher and lower values is equally good at providing accurate trading signals and good analysis |
The difference between the SMA, EMA and WMA lines with the same period on the chart is as follows:
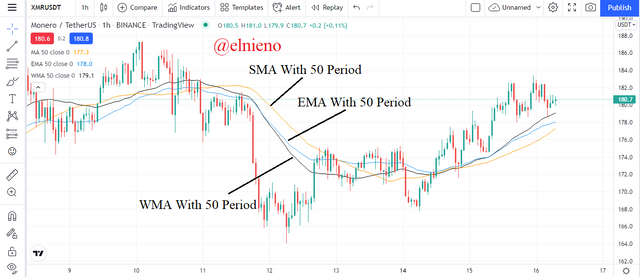
Based on the chart above, the difference between SMA, EMA and WMA on the XMR/USDT market chart shows a line that moves based on price movements according to their respective calculations. SMA has a line that is far from the candle and this is useful for long-term trading strategies. EMA has a line close to the candle because of the smoothing or multiplier and this is useful for short-term trading strategies. WMA has a line that is closer to the candle because it has a faster response to changes in the latest candle and this is useful for short-term trading strategies. The use of these 3 types of Moving Average indicators can be used and configured by traders according to their respective trading strategies to produce accurate analysis and profitable trades.
Identify Entry and Exit Points Using Moving Average
In executing trades using technical indicators including Moving Averages, traders must determine entry and exit points as one of the main points in the trading process. This can be done by traders using a combination of SMA with 50 periods and EMA with 25 periods. The SMA indicator serves as a trading signal with a higher calculation and can be used as an exit point slightly below the SMA line. And the EMA indicator functions as a trading signal with a lower calculation and can be used as an entry point at the right time because it has a faster response in the market.
Buy entries and exits can be identified by traders by analyzing the SMA and EMA lines on the chart. When the market is uptrend, the price movement shows an increase and the SMA and EMA lines are below the candle. The EMA line can act as dynamic support and the trader can place a buy entry on the next bullish candle. Dynamic support points are confirmation that the market is in a strong uptrend and is also a buy signal. Exit points such as stop loss levels can be set below the SMA line and take profit levels can be set at a ratio of 1:2.
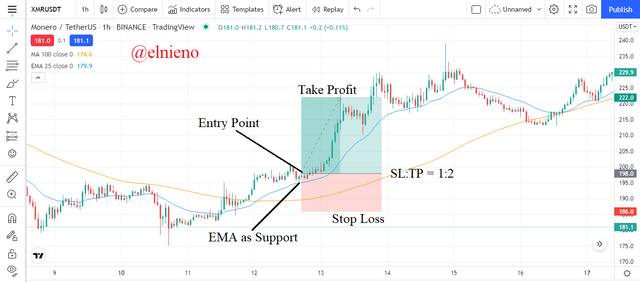
Based on the chart above, the XMR/USDT market is showing a rising price and an uptrend. After a trend reversal from a downtrend to an uptrend, the SMA and EMA lines are below the candle that follows the price movement. I analyzed the 25 EMA line which acts as dynamic support and placed a buy entry on the next bullish candle. I set a stop loss level below the 100 SMA and a take profit level with a ratio of 1:2.
Sell entries and exits can be identified by traders by analyzing the SMA and EMA lines on the chart. When the market is downtrend, the price movement shows a downcrease and the SMA and EMA lines are above the candle. The EMA line can act as dynamic resistance and the trader can place a sell entry on the next bearish candle. Dynamic resistance points are confirmation that the market is in a strong downtrend and is also a sell signal. Exit points such as stop loss levels can be set above the SMA line and take profit levels can be set at a ratio of 1:2.
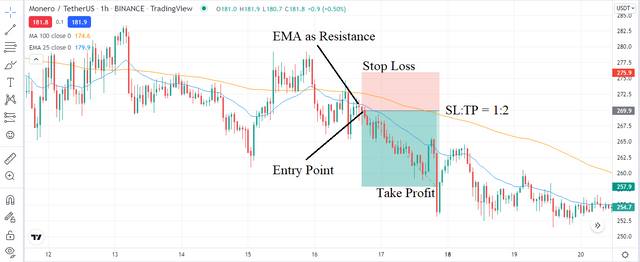
Based on the chart above, the XMR/USDT market is showing a falling price and a downtrend. After a trend reversal from an uptrend to a downtrend, the SMA and EMA lines are above the candle that follows the price movement. I analyzed the 25 EMA line which acts as dynamic resistance and placed a sell entry on the next bearish candle. I set a stop loss level above the 100 SMA and a take profit level with a ratio of 1:2.
What do you understand by Crossover? Explain in Your Own Words
Moving Average crossovers are indications that traders can analyze on the chart to determine the beginning of a trend reversal relying on a combination of SMA and EMA indicators. The beginning of a trend reversal is one indication that needs to be analyzed because traders can buy or sell cryptocurrency assets at favorable times. This combination shows two moving averages moving fast and slow. Here EMA serves as a fast moving indicator because it only requires some price data in its calculation and SMA serves as a slow moving indicator because it requires a lot of price data in its calculations.
Traders can place buy orders when the market shows an uptrend and rising price movements. Here the EMA line acting as a fast moving indicator will cross the SMA line acting as a slow moving indicator. When the crossing of these two lines occurs it confirms that the beginning of the trend reversal from downtrend to uptrend and is also a signal to place a buy entry. This cross shows the EMA line is above the SMA line and the EMA line is closer to the candle on the chart than the SMA line.
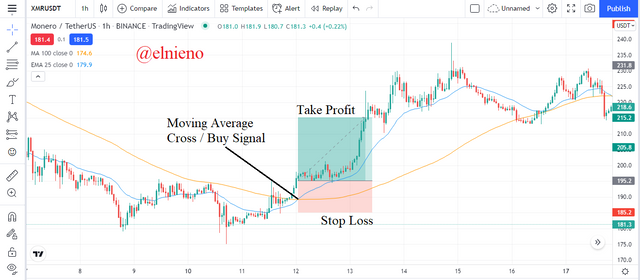
Based on the chart above, the XMR/USDT market is showing an uptrend and rising price movements. I analyze the EMA line acting as a fast moving indicator cross the SMA line acting as a slow moving indicator. The EMA line is above the SMA line indicating a cross where this is the beginning of a trend reversal from downtrend to uptrend. Here I can place a buy entry after the breakout candle on the chart and set the stop loss level below the SMA line and the take profit level with a ratio of 1:2.
Traders can place sell orders when the market shows a downtrend and falling price movements. Here the EMA line acting as a fast moving indicator will cross the SMA line acting as a slow moving indicator. When the crossing of these two lines occurs it confirms that the beginning of the trend reversal from uptrend to downtrend and is also a signal to place a sell entry. This cross shows the EMA line is below the SMA line and the EMA line is closer to the candle on the chart than the SMA line.
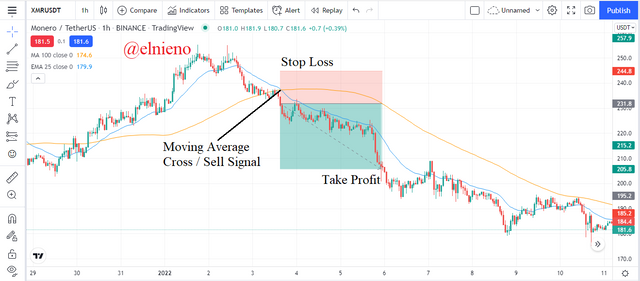
Based on the chart above, the XMR/USDT market is showing a downtrend and falling price movements. I analyze the EMA line acting as a fast moving indicator cross the SMA line acting as a slow moving indicator. The EMA line is below the SMA line indicating a cross where this is the beginning of a trend reversal from uptrend to downtrend. Here I can place a sell entry after the breakout candle on the chart and set the stop loss level above the SMA line and the take profit level with a ratio of 1:2.
In this case, crossover analysis on the Moving Average indicator is a good trading strategy to determine trend reversals before executing trades. This will help traders to place entry positions at the beginning of the trend so that traders can maximize profits and minimize losses. This Moving Average cross can only be relied on when the market is in an uptrend or downtrend but not in a sideway trend. Every trader is free to configure the EMA and SMA periods according to their respective trading strategies.
Explain The Limitations of Moving Average
The presence of various types of technical indicators in the world of cryptocurrencies proves that a lot of knowledge and experience is applied in executing trades. This shows the benefits and use of this indicator is very important for all cryptocurrency market participants. Moving Average as a technical indicator also has limitations that cannot be avoided. This shows that each indicator has weaknesses and is not 100% perfect. Sometimes Moving Averages give false signals or errors that can be understood and analyzed properly as follows:
Moving Average has important points that are very influential where the analysis of the period in a certain period of time is the main thing. If the period configuration is wrong and does not match the trading strategy, it will give false signals and trade execution does not go well.
Moving Average has a mathematical calculation that relies on price data according to the configured period. This makes price data does not include the period and other factors not be included in the calculation of indicators.
Moving Averages have new price data calculations based on price movements and candles that form over time. Every price data is constantly updated and revised so this indicator is considered too late in giving a trend reversal signal.
Moving Averages can be relied on by traders in analyzing price movements when the market is in an uptrend or downtrend and does not match the sideway trend.
Moving Averages must be understood and configured properly and carefully because this indicator does not have mandatory guidelines in using indicators so that every trader must have sufficient and good knowledge and experience.
Conclusion
Moving Average is a technical indicator that is often used by traders in analyzing the cryptocurrency market. Before executing a trade, several factors need to be analyzed and this indicator is able to provide an indication of the current market trend, possible trend reversal, and buy or sell signals. This indicator has several types such as SMA, EMA and WMA which have different mathematical calculations. The use of these 3 indicators can be used by traders according to their respective trading strategies. The use of the SMA indicates long-term price movements, while the EMA and WMA indicate short-term price movements.
Identification of entry and exit points using Moving Averages can be analyzed by combining SMA with 50 periods and EMA with 25 periods. EMA lines that act as dynamic support provide buy entry signals and vice versa. SMA lines can also be used as an exit point by setting a stop loss level below it and vice versa. Moving Average crossovers give traders an indication that the market is about to experience a trend reversal. The crossing of the EMA line above the SMA line is an indication the market will be an uptrend and signal to place a buy entry and vice versa.