Crypto Trading by Identifying Support and Resistance - Steemit Crypto Academy - S6W3 - Homework Post for @shemul21
.jpg)

1. What is the Support & Resistance zone?
Often we see price reacting from various zones or areas in the market with the price either going downwards after it hit that level after a period of bullish movement in the market or we see price react from zones or areas after a period of bearish momentum and then change direction to start moving up from there. These areas are a big part of trading which are called support and resistance levels. So what are these support and resistance zones and areas I am talking about?
SUPPORT ZONES
Imagine if a boy is inside a bouncing castle and every time the child jumps up and is coming down, we see the child move up again after he hits the floor of the castle. The floor of the castle here is serving both as a blockage preventing the child from going further downwards while also changing the direction the child was heading from downwards to upwards. This is a real-life of what a support zone is in the market.
Support zones are those zones in the market where we see prices react after a period of downtrend and then change direction from downward to upward. These zones are areas where we see buyers troop into the market with their aim be to prevent further downward movement of the market and we describe this zone cause often we see the market not perfectly react from the previous place it reacted but within a very close range of formal reactions and from research we see that it is not just a level lets say at the 50 levels it is reacting from but from an area which we mark as our zone of interest. A good example of a support zone can be seen below:
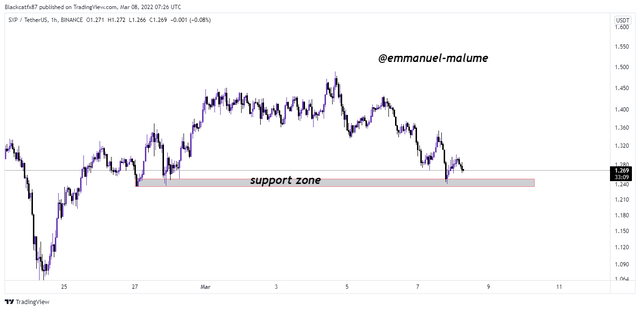
Looking at the SXPUSDT chart above, we saw how price came to this zone which I marked out as support and reacted from it in an upward direction cause in the support we see price reacting from there to move upwards with a lot of buyers now inside the market preventing price from going further downwards
RESISTANCE ZONES
Same with the bouncing castle, remember as the boy is pushed up from the floor of the castle, we see the boy reach a certain high or area before his upward trajectory is stopped entirely, and then he changes from upward to downwards showing that a force which he can't breakthrough 9is restricting him from moving further upwards, this is what we call resistance.
Resistance zones are areas in the market that halt the upward trajectory of market movement changing the direction from an upward movement to a downward direction preventing price from moving further upwards. These areas are marked by the large presence of what we call sellers who form this wall preventing prices from going further upwards rather than putting lots of sell orders which push prices downwards. A good example of a resistance zone can be seen below:
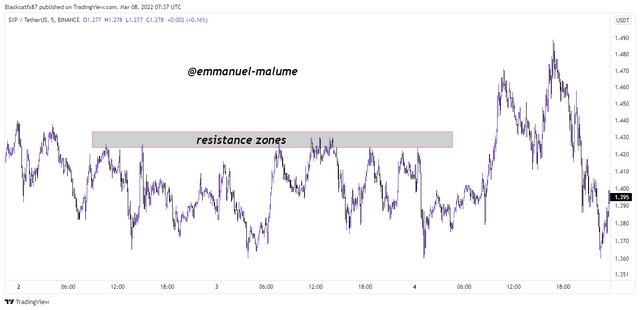
In the SXPUSDT chart above we saw how price reached a certain area in the market and we saw price react to move downwards upon it was moving up previously, this zone it reacted from is what is called a resistance zone where we saw sellers enter the market to move market downward to prevent the price from rising any further
2. Explain different types of Support & resistance with proper demonstration.
There are different types of support and resistance we have and they include:
- Dynamic support and resistance
- Horizontal support and resistance
- Trendlines or sloping support and resistance
DYNAMIC SUPPORT AND RESISTANCE
For something to be dynamic means that it is constantly changing without having a certain area or point. So we have the dynamic support and resistance which are areas price reacts from randomly in the market. Cause we humans cant identify these constantly changing areas of support and resistance, the moving average indicator helps us to solve this issue. The moving average indicator can either be smooth, exponential, or weighted. This dynamic support and resistance are market retracement after a run with it taking a break before continuing in its normal direction so the dynamic resistance and support are where the retracement stops and reverts to its original direction. An example can be seen below:
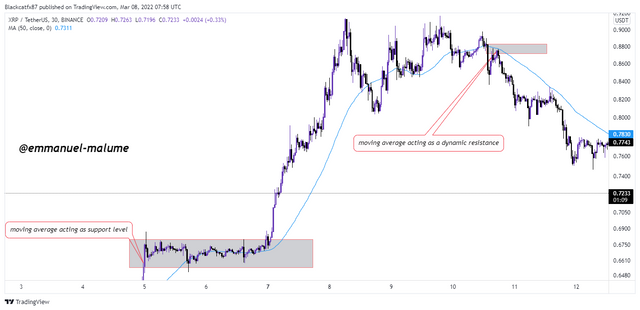
In the XRPUSDT chart above, we saw the moving average indicator acting as both dynamic support and resistance with price reacting from there to go upward and downward respectively
HORIZONTAL SUPPORT AND RESISTANCE
This is the easiest and simplest to identify but most times most traders find it hard to identify. This is also the major support and resistance for pro traders who trade both reactions of it or a breakthrough by price see the support and resistance levels reverse position in the market. So what are this horizontal support and resistance?
They are zones or areas where we see the market react constantly to move either upward for support or downward for resistance. These areas are obvious areas of reactions in the market and when monitored we see that a break or these horizontal zones see the market used the broken zone as either support if the area was resistant or as resistance if the area was supported. It is this change in zones that gives the strategy of trading market retest strategy cause we expect broken support to become resistant and a broke resistance to become a support. An example can be seen below:
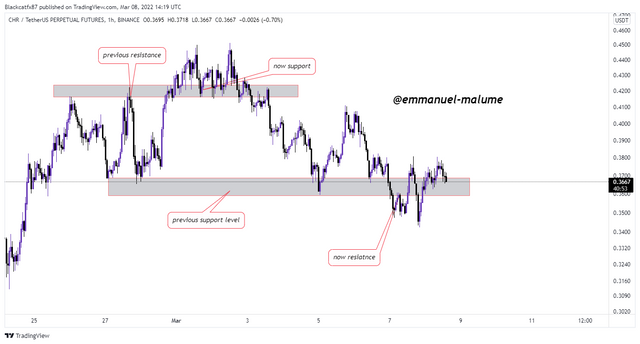
In the CHRUSDT chart above, we saw how price played with these zones with price first breaking through the resistance then it turned support followed by another break, and then it went below to break the support level, and then the support level became a resistance that price would react from to move downwards.
TRENDLINES AND SLOPPY SUPPORT AND RESISTANCE
This type of support and resistance is what gave rise to what is called the trendline trading strategy. This type of support and resistance is marked out using a diagonal line which acts as a support level for price when in an uptrend or as a resistance level for price when in a downtrend where price reacts to move in its proposed direction. This type of support and resistance has two types; uptrend trendline and downtrend trendline. The reason is cause they are applied and drawn differently depending on the type of market. This type of support and resistance is not seen in a ranging market. So any market you cant draw good trendlines most times is a ranging market
UPTREND TRENDLINE
This is drawn when we are in a bullish market where we connect the higher lows in the market. we don't connect the highs in the trendline cause it is the support that is a key cause in an uptrend we will always see the resistance being broken pushing the price up but once the support is broken, we might be seeing a potential change to downtrend. In connecting the lows, it is good to make sure not to draw a trendline that cut through the body of the candle but connect the wicks
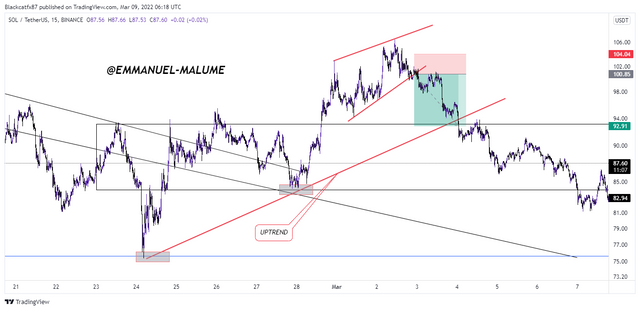
In the SOLUSDT chart above, we saw how I drew the uptrend line showing that the market was very bullish and from my drawing, you can see i9 used the wick to draw my trendlines effectively
DOWNTREND TRENDLINE
This is the sloppy resistance drawn in a bearish market. Here the resistance line is used with lower highs being
connected. The reason for this is due to the fact in a bearish market we expect to see our support levels been constantly broken but the resistance which keeps moving the market down should hold but in a scenario where it gets broken we can look at a possible change in market structure. An example can be seen below:
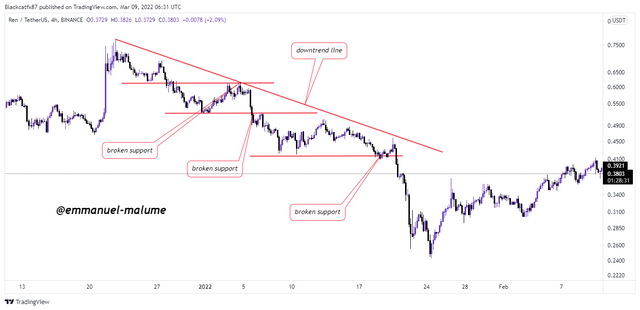
In the RENUSDT chart above, we saw how I drew the trendline connecting the lower highs and also marking out broken support levels which showed that we are in a downtrend
3. Identify The False & Successful Breakouts. (demonstrate with screenshots)
Breakouts in the market are situations where we see price break through support and resistance level to keep moving in a new direction. That means the volume of price was able to overcome these zones. Breakouts are very important things to know in trading cause it helps us to know if the trend is continuing or a change in market direction has occurred or some situation whether it's just a manipulation of the market. This leads to the classification of breakouts into:
- false breakouts
- Confirmed breakouts
FALSE BREAKOUTS
This is a situation where the breakout in the market doesn't hold. In this situation, the strength of the buyers or the sellers who lead to a break of the resistance or support zones respectively was not enough to sustain the breakout leading to the market going back to its original direction. An example can be seen below:'
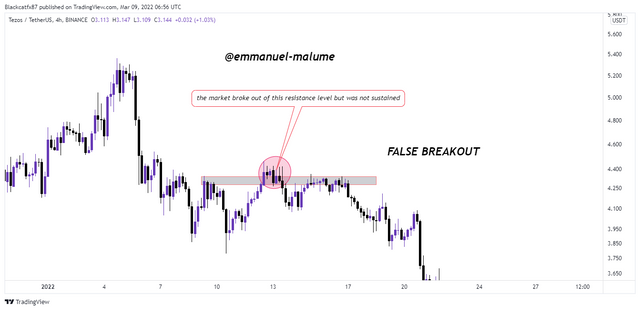
In the XTZUSDT CHART above, we saw the price break through a resistance level but this break didn't hold with the price dropping further downwards. This shows that the strength of the buyers that led to the break is not strong enough to sustain a new trend
CONFIRMATION BREAKOUTS
This is the opposite of the false breakouts with the breakouts that happen here very much sustainable with the market either changing direction or continuing in its original trend
This leads us to the two types of successful breakout namely:
- Continuation breakouts
- Reversal breakouts
CONTINUATION BREAKOUTS
This is seen when identifying market structure in a trending market with resistance constantly being broken in an uptrend while support is been broken in the downtrend. These broken levels help us to know that we are still in the true trend of the market
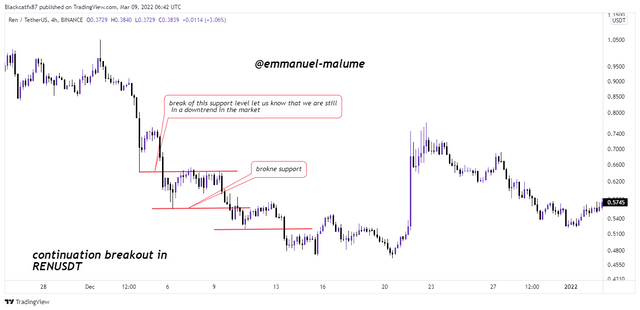
In the RENUSDT chart above, we saw how constant break of support showed continuation of a downtrend in the market and this is what continuation breakouts show us
REVERSAL BREAKOUTS
These are breakouts that lead to a change in market trend with the trend changing from a downtrend to an uptrend or from an uptrend to a downtrend. This occurs when we see the support level in an uptrend been broken or the resistance in a downtrend been broken as seen below:
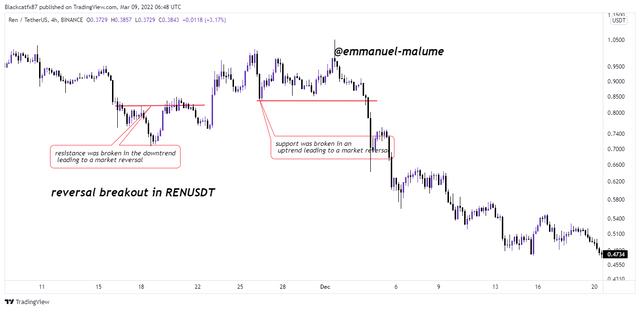
On the right side of this chart, we saw the resistance level been broken to give us a reversal in the market from downtrend to uptrend then on the left side after a period where higher highs were been created we saw the support in the market broken leading to a market reversal from uptrend to downtrend
4.Use Volume and RSI Indicator Combined with Breakouts & Identify the Entry Point. (demonstrate with screenshots).
In trading price breakout, we as retail traders don't know the volume that leads to the breakout and also we need added confirmation cause every technical analyst tool used is very fallible so added confirmation would help a lot and this is where the volume indicator and rsi indicator comes in.
USING VOLUME INDICATOR
we can confirm the strength of breakouts by using the volume indicator which helps one know ow if it is a strong breakout or if it is just a movement by the weak buyers or sellers. When the volume that follows a breakout is strong, it helps us know that a lot of buyers or sellers are really in the market making the breakout a more valid one. An example can be seen below;
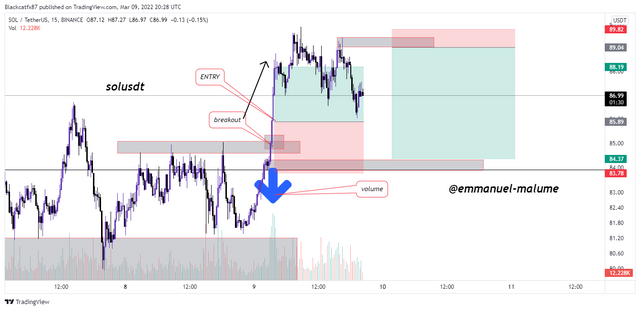
In this SOLUSDT chart above, price did break with sufficient volume with us seeing price keep going from there and if we have taken our entry after confirmation using the volume indicator, it would have been a winning trade. let's look at the opposite scenario below.
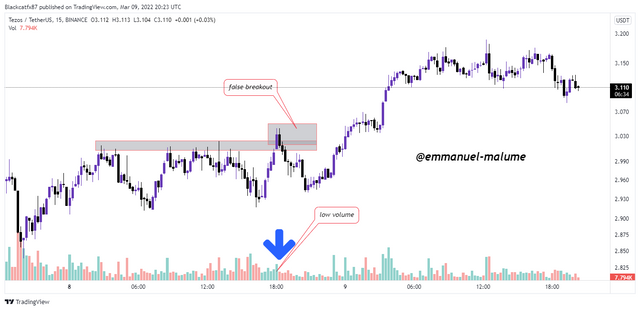
Here a resistance level was broken without volume following it with the breakout ending as a false breakout with the price going back below the resistance
USING RSI INDICATOR
The relative strength indicator here is not used in its natural way as an oscillator with the two usual overbought and oversold levels being removed but rather we add the 50 levels and then we use the position of the line whether it is above the 50 levels or not. If the breakout is in an upward break and we see the position of the rsi lines is above the 50 we can consider taking a long because in this situation the 50 level zone will be acting as our retracement support zone and when we see this we take the long as seen below:
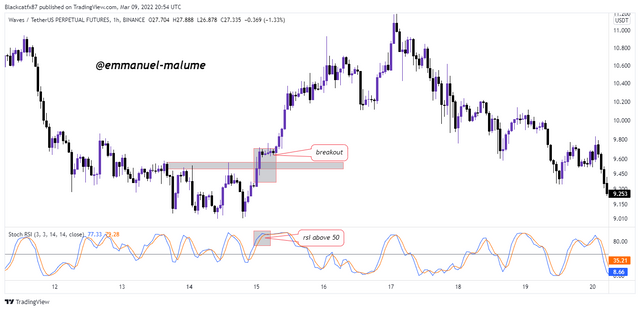
In this chart above, we saw how price broke out, and then it was followed by the rsi line being above the 50 levels and with this, we can confirm our buy bias set our stop loss below broken resistance and our take profits
For shorts, it is the reversal with breakouts of supports needed to be backed by the rsi line being below the 50 level here the 50 levels are acting as a retracement resistance level. So when we see broken support followed by the rsi line being below the 50 line level we can take our shorts with stop loss being above the broken support
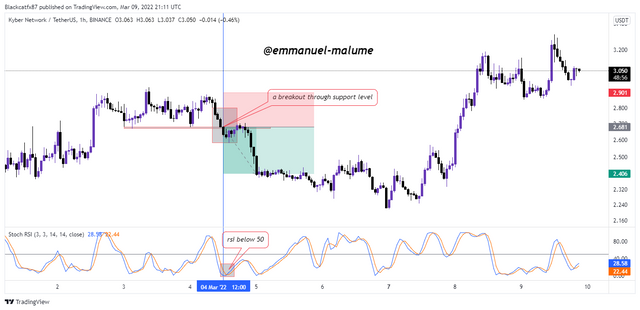
In their KNCUSDT chart below, the price broke through the support level effectively with the rsi being below the 50 levels and we confidently take our short putting stop loss above the broken support level, and then we saw how price moved from with tp been hit
5.Take a Real Trade(crypto pair) on Your Account After a Successful Breakout. (transaction screenshot required).
For this question, I would be taking a trade on DGBUSDTPERP. There was previous support which price broke and we saw a clean retest which I took as an opportunity to take my sell trade
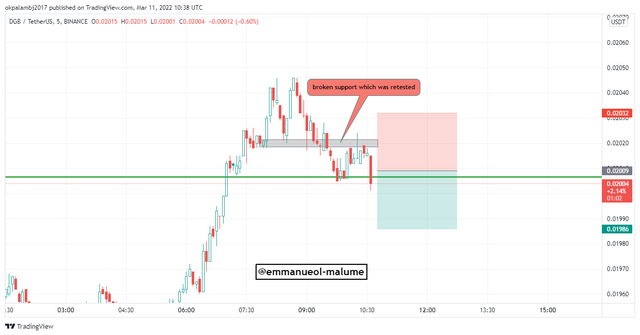
with proper risk management, I put my stop loss above broken support and target a 1:1 risk to reward
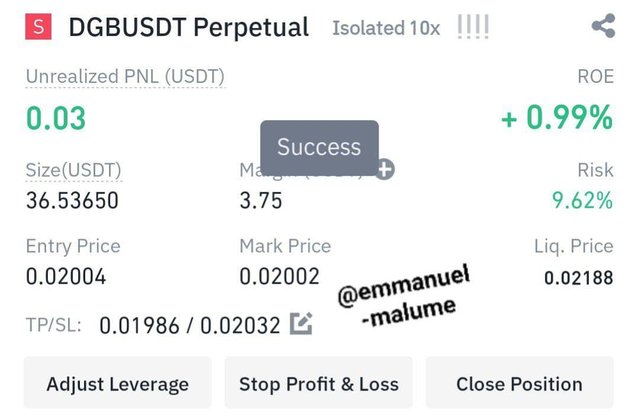
The trade hit take profit

6. Explain the Limitations of Support & Resistance (false breakout).
Support and resistance are very key components of trading and should be known by every trader but the problem that comes up is that no trading technique is 100% perfect if not everyone that trades support and resistance would be rich. So the first limitation is that sometimes this support and resistance don't hold. There are manipulations of these key zones with the price either giving a false breakout which can be taken as manipulations of the market and hit one-stop loss leading to losses.
In some cases, the dynamic support and resistance can be a problem cause without the indicators set at the proper period one may not be able to identify them leading to us seeing the market just ready randomly and move against us immediately

Conclusion
When I started trading, I discovered that support and resistance are the most important and basic parts of trading cause they can be used for taking entries, setting stop losses, knowing market trends and direction. Support and resistance form the basics of most things in trading.
A key part of support and resistance trading is the breakout which our prof taught us today I learned a lot from what was taught and I appreciate that. I hope to implement my new knowledge in my trading life thanks @shemul21