Fibonacci Tools - Steemit Crypto Academy |S6W4| - Homework Post for Professor @pelon53
.png)
Hello crypto enthusiast, meet me again @emmanuel-malume in another week of the crypto academy, today, I will be submitting my homework task to prof @pelon53 on the topic Trading Strategy with Fibonacci Tools. which I will explain the topic as follows;
1.- Explain in your own words what you mean by Fibonacci retracement. Show an example with a screenshot.
2.- Explain in your own words what you mean by the Fibonacci extension. Show an example with a screenshot.
3.- Perform the calculation of the Fibonacci retracement, for the levels of: 0.618 and 0.236. Pick a crypto pair of your choice. Show a screenshot and explain the calculation you made.
4.- On a Live account, trade using the Fibonacci retracement, screenshots are required.
5.- On a Demo account, make a trade operation using the Fibonacci extension. Screenshots are required.

A Fibonacci retracement is a technical tool utilized on the market chart to predict the next market direction, the Crypto movement tends to always repeat itself in the support and resistance, the market movement tends to always range between the support and resistance whereby with the retracement tool, we get to predicts when next or how long the market might retrace before it eventually broke out.
The Fibonacci retracement is drawn between the point 0 and 1, which there are unique numbers where the market is likely to breaks, when the market breaks a new retracement, we get to see the market consolidates in that position first for a while before eventually picking a bigger retracement or a lower level, which the market keeps in the new level till eventually, a new breakout occur.
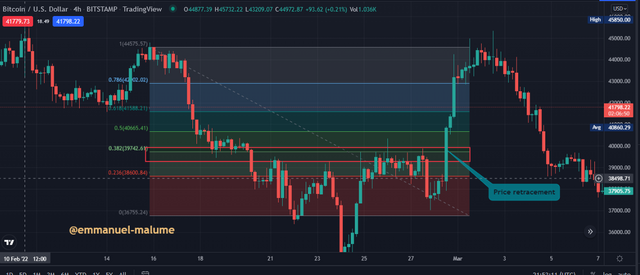
The diagram above is an example of a Fibonacci retracement in a downtrend market, where the line is to be drawn from the higher to the market lowest level, then it could be used as a prediction t the next market direction, and used in identifying the key support and resistance level.
We could see how the market range between 0.38 and 0.236 for a while before it breakout and picks its uptrend movement, we could also see that when the market got to the 1 level of retracement, the market breaks, and moves downtrend afterward.
A Fibonacci extension is also a technical tool made use on the chart, just a little bit different from the retracement has these has the power of projecting or predicting how long it will take a market to continue to be in a position.
The Fibonacci extension can be used to get an early heads up on the market movement, to predicts how long the market might continue moving, this works a similar way as the retracements they both utilized the use of unique level 0 - 1, we then expect a new market movement in case the market breaks the new levels.
To draw an extension on a trend, we mark the trendlines A, B, and C, then we retrace the extension at the beginning of the A trendline to the beginning of the B trendline, we retrace from B to the C level and expand that to the level at which we predicted the market to get to before retracement.
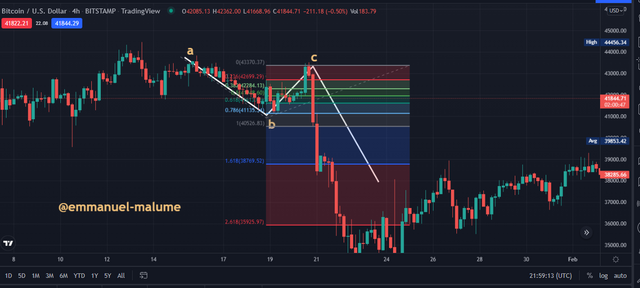
The diagram above explains how I have drawn the Fibonacci extension as we could see the market to have broken past the extension level, and as well the market tends to want to retrace at level 1 a little bit, but at the end, it eventually depicts a lower trend till it got to the 2 levels.
To calculate 0.236 retracement price level
We utilized the formula ;
R1 = X + [(1 - % Retrace1 / 100) * (Y-X)]
Where,
X = represents the price the Fibonacci retracement tool begins.
Y = represents the price before pullback begins.
Y = 36755.24USD , X = 44575.57USD
R1 = 44575.57USD+ [(1 - 0.236) * ( 36755.24 - 44575.57USD)]
R1 = 44575.57USD + [(0.764) * ( - 7820.33)]
R1 = 44575.57USD - [5974.73]
R1 = 38601.27USD
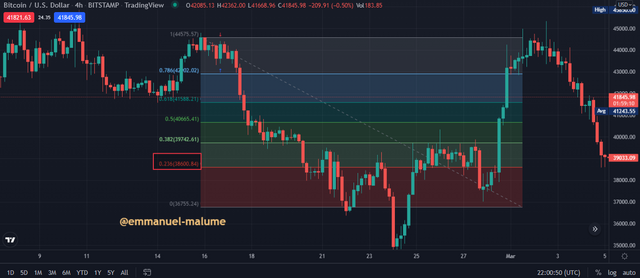
The Price confirmation can be confirmed from the Picture above as well.
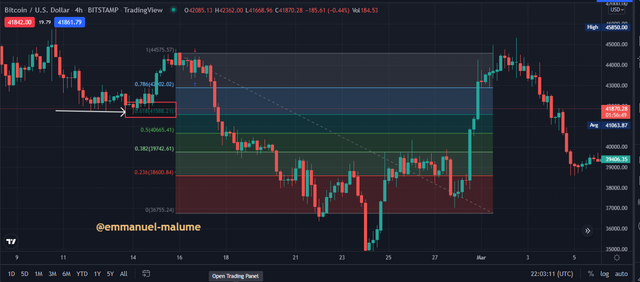
To calculate 0.618 retracement price level
We utilized the formula ;
R4 = X + [(1 - % Retrace4 / 100) * (Y-X)]
Where,
X = represents the price the Fibonacci retracement tool begins.
Y = represents the price before pullback begins.
Y = 36755.24USD , X = 44575.57USD
R4 = 44575.57USD+ [(1 - 0.618) * ( 36755.24 - 44575.57USD)]
R4 = 44575.57USD + [(0.382) * ( - 7820.33)]
R4 = 44575.57USD - [2987.37]
R4 = 41588.20USD
Using the tradingview to analyze the Fibonacci retracement on the market of RUNEUSDT, I noticed the trend was traveling in an uptrend, I draw the retracement tool from the low part of the market to the current high.
I noticed the market has been breaking the Fibonacci level severally and it is about to break a new resistance level to the top at level 0.236, then I put in my entry with my risk ratio in 1:1.
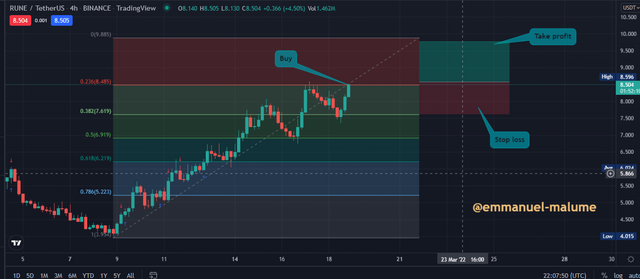
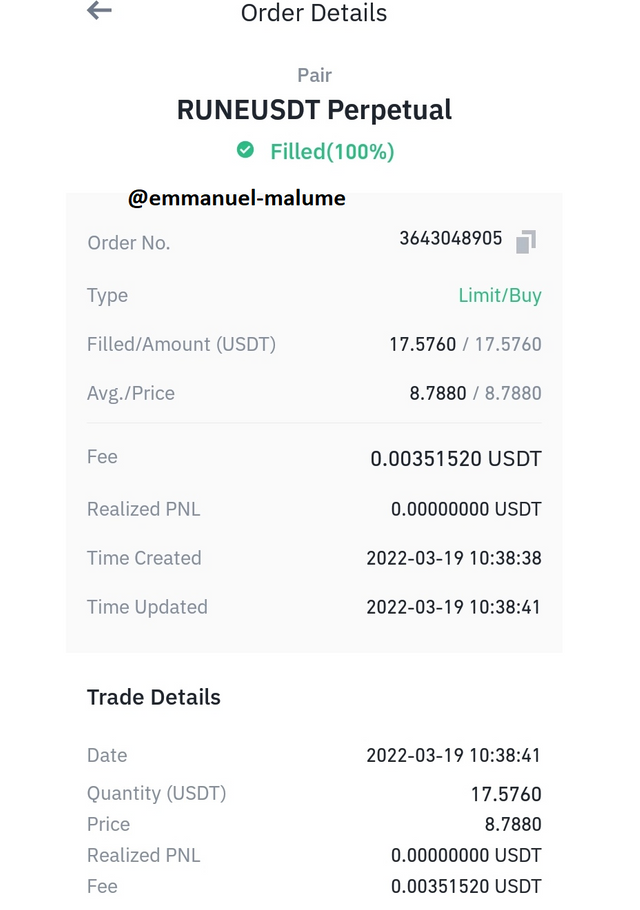
I Log in to my verified exchange to buy the RUNE coin after I have verified the market level and expect more uptrend. my stop loss below my entry and the Target level In 1:1
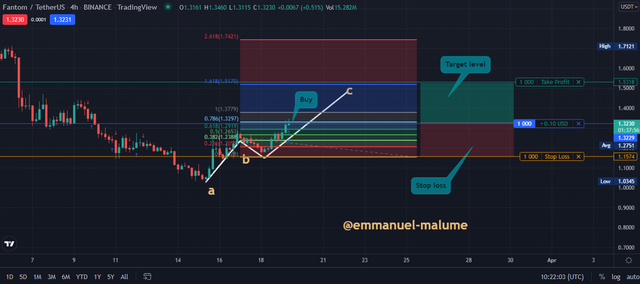
Using the Paper Trading broker, I will be trading the FTMUSD market with the use of the Fibonacci extension tool, First thing first I marked the trendline a, b and C.
I got to see that the market has been traveling uptrend, then I retrace the extension to know how long the market will be in an uptrend.
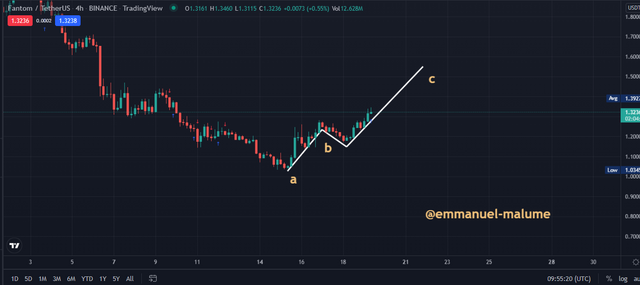
I drew the extension line from point a to b, then I expanded it to C which is my market prediction level, after getting that, I execute my buy trade with the stop loss below the tool and my target level at the 1 level retracement.
Proof of my running trade from paper trading with a profit level of +1.90USD.


First of all, I want to thank professor @pelon53 for picking such a wonderful course to teach in the academy, especially since the Fibonacci tool strategy is one of the best trading strategies out there and one that will greatly improve one's trading system and when practiced well and combined with good tools too can give one a very advantageous trading system.
We should also have in mind that we can not base real investment trading decisions on the Fibonacci tool if we are not too familiar with it as the tools can be a little bit tricky for beginners.