7/9 BTC Daily Report
Today, Bitcoin plummeted sharply following the release of data, mirroring the movement of the US stock market. What should we expect next? Will it really drop below $50,000 this week? Additionally, we will discuss whether this bull market still has an altcoin season. Are we really going to be left holding worthless altcoins?
Let’s first examine the current situation. On the weekly chart, we can see that last week’s candle completely engulfed the previous bullish candle, followed by a rebound after the close. The price, after encountering multiple resistances, has once again dipped. It has now reached the crucial support range of $51,000 to $52,000 on the weekly chart.

In my view, after last week’s close, we need to be cautious this week around the key resistance level of $59,500. If it gets rejected here, we might see another dip with a long upper shadow. Next, we should focus on the support range of $51,294 to $52,858 for potential spot buying opportunities. Currently, if the price enters this range, we can add a spot position at the upper edge of $52,858. The strategy is to split the position into two parts: one at $52,858 and the other at $51,294. If the price reaches these levels, I will add to my position.

At this point, we should primarily observe the support situation in this crucial weekly support range. If it holds, I believe there is a chance for a rebound next week. On the 11th, which is next Wednesday, the CPI data will be released, which will be an important indicator before the FOMC meeting on the 18th, where a rate cut might be announced.
Looking at the daily chart, after the non-farm payroll and unemployment rate data were released yesterday, Bitcoin plummeted along with the US stock market. The price closed near the lower edge of the $54,000 to $55,000 range. Within this range, I am particularly concerned about the low point at $54,500. If there is a false break and recovery, we can attempt a short-term long position. However, the current situation is that it broke down sharply, not meeting our entry conditions.

Yesterday, I shared that after the initial drop, the price continued to decline steadily. On the 4-hour chart, we see a downtrend with lower highs and lower lows. If a reversal is to occur, it might need to dip further before reversing. In the short term, if a reversal is to happen, we need to see the price touch the parallel low of $55,500, followed by a pullback and then a higher high above $57,000. Otherwise, I do not see any strong signals of a rebound after this drop.

Next, let’s look at the latest on-chain data. It shows that for the past four days, retail investors have been buying while large whales have been selling. This extreme market sentiment is a risk worth noting. I hope these different perspectives are helpful to you.

Now, let’s look at the latest spot ETF data. Today, there was an outflow of 170M, over 3,000 Bitcoins. Except for Monday when the US stock market was closed, there have been continuous outflows for four days this week. This high level of outflow is not a positive signal.

Moving on to today’s main topic, many are concerned about whether there will be an altcoin season during this continuous two-week decline. Are we really going to be left holding worthless altcoins?
Let’s look at this chart. The top shows Bitcoin’s price, and the bottom shows Bitcoin’s dominance in total market capitalization. In the 2017 bull market peak and 2021, there was a significant drop in Bitcoin’s dominance due to the rotation of funds by large whales. Simply put, when the bull market reaches their target, they do not sell all their Bitcoin but use it to pump altcoins they have already positioned in. After pumping and selling, they might convert some profits to fiat and keep the rest in the bear market to accumulate for the next cycle.

This is why USDT’s total market capitalization drops significantly at the end of a bull market, after the altcoin season ends. We saw this at the end of the 2022 bull market and the 2017 bull market. USDT’s market cap rises or falls because people mint USDT with fiat or redeem fiat with USDT.


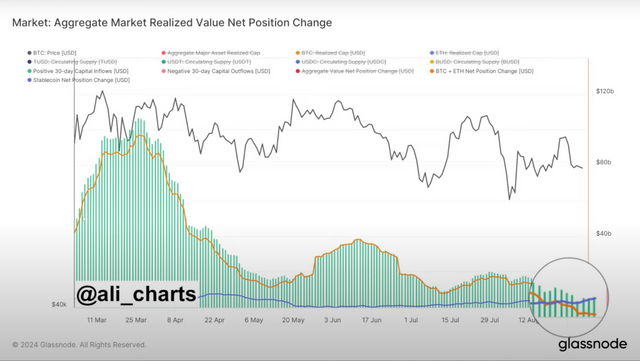
Let’s see the current situation. This chart shows USDT’s market cap growth over 30 days. As long as it is above zero, USDT’s market cap is growing. After the recent drop, USDT’s market cap has been growing, and the growth rate is increasing.

This chart also shows that funds flowing into stablecoins are higher than those flowing directly into Bitcoin. So, people are minting USDT with fiat, but not immediately buying Bitcoin. This can be seen as unallocated funds, possibly large whales preparing for entry.

If the bull market is over, why are these funds still flowing in? Or, if $74,000 is the peak of this bull market, the past six months would be the best time for whales to pump altcoins before entering a bear market. But we haven’t seen this happening; funds are still flowing in.
This concludes today’s sharing. I hope it is helpful to you. What do you think? Do you believe the main players have changed, and Wall Street’s involvement means they won’t pump strange altcoins? Or is the altcoin season yet to come because Bitcoin hasn’t finished rising? Feel free to share your thoughts in the comments below.