Japanese Candlestick Patterns -Steemit Crypto Academy Season -Homework Post for Task 10
Greetings everyone, I am delighted to share with everyone in this great community yet another crypto homework post. I hope to therefore put put my best from this task. This homework task is focused towards the Japanese Candlestick chart. I am therefore very grateful to our noble professor in the person of reminiscence for putting up such a wonderful lesson.
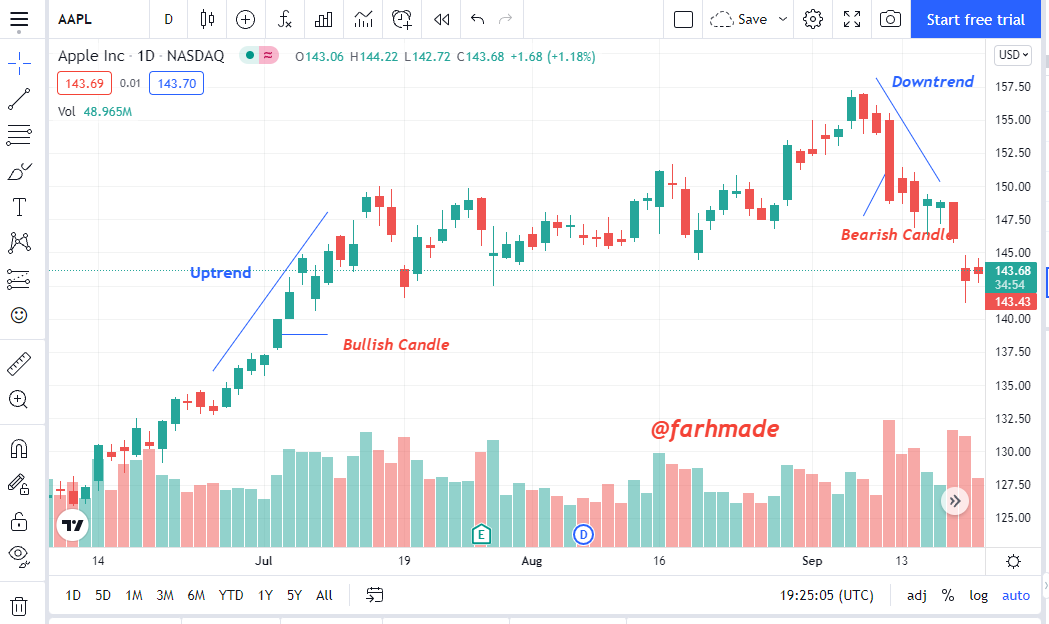
1a) Explain the Japanese candlestick chart? (Original screenshot required).
Japanese candlestick chart is the representation of the price of various crypto assets in the crypto ecosystem. They were brought to the limelight by one Mr. Muneshisa Homma in the late days. This crypto analyst of technician was into the buying and selling of rice at that time. In order to help him overcome the issues of change in the price of the Rice he implemented the Japanese Sticks to understand the movement. It has ever since been in the crypto ecosystem till now. That is, the price of cryptocurrencies are been represented graphically in the crypto market. They appear in the forms of candles which are known to the Japanese type of Candles. The candles are made up of sellers and buyers demanding and suppling of a crypto asset. They are then presented in the graph chart within a time period.
The Japanese Candlestick is made up of various parts which are, Opening Price, Closing Price, Maximum and Minimum Price as well as Body and Shadow.
The Japanese Candlesticks is a easy to use asset as it is very simple to analyze and understand. From the Japanese candlesticks, one can be able to know the price state of a crypto asset and the demand or supply of it.
b) In your own words, explain why the Japanese Candlestick chart is the most used in the financial market.
The Japanese Candlestick is very useful in the crypto market or financial market as a result of how it appears and makes the analyzing of it very easy. The candlestick makes it very simple for one to know the price trend of an asset. That is, one can be able to determine if there will be a rise or fall in the price of the crypto asset so as to help the trader take a good decision. It also makes it known to we the users if there will a change in the price trend of the asset or it is going to be constant. This techniques all aids we the traders the decision to take with regards to the holding or selling of a crypto assets.
Moving further, the candlestick is made of entities that comes together to form it and all these have meaning in the crypto ecosystem which I will explore later. We have various information which is presented to users on the close, open and the high or low aspects of the crypto asset which is very useful. Not forgetting the fact that the bullish and bearish trend of the market is been able to be determined by the candlestick as they appear in different colors of green and that or red respectively.
c) Describe a bullish and a bearish candle. Also, explain its anatomy. (Original screenshot required)
Bullish Japanese candlestick is a candle stick that is found in the uptrend crypto market. It appears in green or sometimes blue color. The candlestick begins with an aspect which is the low open part, it then goes up to end with a high close part. In a bullish candlestick, we have it to always end with the end been above the open area.
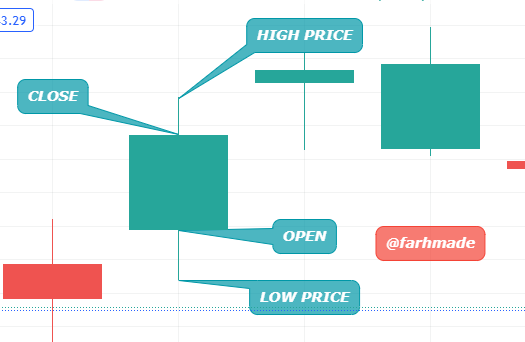
Lets look at the areas or aspects of the Bullish Candle Stick
Open area or part is the beginning part of the Japanese candlestick and always found at the lower side of it. This presents the opening price of the crypto asset from. This aspect is found below as I said in the bullish candle.
The Close aspect of the Bullish candle is the closing price of the crypto asset and it found at the top side of the candle. That is, it is the highest aspect of the Japanese candle.
Low price is the low aspect of the candle price. This shows the lowest point of the price of the crypto asset. This aspect is of it's own of the price trend of the candlestick. This is the lowest point in which the price of the crypto asset has reached in a period of time.
High price is the top aspect of the candle price. This shows the highest price of the crypto asset. This part of it it's independent or of it's own of the price trend of the candlestick. This is also the highest point in which the price of the crypto asset has reached in a period of time.
Bearish Japanese candlesticks are the candlesticks that are the downtrend of the crypto market. With this candlesticks, they have their open aspect been at the top of the close aspect. That is, the open is at the high level then the close aspect is at the low level. They appear in red color notifying traders of a downtrend movement of the price of a crypto asset. As we know red is for danger when we see the candle to be red we know there is a fall in price. SO therefore traders will know what decision to take with regards to investments..
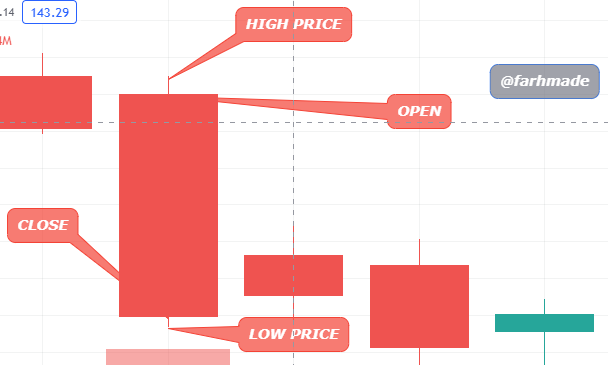
The Open price is the beginning of a bearish candlestick in the crypto market. It is found at the top of the candle and it is opening price of it.
The Close price on the other hand is the ending or the concluding aspect of a bearish candlestick. This is found at the bottom aspect of the candlestick. This is the closing price of the candlestick.
The low price is the lowest price or aspect of the candlestick. This is the low price the crypto asset reached with a period of time. This aspect of it's own of the candlestick.
The high price of the candlestick is the highest price a crypto asset reached within a time period and it at the high aspect of the candlestick. This aspect is of it's own of the candlestick
In a nut shell, the Japanese candlestick is of great improvement in the crypto market since it has brought great benefits to traders like us. It is able to tell us the trend of the price of the crypto asset so as to help us take goo decisions. It also presents to traders the entry points as to when we should enter the market of a particular asset so as to make profit rather then loss.
I am therefore grateful to professor @reminiscence01 for this great lesson as it has broaden our knowledge in the crypto world.
Thank you.