{Steemit Crypto Academy - Season 2, Week 6} Elliott Wave Theory - Teoría de las Ondas de Elliott

CryptoAcademy Season 2 - Week 6
Elliott Wave Theory
Main guidelines for this lecture:
- Elliott Waves: Theory, psychology of the masses
- Patterns: Impulse and Corrective waves
- Application of this theory

Elliott Wave Theory
The Elliott Wave Theory (EWT, from now and on in this lecture) is a principle that's based on the idea that the market follows certain pattern that allow us to predict the price of any asset. By stating this, we also understand that there's certain psychological compound to the natural flow of the market, which can be bearish or bullish. It'll be bearish when prices follow a downtrend and it'll be bearish when the prices are uptrend continuosly.
This principle was created by Ralph Nelson Elliott, who had studied the market data deep enough to create this theory in which trends can be predicted. He was an Accountant that by the early 1930's started studying 75 years of market data; by the end of 1938 he published a book called "The Wave Principle", in which he detailed the conclusions he had arrived to.
The EWT is one of the mutiple tools that technical analysis has and, as I've stated before, it can help us detect market cycles and trends, which gives us a lot of information before taking a decition. This waves are influenced by what can be called crowd psychology, and that's the idea that mood swings in the investors (and the whole market...) rush from extremelly positive to extremelly negative in short periods of time as well as their confidence in the market.
Patterns
EWT states that there are two types of waves: corrective and impulse. These can be easily identified by analyzing how they move regarding the current market trade: if they go with the trend, we'll be facing an impulsive wave, if not, then there's a corrective wave.
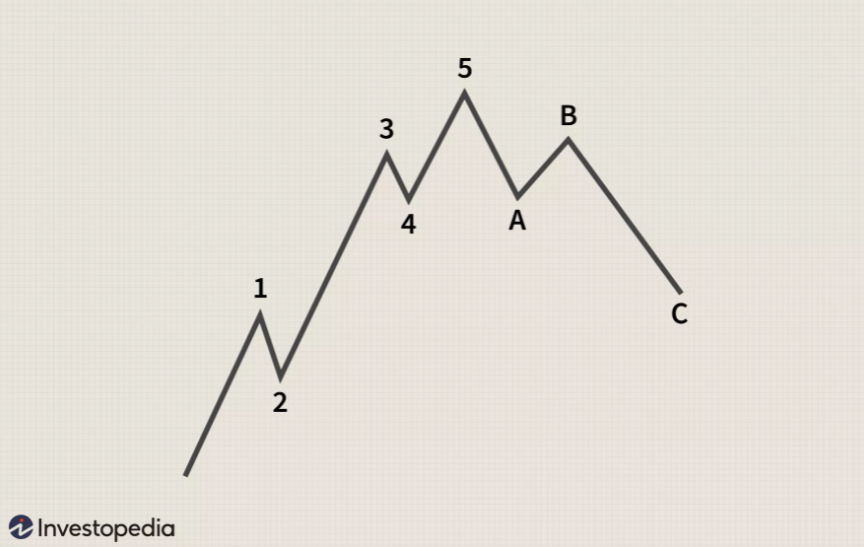
As one of the main concepts of this theory, and regardless of a bearish or bullish market, Elliott found out that the movement pattern can be sum up as 5-3 waves. The first ones (5) tend to be impulse waves, as they go with the market flow, and the last three ones are corrective ones. All this 8 waves together are what Elliott called a market cycle.
They can be identified in the following way:
Bullish trend:
Bearish trend:

Impulse wave
As we've seen before, this type of waves go with the major market's trend. This movements are represented by waves 1 to 5 and show very large price variations.
What we can understand from this different waves is the following:
- Wave 1: This shows the beginning of the cycle, a very small group of people buy the asset in the first stages of the uptrend, which means that they are buying at a low price.
- Wave 2: There's a small regression in the price as some of the investors sold and took profit. This will make the price go slightly below again, but never at the same level of the first wave.
- Wave 3: This will be probably the longest wave as, in this point, the mass will start buying this asset and the price will go up very quickly.
- Wave 4: As seen in wave 2, the price will reverse a little bit, again caused by investors that take profit and sell their position.
- Wave 5: Very small rush in the price caused by bullish traders that will, unfortunatelly, be buying an overpriced coin.
Here's an example that shows it:
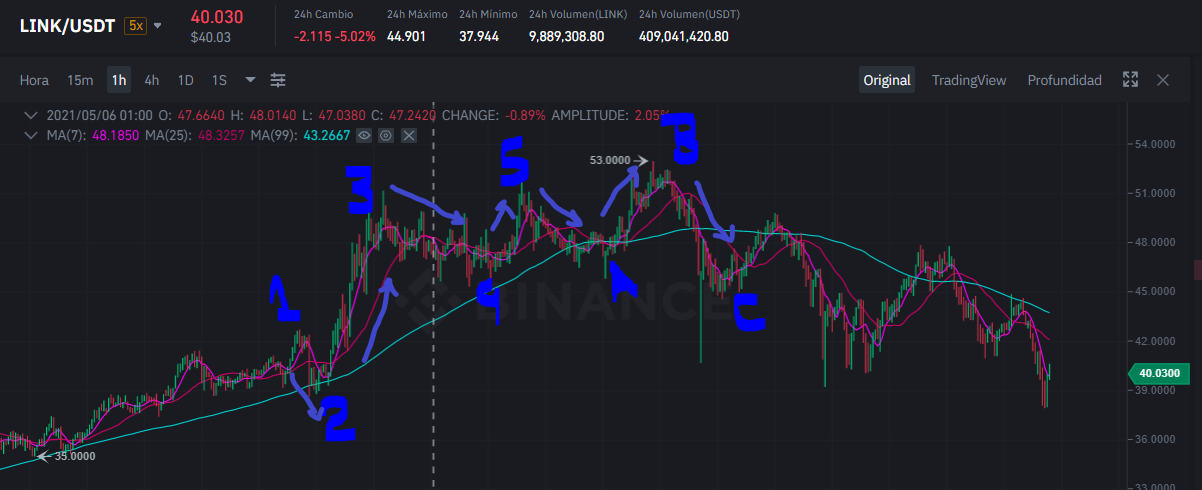
Screen taken from Binance
Note: Waves 2 and 4, despite the fact that they go in the opposite direction of the market trend, you shall not confuse them with corrective waves.
Corrective Waves
As seen in the picture above, this movements are represented by waves A, B and C. They come after the 5 impulse waves and, by definition, they go in the opposite trend. Although it's hard to spot them, we can say that A and C go in the direction of the main corrective trend, while B doesn't.
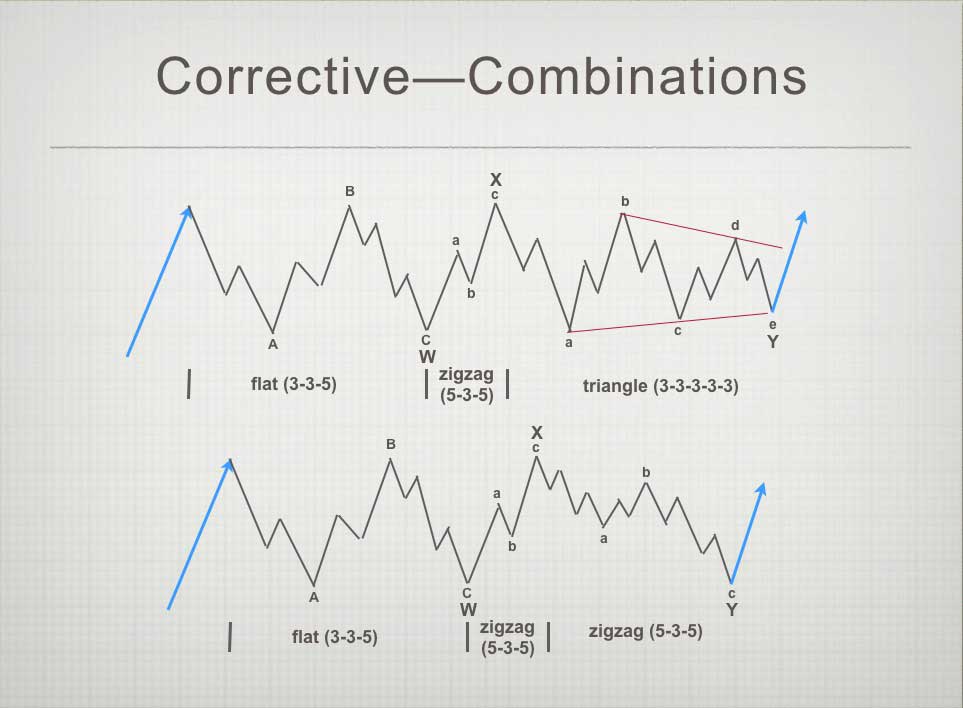
According to the way they develop, these three waves can be group according to the chart formation they create.
- Zigzag: If the waves that we've spotted are shown in a zigzag formation, then we can see that wave B will be shorter than A and C. In wave B we can see that the price goes slightly up, as it's sometimes hard to go against the trend at first.
Flat: There's a connection between the three waves, it's easier to spot and the waves will all have the same length, unlike the zigzag one.
Triangle: This formation is really hard to spot. When given this formation, it means that volatility and volume are decreasing.
These patterns can be seen here:
How to use this theory when trading
By all that has been explained here, we can use this theory in two ways:
At the moment of buying certain asset: by following and identifying the price trend, we can be aware if it's a good moment for us to buy position or not. It's a good tool that we can use to have a bit more control over the price range and what to expect out of the market's movements. As well as this, this can gives us clear information on when to sell our assets and take profits.
Working with a stop-loss: when identifying the waves, we can determine easily where to place our stop loss.
To use this theory correctly, there are a couple of tips that you can bear in mind:
- Wave 2 shouldn't retract more than wage 1 original price.
- Wave 3 has to be the longest of the three impulse waves. If this doesn't happen, you're probably not identifying the waves properly.
- Wave 4 can't reach the same price as the one that was in wave 1.
Homework for this lecture:
A) Share your understanding on this lecture by answering the following questions:
- What's the application of this theory?
- What are impulse and corrective waves? How can you easily spot the different waves?
- What are your thought on this theory? Why?
B) Choose a coinchart in which you were able to spot all impulse and correct waves and explain in detail what you see. Screenshots are required and make sure you name which cryptocurrency you're analyzing.
Guidelines
- Your article should be at least 300 words. Be creative and give us quality content.
- Plagiarism won't be tolerated. Don't rush to submit your task and be very detail oriented.
- Tasks will be accepted till 23.59hs May 22nd 2021 - UTC Time
- Don't forget to include the following tags #fendit-s2week6 and #cryptoacademy among the first five tags you include.
- Leave a link in the comments of your completed task.
- Remember that you won't be eligible for a vote if your reputation's not over 50 and you don't have 100 SP.
{Traducción al español}

CryptoAcademy Season 2 - Week 6
Teoría de las Ondas de Elliott
Puntos a tratar en esta clase:
- Teoría de las Ondas de Elliott : Teoría, psicología de masas
- Patrones: Ondas de impulso y correctivas
- Aplicaciones de esta teoría
Teoría de las Ondas de Elliott
La Teoría de las Ondas de Elliott (TOE, de ahora en más!) es un principio que se basa en la idea de que el mercado sigue cierto patrón que nos permite determinar y predecir el precio de cualquier activo. Al decir esto, también entendemos que hay cierto componente psicológico en el flujo natural del mercado, que puede estar al alza o a la baja.
Este principio fue creado por Ralph Nelson Elliott, quien estudió la información del mercado de 75 años para crear esta teoría de que los precios pueden predecirse. Era un Contador que comenzó a trabajar y analizar tendencias en 1930, para 1938 había publicado su libro "The Wave Principle", en el que hablaba de las conclusiones a las que había llegado tras años de análisis.
La TOE es una de las múltiples herramientas que tiene el análisis técnico y, como dije anteriormente, nos ayuda a poder entender de antemano cómo está funcionando el ciclo de mercado y sus tendencias, lo cual nos brinda un montón de información a la hora de tomar decisiones. Estas ondas son influenciadas por lo que puede ser llamado como "psicología de masas", y es, sencillamente, la idea de que el humor y la confianza que tienen los inversores en el mercado es un factor clave que influye en las variaciones de los precios, así como también puede sufrir subidas o bajas repentinas.
Patrones
La TOE indica que hay dos tipos de ondas: de impulso y correctivas. Estas pueden ser identificadas sencillamente al analizar cómo se mueven respecto a la tendencia general del mercado: si van en el mismo sentido, son ondas de impulso, sino, serán de corrección.
Como uno de los puntos principales de esta teoría, y a pesar de encontrarse en un mercado al alza o a la baja, Elliott llegó a la conclusión que cualquier ciclo de mercado puede determinarse en un patrón de 5-3 ondas. Las primeras (5) suelen ser ondas de impulso, ya que van en el mismo sentido que el mercado y las otras (3) son correctivas. Estas 8 ondas juntas conforman un ciclo de mercado.
Pueden identificarse de la siguiente forma, de acuerdo a cómo esté el ánimo del mercado:
Tendencia al alza:
Tendencia a la baja:
Ondas de impulso
Como hemos visto anteriormente, este tipo de ondas van en el mismo sentido que la tendencia del mercado. Estos movimientos son representados por las ondas 1 a 5 y denotan una variación muy grande en el precio del activo.
Lo que podemos entender de este tipo de ondas es lo siguiente:
- Onda 1: Se nota cómo, en el inicio del ciclo, un grupo muy reducido de inversores compra el activo al comienzo de la tendencia alcista, lo que significa que lo compran a un bajo precio.
- Onda 2: Hay una pequeña regresión en el precio, ya que algunos de los inversores venden su posición para la toma de ganancias. Esto hará que el precio apenas baje, pero nunca al mismo nivel que la onda inicial.
- Onda 3: Esta es la onda más larga de todas, ya que, a este punto, la masa de inversores comenzará a comprar el activo y el precio del mismo subirá rapidamente.
- Onda 4: Como vimos en la onda 2, el precio se retractará un poco, nuevamente causado por inversores que deciden tomar ganancias y vender su posición.
- Onda 5: Última subida de precio, causada por algunos inversores que se perdieron en la euforia y que, por desgracia, habrán comprado el activo a un precio bastante alto.
Aquí hay un ejemplo que lo muestra:
Screen tomado de Binance
Nota: Las ondas 2 y 4, a pesar de que van en dirección opuesta al mercado, no deben ser confundidas con ondas de corrección!!
Ondas Correctivas
Como vimos en la foto más arriba, este movimiento estará representado por las ondas A, B y C. Vienen luego de las 5 ondas de impulso y, por definición, van en dirección opuesta a la tendencia del mercado. Aunque es algo difícil detectarlas, podemos decir que las ondas A y C van en la dirección de la corrección general, mientras que B no.
De acuerdo a cómo se desarrollen, podemos ver que estas tres ondas se pueden agrupar de acuerdo a la formación que tengan:
- Zigzag: Si las ondas tienen una alineación de zigzag, veremos que B es una onda más corta que lo que fueron A y C. En la onda B, podemos ver que el precio ha subido mínimamente, pero sólo porque no tuvo la fuerza suficiente para mantener la corrección.
Flat: Hay una conexión entre las tres ondas, es más sencilla de detectar y las ondas tienen la misma longitud, a diferencia del modo zigzag.
Triangle: Esta formación es realmente difícil de ver, pero cuando se presenta, significa que la volatilidad y el volumen operado se encuentran en un nivel menor que antes.
Estos patrones están ejemplificados aquí:
Cómo aplicar esta teoría al hacer trading
Por todo lo que se expuso en esta clase, podemos utilizar esta teoría de dos formas:
Al momento de comprar posición: Al seguir e identificar los patrones que estuvo siguiendo el precio, podemos ser conscientes si es un buen momento para ingresar o no. Es una gran herramienta que nos da un mayor control sobre el movimiento del mercado y el rango de precios al que nos exponemos. También, nos da información clara acerca de cuándo vender nuestros activos y tomar ganancias.
Aplicar un stop-loss: Cuando identificamos correctamente las ondas, podemos tener seguridad sobre dónde poner nuestro stop loss y operar seguros.
Para utilizar esta teoría correcamente, hay algunos tips que tener en cuenta:
- La onda 2 nunca deberá retractar a un precio menor que la onda 1.
- La onda 3 debe ser la más larga de las ondsa de impulso, si esto no ocurre, puede ser que no estés identificando las ondas de forma correcta.
- La onda 4 nunca puede alcanzar el mismo precio que el que estaba en la onda 1.
Tarea para esta clase:
A) Comparte qué es lo que entendiste de esta teoría respondiendo estas preguntas:
- Cuál es la aplicación de esta teoría?
- Qué son las ondas de impulso y las correctivas? Cómo puedes identificarlas?
- Cuál es tu opinión acerca de esta teoría? Por qué?
B) Elige una moneda y en su gráfico, indica dónde se encuentra el ciclo completo de las ondas de impulso y de corrección. Explica en detalle lo que ves. Debes incluir capturas de pantalla y nombrar qué moneda estás analizando.
Reglas:
- Tu artículo debe contener, como mínimo, 300 palabras. Sé creativo y que tu contenido sea de calidad.
- NO toleraremos plagio. No te apures a publicar tu tarea, oriéntate al detalle.
- Se aceptarán tareas hasta las 23.59hs del 22 de Mayo de 2021. - UTC Time
- Entre las primeras cinco etiquetas, no olvides incluir las siguientes: #fendit-s2week6 y #cryptoacademy
- Deja el link de tu tarea en un comentario en esta publicación!
- Según los criterios determinados por el equipo de Steemit, no recibirás un voto por tu tarea si tu reputación no es superior a 50 y no cuentas con 100 SP.
Cc.
@steemitblog
@steemcurator01
@steemcurator02

Here is my entry dear professor @fendit
https://steemit.com/hive-108451/@vaibhavsan/crypto-academy-week14-homework-post-for-fendit-elliott-wave-theory
Vaya excelente tarea y tema para esta semana, las ondas de Elliot son una muy buena técnica a utilizar en el análisis de los mercados financieros. Daré lo mejor esta semana para participar en esta tarea.
Financial Markets Analyst.
@lenonmc21
Espero ver tu publicación, será un gusto leerte!! :)
Muchas gracias profesora @fendit, el gusto mío por participar en su clase.
Financial Markets Analyst.
@lenonmc21
Very informative and knowledgeable contest I will surely take participate in it. There is lil bit confusion in 1st paragraph you wrote that ("it'll be bearish when the prices are uptrend continuosly.") I think it is bullish trend observe in upward trend? Guide me regarding this @fendit
You explained this elliot wave excellently. It's as if you opened my brain and pour it in. Nice work professor. I enjoyed every bit. Keep it up. ✌👍
Thanks!
Thanks, professor
Here is my entry
https://steemit.com/hive-108451/@ckole/crypto-academy-homework-task-season-2-week-6-post-for-fendit
Hola profesor @fendendit, me encanto su publicación y la forma como fue construyendo el tema, espero unirme a su curso, si es posible. Saludos
Claro, espero verte :)
Está interesante, comenzaré a estudiar para participar esta semana ! saludos ✅
Graicas, espero ver tu trabajo!
Such a nice lecture. Again..
Thank you :)
Your welcome.
"Gracias por participar en The Diary Game en Steem.
Esta publicación ha sido recompensada por @albenis con el apoyo del Proyecto de curación de la comunidad Steem".
Sigue a @steemitblog para obtener las últimas actualizaciones.
El equipo Steemit
Hello friends of @steemitcryptoacademy I write in this post in search of help, a few moments ago I clicked on the option that says: "Create new TRON Account" to generate my PDF of TRX keys. When I download I see that my TRX goes to 0.000 of approximately 400.000 TRX. I don't know where it could have been transferred (if I never hit the transfer button). Additionally, I already downloaded the TRON Link wallet and it is not reflected there either. PLEASE HELP!
Si tienes las claves viejas, puedes recuperar los TRX. Esos están en tu clave privada. Entras a tronscan y colocas tu clave antigua y allí están, luego haces una sincronización con la billetera tron link y listo. Creo que así puedes recuperar tu dinero.
Gracias por responderme, el problema es que nunca se me generó la antigua clave de TRON yo descargaba y descargaba los PDF'S y solo seguian apareciendo las claves de STEEM por eso que trate de generar otro PDF desde TRON nunca pense que me lo llevaría a 0.00
Pero la clave con que hiciste alguna transferencia, es esa. Y esa clave te aparecía en la wallet de Steemit
Hola amiga cambiaste de dirección, tus trx están retenidos solo en esa dirección donde estaban los 400, recuerda que estas constan de una dirección publica y una llave privada, cada dirección y clave es diferente e independiente, tu no realizaste ninguna transferencia solo siguen allí, pero la walletsteem solo te permite controlar una dirección(la ultima creada) por eso te sale en cero porque es una dirección nueva, para controlar tu cuenta donde están los 400 trx debes usar tron link, allí si puedes administrar varias cuentas, los podrás recuperar siempre y cuando tengas la llave privada de la dirección tron, recuerda que estos pdf con dirección y llave solo te los dan una vez, ese momento es cuando creas o generas la cuenta. Espero haberte ayudado.
Si amigo, gracias por tu ayuda 🥰
hola profesor @fendit
Esta conferencia fue de hecho una de las más importantes para mí en el comercio, ya que me enseñó significativamente sobre las olas y cómo usarlas.
Me tomó mucho tiempo hacer esta tarea, pero valió la pena el tiempo y el esfuerzo.
aquí es el enlace a mi tarea
gracias
Checked!
Saludos profesora @fendit, aquí le dejo mi Entrada.
Gracias
Revisado! :)