Steemit Crypto Academy Season 6 Week 2 - Crypto Trading Strategy with Triple Exponential Moving Average (TEMA) Indicator
Introduction
It's with great pleasure that I am writing this piece of the article at this time of the day. Season 6 of the Steemit Crypto Academy has kick-started, running smoothly, and has entered week 2. I'm glad to be returning as one of the crypto professors in the Academy and I will be presenting a lecture on Crypto Trading Strategy with Triple Exponential Moving Average (TEMA) Indicator. Let's get to it!

Designed with Adobe Photoshop

Background to the Study
Understanding Moving Averages would open the floor to the study for today, as such, let's talk about it briefly. Moving averages indicator is one of the important technical tools used in the realm of technical analysis in the crypto ecosystem and other stock markets. Going further, Moving averages indicator is a trend-following indicator, a lagging indicator to be precise (considering past price histories), which is used to identify trends of an asset and as well extract support and resistance on the chart.
A few types of Moving averages are SMA (Simple Moving Average), EMA (Exponential Moving Average), and others, each with its own way of calculation. As highlighted earlier, being a lagging indicator, it considers the previous price histories and is not too effective in predicting the future price of an asset under study. That said, some of the shortcomings of Moving averages led to the innovative development of Triple Exponential Moving Averages (TEMA).

What is Triple Exponential Moving Average (TEMA)?
Triple Exponential Moving Average is developed by Patrick Mulloy, this indicator has been used in other stock markets before it's adopted in the crypto technical analysis realm. TEMA is an innovative development of moving averages in the quest to eliminate the lag or noise associated with other types of MA, in short, it is aimed to smooth price fluctuations in the asset's market for clearer signals.
TEMA comes with improved outputs as it considers three (3) EMAs for the calculation while the lag is subtracted, as such, it gives better indications as compared to other trend-following indicators. Triple Exponential Moving Average helps to identify clearer trends in the market of an asset having smoothened price fluctuations, to identify support and resistance, and so on.
Highlights of Triple Exponential Moving Average (TEMA)
- TEMA is developed to take care of the lag effects associated with the regular moving averages.
- Three EMA is taken into consideration to calculate TEMA while the lag is subtracted.
- It provides clearer identification of trend, supports and resistance, identifies trend changes, and so on.
- Two TEMA at different periods can be utilized to filter buy/sell signals through crossovers.

Formula for Calculating Triple Exponential Moving Average
From the name Triple Exponential Moving Average, it is evident that 3 EMAs are considered for the calculation of TEMA which results in a single trend-following indicator with noises eliminated. Let's see the formula for calculating TEMA below.
Triple Exponential Moving Average results from 3 EMAs, as such;
TEMA = (3.EMA1) - (3.EMA2) + EMA3.
From the expression above, 3 is the coefficient of the EMAs, 1 and 2, as such, a product of 3 and the respective EMAs.
And;
EMA1 = Exponential Moving Average.
EMA2 = EMA of EMA1.
EMA3 = EMA of EMA2.
Note that: All the three EMAs used for the calculation of Triple Exponential Moving Average are at the same periods.

How to Add TEMA on the Chart
TradingView charting platform would be utilized to add TEMA on the chart of an asset. Let's see a few steps and the settings of TEMA.
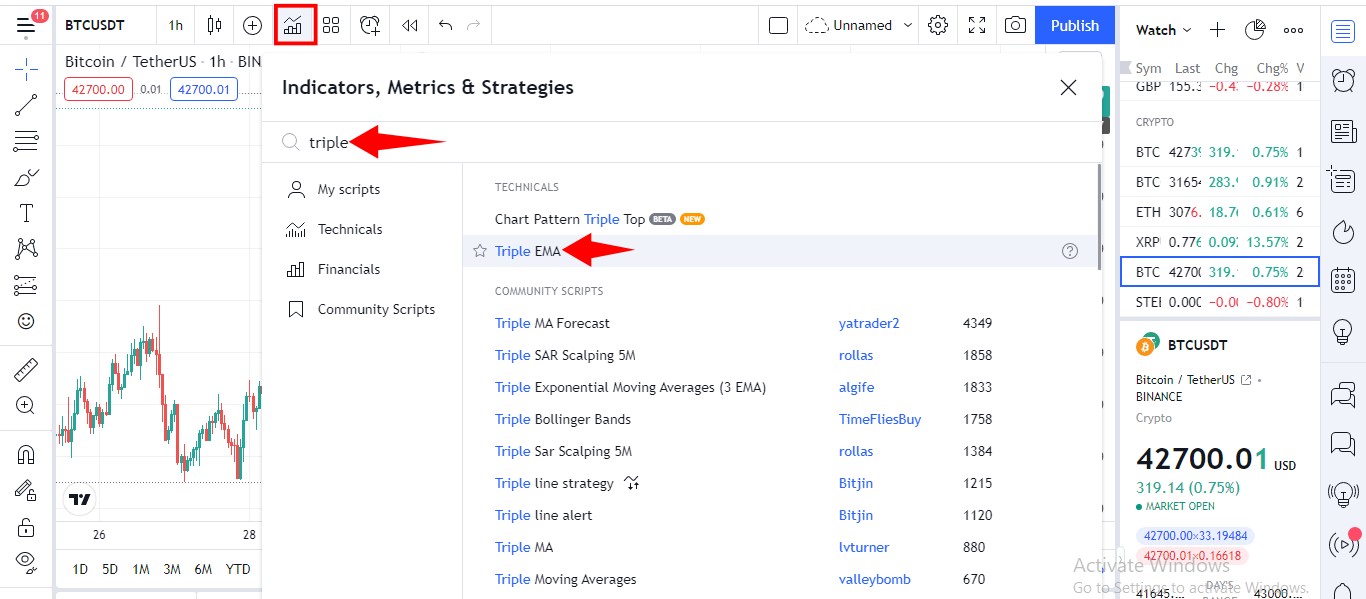
- Visit TradingView, select Indicators at the top of the page.
- On the next interface, search for Triple EMA and select one of the indicators. Let's see the screenshots below.
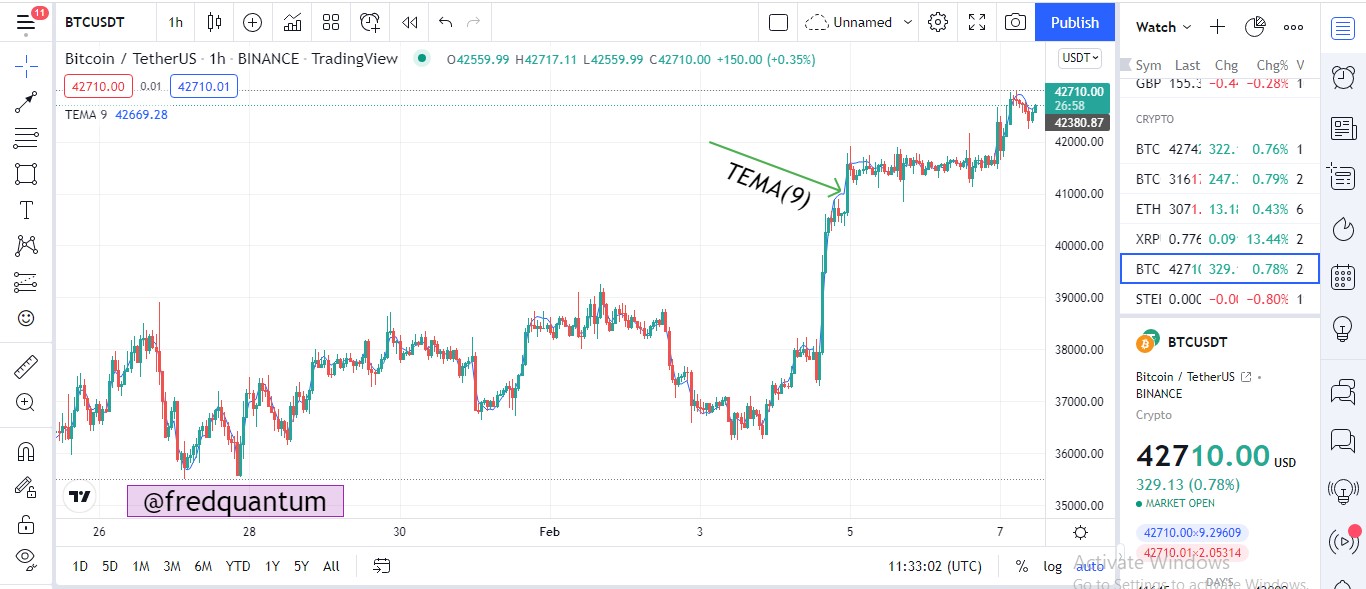
- TEMA is now added to the chart. Select settings and change the period to desired.
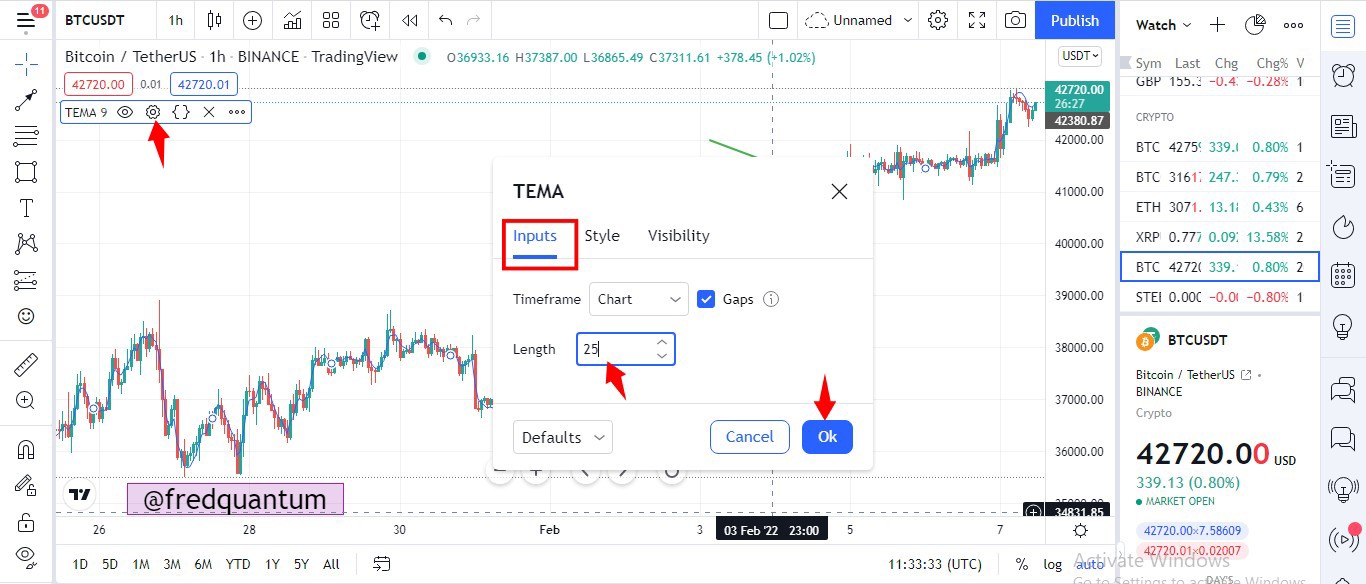
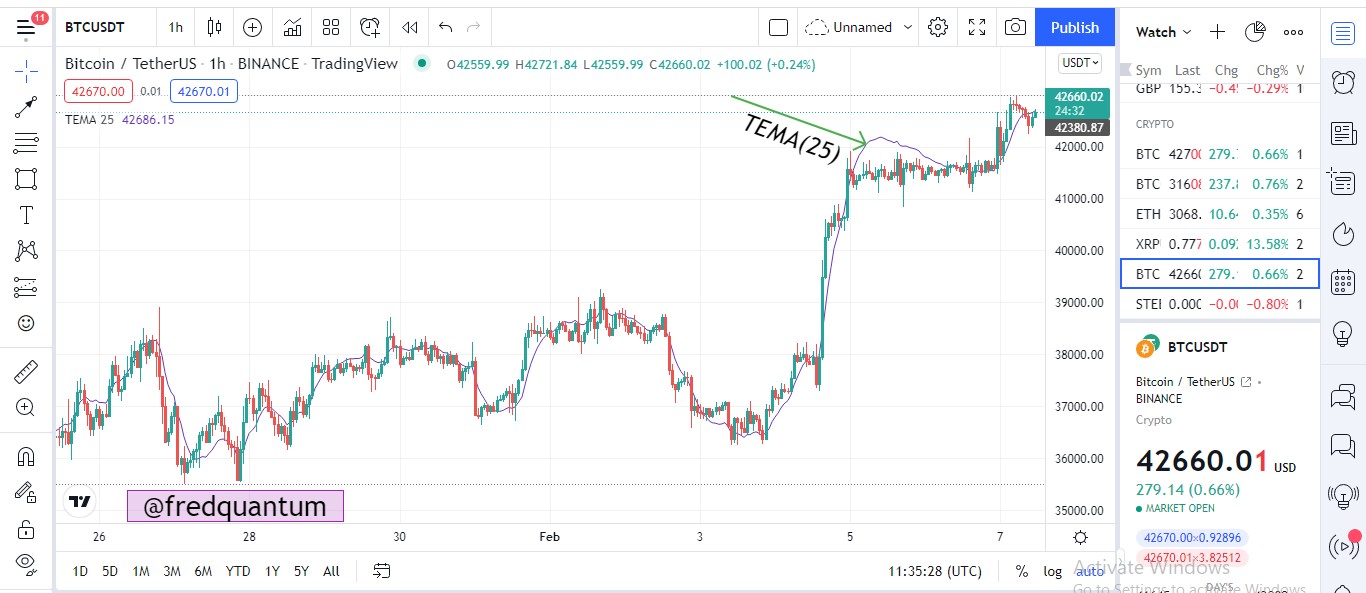
In the settings above, I have changed the period to 25 from the default 9. With 9 periods, for short-term traders, TEMA reacts quickly to price movements which enable such traders to make a swift choice in the market. I have changed to 25 periods, in that way, the movement of TEMA and the price gives clearer indications as compared to the 9 periods without having the indicator totally immersed in the price of the asset, that's how I love it.

Trend Identification/Confirmation with TEMA
TEMA is a trend-following indicator with much clearer trend identification as compared to other trend indicators. For trend identification, the price of the asset and TEMA moves in the same direction, as such, in a bullish market the price and TEMA angles upward while in a bearish market the price and TEMA angles downward. Let's see a few things to look at for trend identification and confirmation with TEMA.
- For a bullish trend, the price and TEMA angles upward, likewise, for a bearish trend, the price and TEMA angles downward.
- For confirmation of a bullish trend, the price of the asset would be trading above TEMA. And for a bearish trend, the price of the asset would be trading below TEMA.
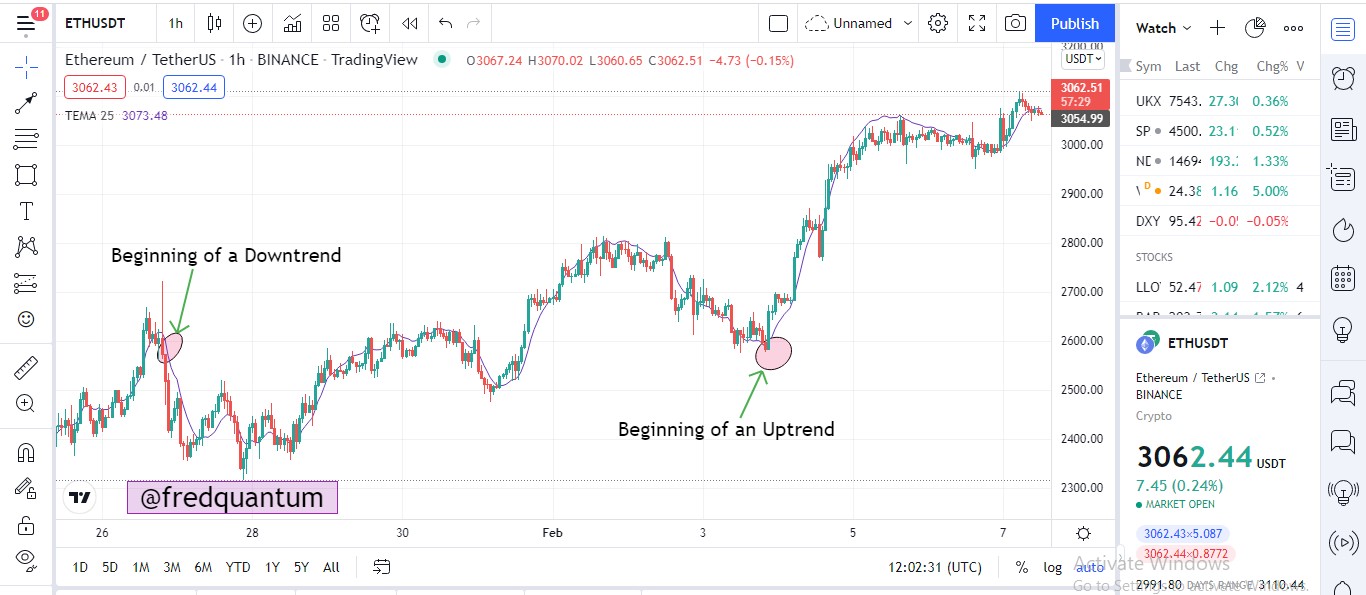
From the ETH/USDT 1 hr timeframe chart above, after a bullish run the asset's price was reversed which begins a downtrend. At that point, the asset was trading below TEMA and the asset moved downtrend. Likewise, in a bearish trend, the price of the asset was reversed as the asset starts trading above TEMA which is a confirmation of an uptrend. This validates the downtrend/uptrend movement when the price of an asset is below/above TEMA.

Support and Resistance with TEMA
The understanding of dynamic support and resistance would enlighten you in this part of the lecture. TEMA serves as a dynamic resistance in a bullish run when the price of the asset gets resisted at the TEMA line and that could be a beginning of a downtrend. In addition, TEMA also serves as a support in a bearish trend, the price is prone to bounce off the TEMA line, as such, that could be a beginning of an uptrend. There are a few uses of TEMA dynamic support and resistance:
- The dynamic support/resistance level can be an indication of a trend reversal.
- It can be utilized to make buy/sell entries as the price of the asset might continue in the new trend for some time. Note that, proper trade management should be applied in such a case.
- The dynamic support/resistance can be utilized for a pullback trading strategy which opens an opportunity for traders to make entries in the former trend.
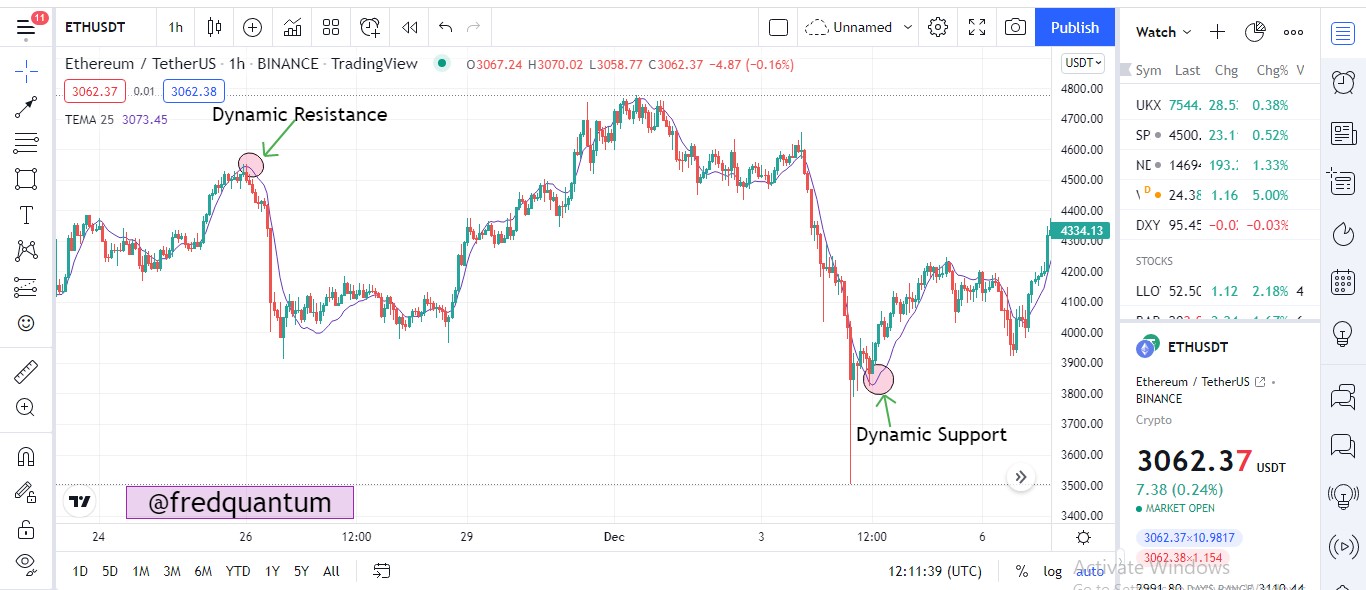
From the chart of ETH/USDT on 1 hr timeframe above, there was a dynamic resistance at the level where the price of the asset touched TEMA and there was a reversal, in the same way, dynamic support was seen at the level when the price of the asset bounces off TEMA and this triggered the price of the asset uptrend.

Trading Strategy with 2 TEMAs Combined
At this section, we would be looking at the trading strategy using two TEMA combined on the chart of an asset, both at a differing period, that is, one at a higher period than the other. As such, the crossing over that exists between the two TEMA would be utilized to make a buy/sell entry in the asset's market, this is not only useful for buy/sell entry but also, confirms that the new trend underway would go far.
If the TEMA with a lower period crosses over the other one with a higher period, this is an indication of a valid uptrend and it opens a buy position for a trader. Conversely, if the TEMA with the higher period crosses over the TEMA with a lower period, it is an indication of a valid downtrend that opens a sell position. The strategy should be utilized with proper trade management. Let's see a few examples below.
_1.png)
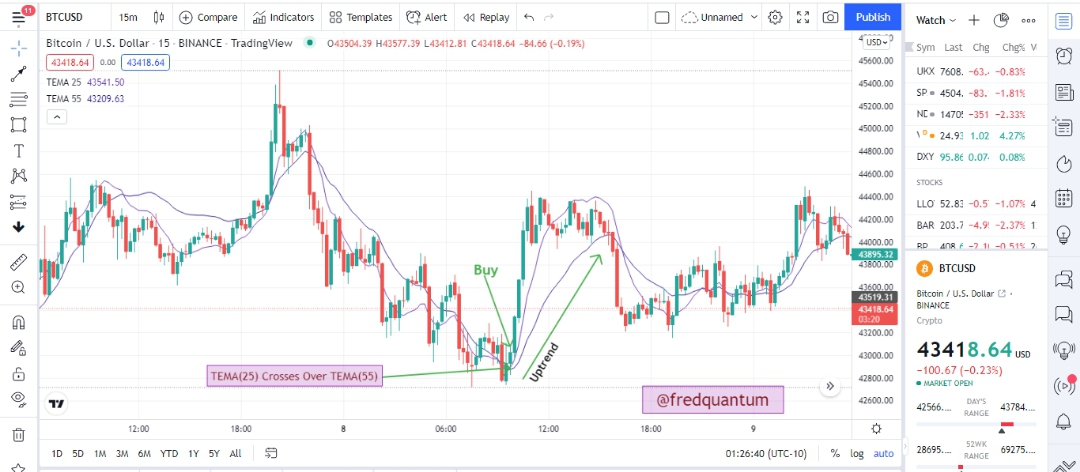
From the ETH/USDT chart above, I have added two TEMA, one at 25 periods and the other one 55 periods. In a downtrend, TEMA at the lower period, 25 crosses over the TEMA with a higher period. This is an indication of a change of trend, the price of the asset moved uptrend and this opened a buy position for trend traders to get involved in the asset's market.
_1.png)
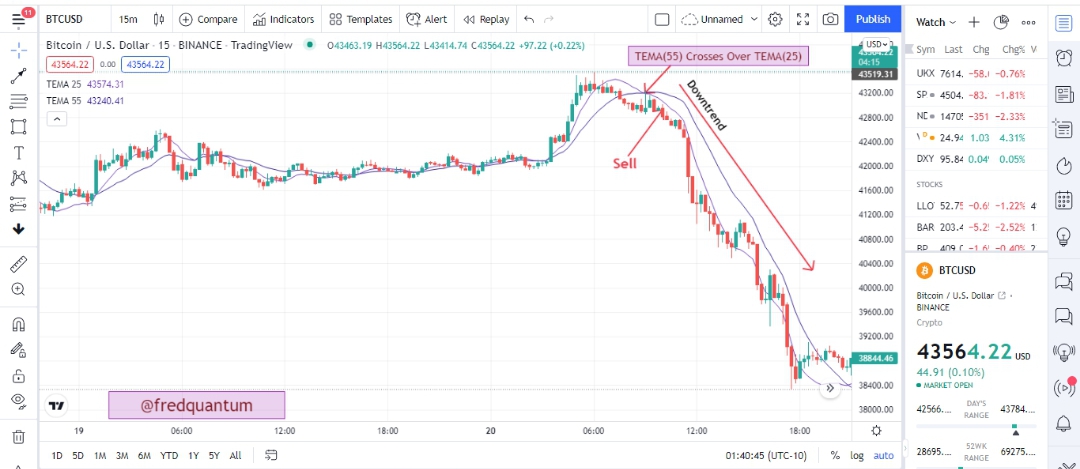
Similarly, from the ETH/USDT chart above, TEMA at 55 period crosses over the lower period TEMA (25). This is an indication of a downtrend and it is evident on the chart that the asset's price moved downtrend which opened a sell position for traders.

Entry/Exit Trade Criteria with TEMA
Trading Strategy with TEMA for proper entry/exit into a crypto market requires certain criteria to be satisfied for successful use of this indicator for trading. In that case, we would be using the strategy of the combination of two TEMAs to confirm valid trend movement to make entries, also utilizing proper trade management. Let's see the criteria below.
Trade Entry/Exit Criteria for a Buy Position using 2 TEMAs
- Add 2 TEMAs on the Chart, at different periods.
- In a downtrend or range market, wait for the lower period TEMA to cross above the higher period TEMA.
- Make a buy entry after at least two candlesticks confirmation (after the crossover).
- For trade exit, set preferred profit taking level. Place your stop loss level below the crossover. A Risk to Reward ratio of 1:1 is recommended. Let's check on the chart below where I utilized 1:2 risk to reward ratio.
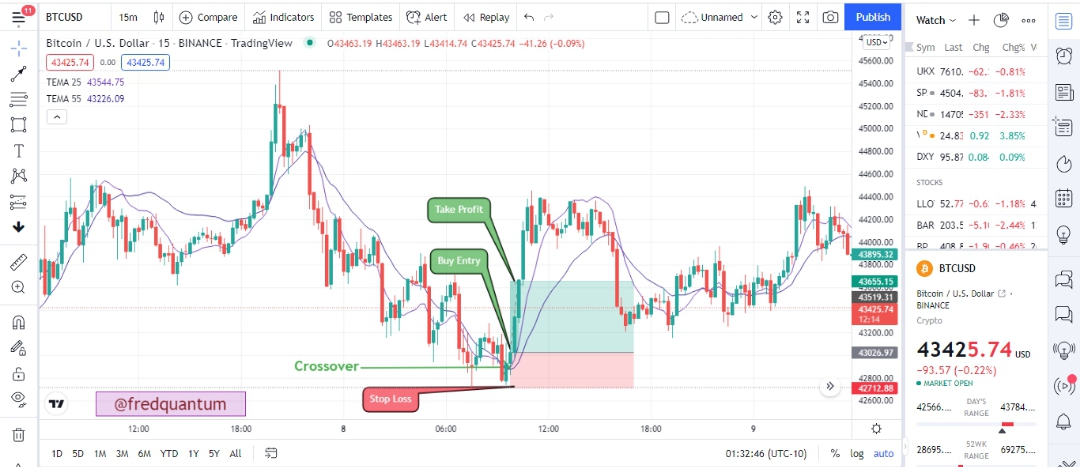_1.png)
Trade Entry/Exit Criteria for a Sell Position using 2 TEMAs
- In the same way, add 2 TEMAs on the Chart, at different periods.
- In an uptrend or range market, wait for the higher period TEMA to cross above the lower period TEMA.
- Make a sell entry after at least two candlesticks confirmation (after the crossover).
- For trade exit, set preferred profit taking level. Place your stop loss level above the crossover. A Risk to Reward ratio of 1:1 is recommended. See the chart below where I also utilized 1:2 risk to reward ratio.
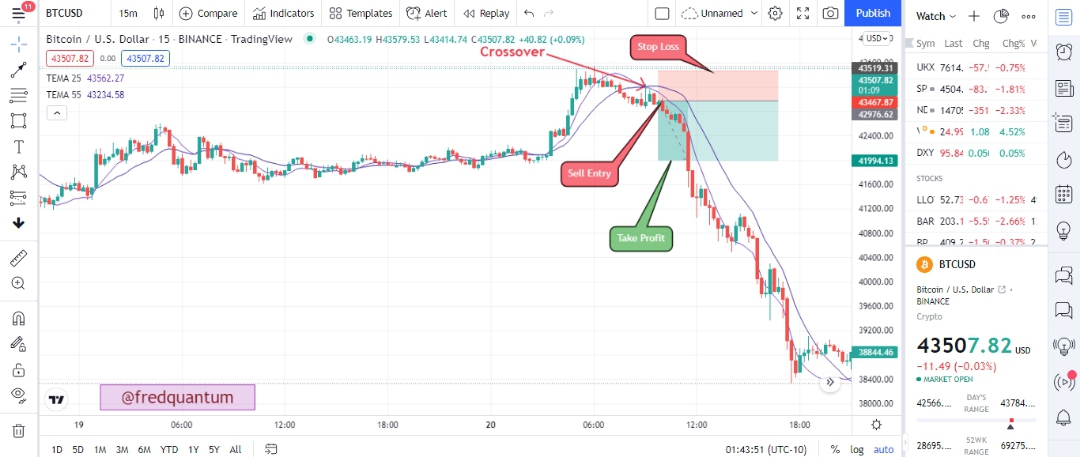_1.png)

The Strategy applied on ETHUSD at 15mins Time frame
TEMA trading strategy should be used on lower time frames for demo or real trade. On the ETH/USD chart at 15mins timeframe, there was an opportunity of a sell position as I realized TEMA (25) crosses over TEMA (55), this is an indication of a good uptrend ahead. I marked out different levels, see them below.
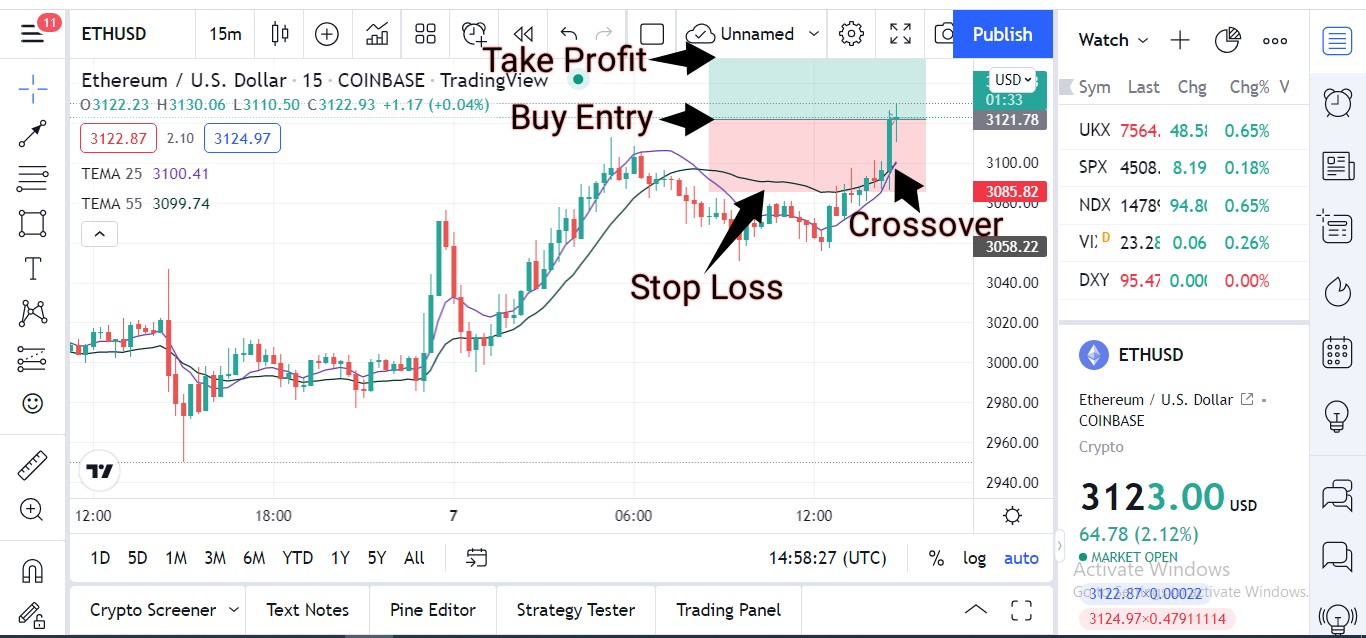
The Chart Analysis
The setup went well as predicted and the trade closed after about 3 hours with a trade exit in profit. The combination of the two TEMAs gives a quick insight of an uptrend ahead as the previous resistance was broken in the new move.
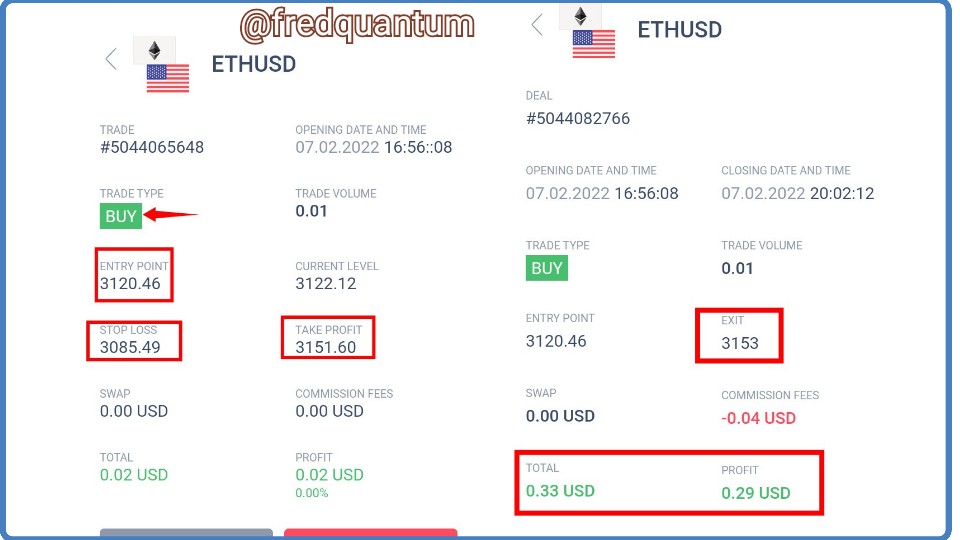
Trade Details- Entry and Exit
I created another setup for sell entry on BTCUSD using TEMA trading strategy which brings profit. See the screenshot of the trade result below.
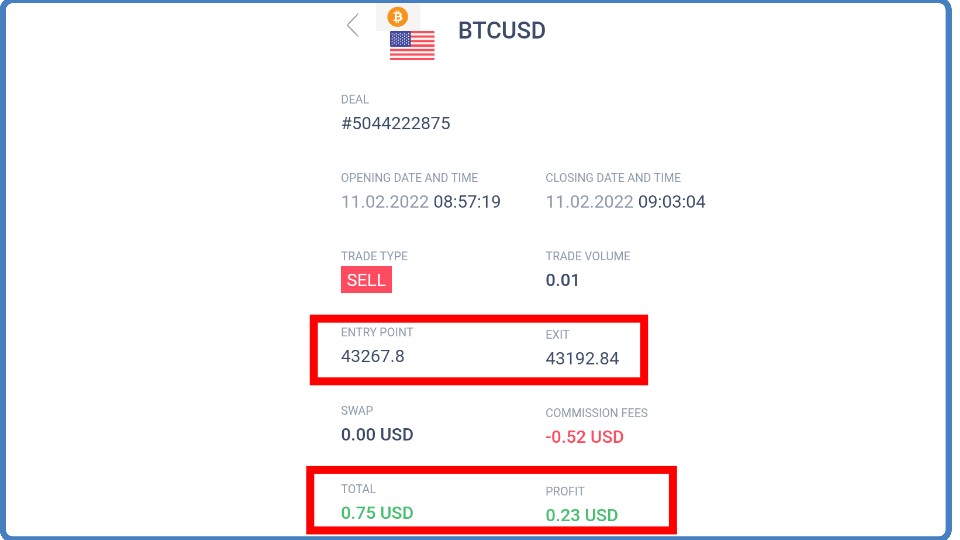
Sell entry trade result

Conclusion
In conclusion, Triple Exponential Moving Average is a great improvement on the Moving averages as it takes care of lag effects associated with them, as such, react quickly to the price behavior of an asset on the chart. TEMA is very effective in identifying trends, supports and resistance, trend change, extra buy/sell signal, and so on.
TEMA strategy discussed in this lecture is a potent trading strategy for Intra-day traders. One notable downside of this indicator is that it's not so suitable for trading in ranging markets as it's fast to react to price behavior and this might result in some false signals. For valid buy/sell positions, a trading strategy with a combination of two TEMAs at different periods, is employed. A trader might also consider applying another indicator to validate crossover actions of TEMAs. Thanks for attending the lecture today and I hope you have learned something. See you around.
Homework Task
- What is your understanding of Triple Exponential Moving Average (TEMA)?
- How is TEMA calculated? Add TEMA to the crypto chart and explain its settings. (Screenshots required).
- Compare TEMA with other Moving Averages. You can use one or two Moving Averages for in-depth comparison with TEMA.
- Explain the Trend Identification/Confirmation in both bearish and bullish trends with TEMA (Use separate charts). Explain Support & Resistance with TEMA (On separate charts). (Screenshots required).
- Explain the combination of two TEMAs at different periods and several signals that can be extracted from it. Note: Use another period combination other than the one used in the lecture, explain your choice of the period. (Screenshots required).
- What are the Trade Entry and Exit criteria using TEMA? Explain with Charts. (Screenshots required).
- Use an indicator of choice in addition with crossovers between two TEMAs to place at least one demo trade and a real margin trade on an exchange (as little as $1 would do). Ideally, buy and sell positions (Apply proper trade management). Use only 5 - 15 mins time frame. (Screenshots required).
- What are the advantages and disadvantages of TEMA?
Rules and Guidelines
- The title of the homework task should be Crypto Trading Strategy with Triple Exponential Moving Average (TEMA) indicator - Crypto Academy / S6W2 - Homework Post for @fredquantum.
- You must be participating in at least #club5050 to benefit from the mark reserved for the initiative's participants. There shouldn't be any power down history within the club status's calculation period. Take note.
- Post your article to the Steemit Crypto Academy.
- The purpose of the homework task is to widen your knowledge about the topic, so ensure you don't limit yourself to the few things taught in this lecture. Do more Research and be Creative.
- Your article must be at least 600 words and make sure your language is clear and straightforward.
- Users that are Powering down are not eligible for participation.
- Be sure that your article is free of Plagiarism, if you have directly copied words from any source, fully reference it.
- Avoid spinning of other users' content, it can disqualify you so make sure you are a unique producer of your homework task. You don't want to risk being sent to the grey list or blacklist, so Beware!
- Add the tag #fredquantum-s6week2 among the first five tags and find a place to tag me @fredquantum so that I can easily find your content. Also, add relative tags like #cryptoacademy, #tema-indicator, #steemexclusive, #crypto, your club status tag, and others.
- Only use copyright-free images and they must be well referenced.
- You must have a reputation of 60 and above to be eligible for participation. Also, you must have at least 250 SP excluding delegated-in SP.
- This task runs till the 19th of February 2022. Time: 11:59 PM UTC. Any homework task submitted later than that would be considered invalid. Thank you.
@tipu curate 2
Upvoted 👌 (Mana: 1/6) Get profit votes with @tipU :)
Nice post @fredquantum
About the question 7, can we use our broker account with meta trader to make the trade? Or strictly Exchange platform ?
Use any platform of choice for the demo trade while you use an exchange for the real trade. Thank you.
Congratulations @fredquantum
This is the most positive post amongst

top 100hot posts on steemit at this moment.Hi. This is my task without the
fredquantum-s6week2 tag because system is now telling me is too long 👀🙆🏻♀️ regards
https://steemit.com/hive-108451/@alegnita/crypto-trading-strategy-with-triple-exponential-moving-average-tema-indicator-crypto-academy-s6w2-homework-post-for-fredquantum
#venezuela #affable
Greetings professor. I'm thinking there's a mixup with the resistance and support using TEMA which you've stated.
Earlier on, you said
So I'm wondering, if in a bullish trend, the price is above the TEMA, how can it be resistance by the TEMA?
And if in a bearish trend the price is below the TEMA, how can it be supported by the TEMA?
I think it's probably the other way round. I'd appreciate clarifications.
Thanks.
For a clear uptrend, the asset would be trading above TEMA, when the market tends to change direction even in a bullish trend, the candlesticks appears below TEMA and find it hard to break above again. Such that a new trend is beginning. Same thing applies to the opposite trend. Thanks. You can check on the chart below to understand it better.
The candlesticks were above TEMA earlier then comes below and was unable to return to trading above the TEMA. As such, TEMA serves as dynamic resistance and support as the price was unable to break through it again in an existing trend. I hope you get it now.
Okay. I get your point. Thanks for the explanation.
Very insightful lesson professor. For question 7 I have a slight issue as you have asked for a margin trade. I have no issues in executing a real trade but can I demonstrate a spot trade instead of a margin trade as there are still some contradictions on margin trading in our belief. I hope you understand.
Looking forward to your response and my submission of this assignment.
Regards.
I don't think there is any issue with margin trading provided you use proper trade management as I have recommended in that question. I made it margin trading so that the amount students would use will be minimal while they also have their positions amplified.
For instance, you can't perform $1 spot trading on Binance, I think you get the point now. Thank you.
Thank you for your reply professor. Yes there's no issue with margin trade if I use proper trade management and infact $1 is a really small amount, which is very considerate of you. But that's not the issue in here. As I explained above, margin trading hoes against our belief.
Yes I am fully aware of that, and for that I am even willing to place a trade of $10 or more.
Thank you.
Awesome lesson, professor. Very educative, thank you. Can I participate?
Yes, you can. Thank you.
wow really helpful
Saludos profesor, en la pregunta 7 es necesario usar una cuenta de demostracion? podrian ser 2 ejemplos con cuentas reales sin usar una cuenta de demostracion?
It's not necessary. If you can afford it, you can use real trades for both positions. Thank you.
ok, muchas gracias
@fredquantum, such a great lecture. I wanted to ask something related to Question no.7, as you have asked to do the margin trading even of $1. But margin trading actually goes against my religious belief, and because of that Can I do trade on Spot? I am okay with the trading of $10 to not affect my beliefs. Thanks
Yes, you can go ahead but your mark under compliance with the topic would be slightly affected. Thank you.