Steemit Crypto Academy Season 6 Week 4 - Crypto Trading Strategy with Triangular Moving Average (TRIMA) Indicator
Introduction
It's the fourth week of Season 6 at the Steemit Crypto Academy. The season has been running smoothly so far and crypto courses have just resumed after the trading competition that just ended after two good weeks of practical trading. In today's lecture, I will be sharing another great trading strategy with you and I bet you'd have a great time attending the lecture. Stay with me on this as we roll together.

Designed with Adobe Photoshop
Background to the Study
Technical analysis stories in the crypto ecosystem can't be complete without talking about moving averages, they are predominantly trend-following indicator used in the technical analysis realm to monitor the behavior of assets' prices on the crypto chart over a certain period. They are lagging indicators and this implies that they consider the price history of an asset to present the current situation with their position on the chart and not too suitable for predicting the future price of the asset under study but can adequately give an overview of what has happened and how it tends to happen again.
There are diverse variants of moving averages that aimed to take care of the lagging effects of the earliest form of moving averages to present a cleaner and less noisy market situation. Some of the innovations are; Exponential moving average, Smoothed moving average, Triple exponential moving average, and so on. Today, we would take a look at an important variant of moving average and it is Triangular Moving Average. Let's get into the deal.
Triangular Moving Average (TRIMA) Indicator
Simple moving average (SMA) opens the basis to TRIMA, SMA presents its value as the average price of an asset over a specified period and the oscillating line moves with the price on the chart to position itself based on the average value. The triangular moving average is a smoothed version of the simple moving average that is averaged twice such that it doesn't react too quickly to the price movement of assets as the earliest moving averages does, basically, simple moving average reacts quickly to the movement of the asset's market than TRIMA.
Triangular moving average can be said to be double-smoothed from its double-average of the price of the asset and present its line in a more clear wavelike form. TRIMA is a very useful indicator that eliminates the quick reaction of indicators to high volatility crypto markets, as such it's associated with the delayed change of direction in a situation like that, in addition, it is a more suitable form of moving average that clearly shows the trend of an asset on the crypto chart enabling trend traders to easily identify the trend state of the market to plan entry/exit in the market of choice.
Key Highlights of Triangular Moving Average (TRIMA) Indicator
- The price of assets over a specified period is double-averaged to eliminate a quick reaction to the price of an asset.
- It give a clearer trend indication and this is a feature that highly suites trend traders.
- TRIMA doesn't react quickly in highly volatile crypto markets.
- TRIMA can be used to trade reversals by combining other indicators to place buy and sell entries.
How to Add TRIMA on the Crypto Chart
To add TRIMA to the crypto chart, I will be utilizing the popular charting platform https://www.tradingview.com/chart/ to conduct the adding of the indicator on the chart and analysis.
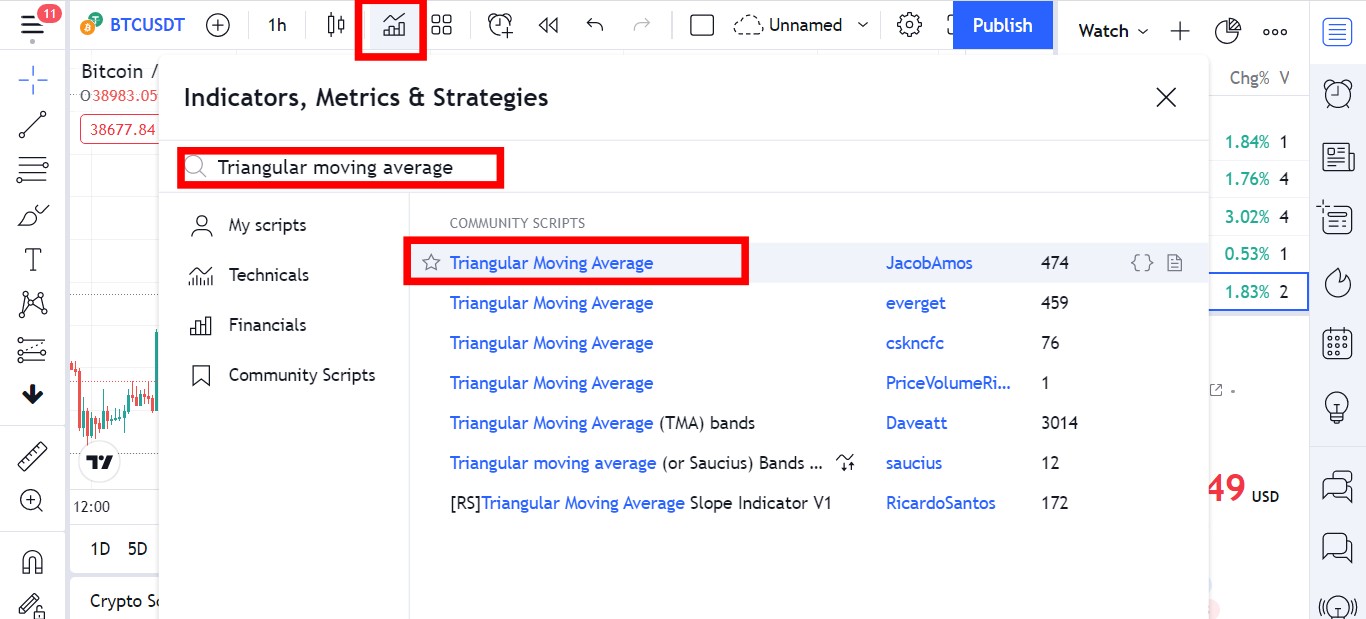
- From the landing page of the charting platform, I selected indicators at the top of the page. On the next interface, I searched for Triangular moving average and selected it to add to the chart.
- I changed the length of the indicator to 20 periods for a clearer indication. See the screenshots below.
_1.png)
The Formula for Calculating TRIMA
Remember when I was opening the basis to TRIMA, I highlighted how it was built on SMA, as such it's the double-average of the price of an asset, in other ways, SMA further averaged to produce a double-smooth. As such, SMA would be used in the formula for the calculation of TRIMA. Let's take a look at the formula below.
SMA: (P1 + P2 + P3 + P4 + P5... + Pn)/n.
Where P1-5 = The price of the asset at the 5 periods consecutively.
Pn = The price of the asset at the last period under consideration.
n = Total number of periods considered.
Now that we have gotten the formula for SMA, we can easily insert its values into the formula to get TRIMA.
TRIMA: (SMA1 + SMA2 + SMA3 + SMA4 + SMA5... + SMAn)/n.
Also expressed as; TRIMA = Sum(SMA values)/n.
Identify Uptrend and Downtrend Markets using TRIMA
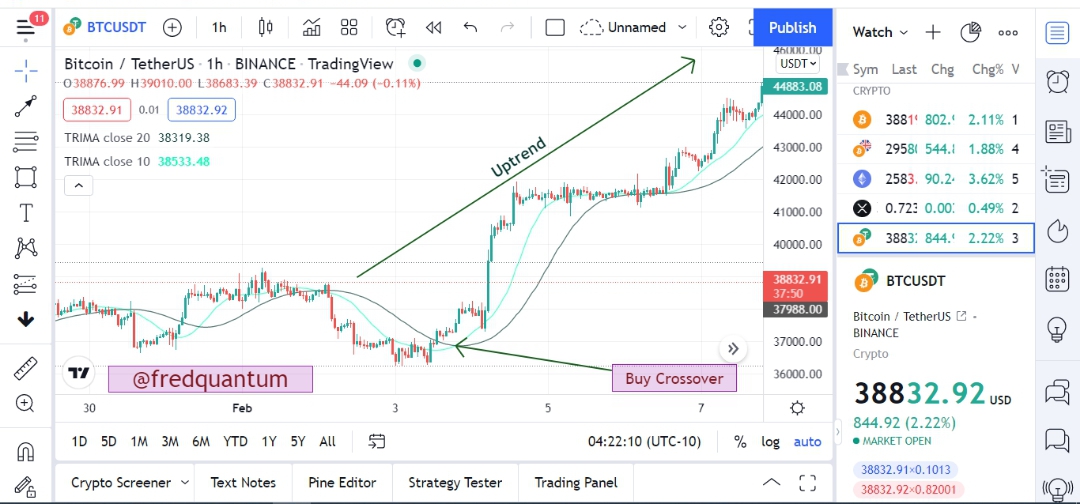
The identification of an uptrend in a market can be easily seen but traders' settings can further alter how easy/hard the visual detection of the trend is. In short, very short periods tend to stay too close to the price, and sometimes you might not see the market condition clearly enough. In an uptrend condition, the price of the asset would be clearly seen at the top of TRIMA without both entering each other.
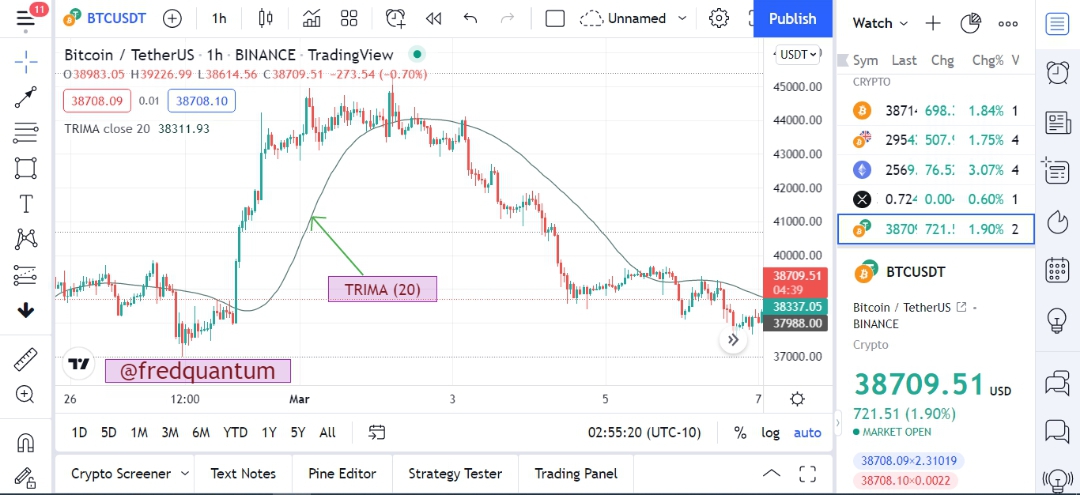
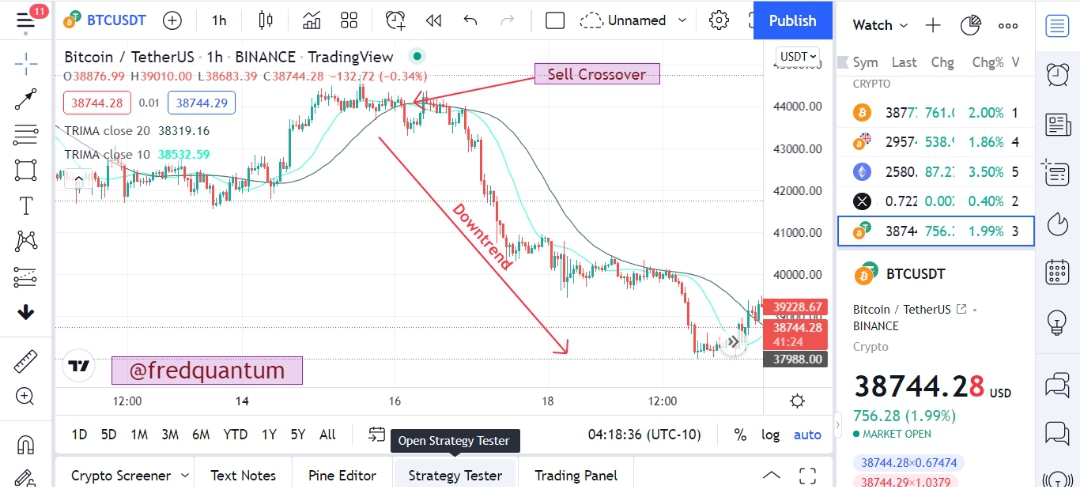
Likewise, in a downtrend market situation, the price of the asset under study would be seen clearly trading under the TRIMA line which is an indication of a downtrend, trend traders can easily position themselves for a chance to take some profits from the market. In short, in an uptrend, the TRIMA line is angled upward and is below the price of the market under study, likewise, in a downtrend, the TRIMA line is angled downward and is above the price of the asset under study. Let's take a look at the chart below.
_1.png)
Take a look at the chart of BTC/USDT at 1hr time frame above, in an uptrend, the price of the asset was clearly trading above TRIMA and in the downtrend situation as well, the price of the asset was clearly seen to be trading below TRIMA. And this satisfies the position of TRIMA in both trends as highlighted earlier.
Consolidating market's TRIMA movement
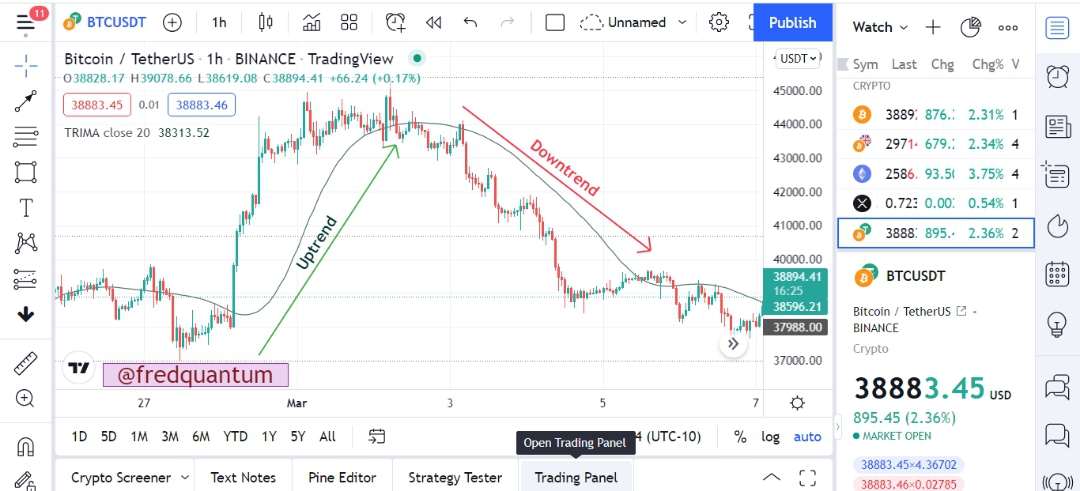
Prices of crypto assets enter a consolidating market when there is no distinguished uptrend or downtrend, in essence, no trend situation. In consolidating market, TRIMA would be seen immersed within the price of the asset, moving in and out of it. This movement takes place when the trend is not clear in an asset's market.
_1.png)
From the Bitcoin chart above, you can see a consolidating price movement and the TRIMA line was seen entering in and out of the price, that's the movement of TRIMA in such market situation. The movement persisted before a break uptrend when the TRIMA line finally appeared below the price to confirm an existence of an uptrend.
Combination of two TRIMAs to make Buy/Sell Entries
TRIMA is designed to be double-smoothened such that it does not react quickly to market situations, such as in highly volatile market. In that case, if a trader chooses to base his/her entry on the movement of TRIMA, the market might have moved before TRIMA reacts to a change in the market of the asset under study.
To take care of such occurrence, two TRIMAs would be combined on the crypto chart, one at a shorter period and the other at a longer period. As such, crossovers that exist between the two indicators would be utilized for buy/sell entry. Let's take a look at the different scenarios below.
Buy Crossovers of TRIMAs
When the shorter period TRIMA crosses over the longer period TRIMA, this is an indication of an uptrend underway, as such this crossover can be utilized to make a buy entry and this must be done with proper trade management to keep the trader in a safe zone of investment.
_1.png)
From the chart of BTC/USDT on 1 hour time frame above, I have combined two TRIMAs, one at 10 periods and the second one at 20 periods. The shorter period TRIMA crosses over the longer period TRIMA and the uptrend began which opens a buying opportunity for traders. You can see that the uptrend was a strong one.
Sell Crossovers of TRIMAs
In preparation for a sell entry of the market under study, watch out for the longer period TRIMA to crossover the TRIMA on a shorter period. An occurrence like this signifies a downtrend underway and opens a sell opportunity to take some profit in the downtrend movement of the asset.
_1.png)
Also, on BTC/USDT chart in 1 hour time frame, two TRIMAs have been combined. The longer period crossed over the shorter period and this is an indication of a downtrend that opened a selling opportunity. If you take a look at the chart, the downtrend moved extremely from that point.
Note: In a consolidating market, TRIMAs can be seen crossing over and below each other at regular intervals, do not utilize such crossovers for buy/sell entry rather verify every crossovers using suitable indicators. We would discuss one in the next section.
Trading Reversal using TRIMA combined with Relative Strength Index (RSI)
A lone TRIMA indicator might not enough to trade reversals for the fact that it might take some time before it reacts to the price behavior, as such, it is required that it is combined with other indicators to trade reversals. The indicators to be used is one of its kind, that is another TRIMA indicator to make it two TRIMAs (one at shorter period which monitors price closely and the other at a longer period), and RSI indicator would be combined as well.
Criteria for Trading Bullish Reversal using TRIMA
- Add two TRIMAs on the chart at different periods. Also, add an RSI indicator.
- In a downtrend or consolidating market, the RSI must hit the oversold level which is associated with reversal.
- Wait for the shorter period TRIMA to cross over the longer period TRIMA. When these conditions are met, after at least two candlesticks confirmation, place a buy entry.
- Equip the setup with proper stop loss and take profit levels. The stop loss should be placed below the support at the bottom of the crossover. I recommend 1:1 risk to reward ratio if you are using this indicator for the first time for effective risk management.
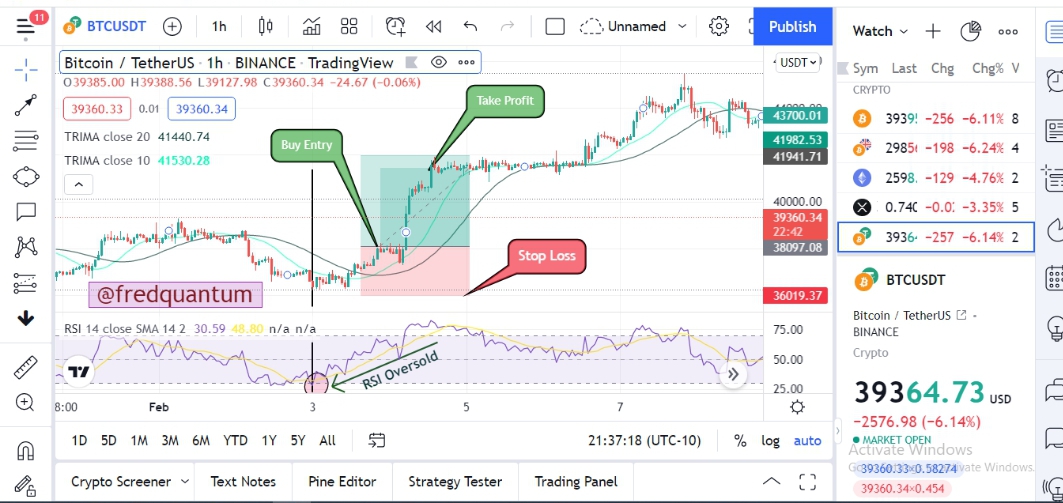_1.png)
From that chart above, after a downtrend market movement, the price of the asset has a consolidating movement, RSI has hit the oversold level and its oscillating line is changing direction. Around the consolidating region, the shorter period TRIMA crosses over the longer period TRIMA and I made a buy entry after the crossover.
Criteria for Trading Bearish Reversal using TRIMA
- Add two TRIMAs on the chart at different periods. Also, add an RSI indicator.
- In an uptrend or consolidating market, the RSI must hit the overbought level which is associated with reversal.
- Wait for the longer period TRIMA to cross over the shorter period TRIMA. When these conditions are met, after at least two candlesticks confirmation, place a sell entry.
- Equip the setup with proper stop loss and take profit levels. The stop loss should be placed above the resistance at the top of the crossover. I recommend 1:1 risk to reward ratio if you are using this indicator for the first time for effective risk management.
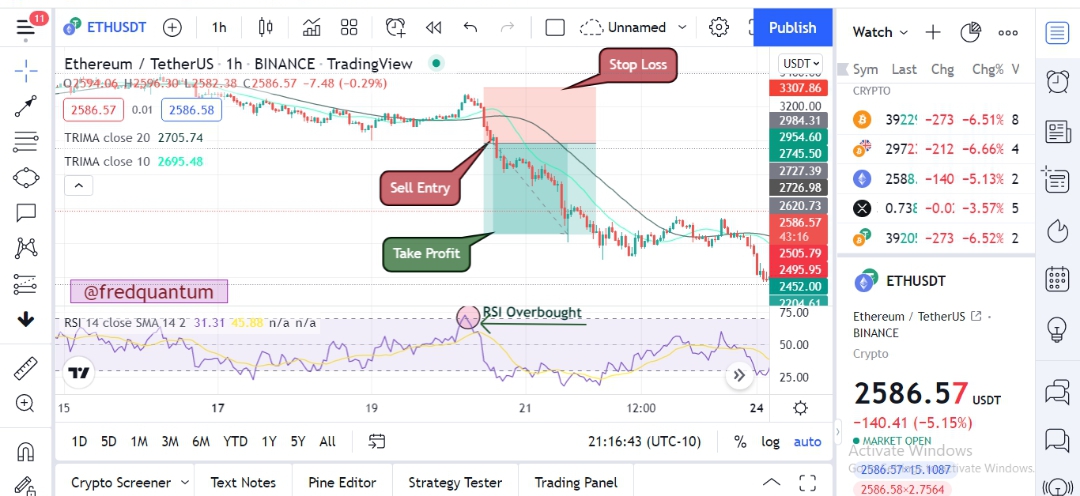_1.png)
Likewise, in the chart above, the price of the asset was consolidating when the RSI has hit the oversold level which is associated with a trend reversal, the longer period crosses over the shorter period and this is an indication of a bearish reversal. I made a sell entry after the crossover as the price continued in the downtrend direction.
Conclusion
In conclusion, the Triangular moving average (TRIMA) indicator is an innovative development of the regular simple moving average (SMA) which operates by double averaging the price of an asset over a specified period to produce a double-smooth of the representation of its line on the chart of the asset under study. It's not too effective to use TRIMA alone to make buy and sell reversal trade decisions because the market might have moved for some time before the indicator give a clear indication, nevertheless, it's a strong indicator for trend traders.
In this piece today, I have discussed a few ways to filter crossovers of TRIMA to make buy/sell entry, and one which was discussed is how to utilize RSI indicator's oversold/overbought to make bullish/bearish reversal entries in a market, nevertheless, this is not the only indicator that can be utilized for the purpose, traders should consider laying their hands on other momentum indicators as well. Thanks for reading through the lecture today.
Homework Task
- What is your understanding of the TRIMA indicator?
- Setup a crypto chart with TRIMA. How is the calculation of TRIMA done? Give an illustration. (Screenshots required).
- Identify uptrend and downtrend market conditions using TRIMA on separate charts.
- With your knowledge of dynamic support and resistance, show TRIMA acting like one. And show TRIMA movement in a consolidating market. (Screenshots required).
- Combine two TRIMAs and indicate how to identify buy/sell positions through crossovers. Note: Use another period combination other than the one used in the lecture, explain your choice of the period. (Screenshots required).
- What are the conditions that must be satisfied to trade reversals using TRIMA combining RSI? Show the chart analysis. What other momentum indicators can be used to confirm TRIMA crossovers? Show examples on the chart. (Screenshots required).
- Place a Demo and Real trade using the TRIMA reversal trading strategy (combine RSI). Ideally, bullish and bearish reversals. Utilize lower time frames with proper risk management. (Screenshots required).
- What are the advantages and disadvantages of TRIMA Indicator?
Rules and Guidelines
- The title of the homework task should be Crypto Trading Strategy with Triangular Moving Average (TRIMA) Indicator - Crypto Academy / S6W4 - Homework Post for @fredquantum.
- You must be participating in at least #club5050 to benefit from the mark reserved for the initiative's participants. There shouldn't be any power down history within the club status's calculation period. Take note.
- Post your article to the Steemit Crypto Academy.
- The purpose of the homework task is to widen your knowledge about the topic, so ensure you don't limit yourself to the few things taught in this lecture. Do more Research and be Creative.
- Your article must be at least 600 words and make sure your language is clear and straightforward.
- Users that are Powering down are not eligible for participation.
- Be sure that your article is free of Plagiarism, if you have directly copied words from any source, fully reference it.
- Avoid spinning of other users' content, it can disqualify you so make sure you are a unique producer of your homework task. You don't want to risk being sent to the grey list or blacklist, so Beware!
- Add the tag #fredquantum-s6week4 among the first five tags and find a place to tag me @fredquantum so that I can easily find your content. Also, add relative tags like #cryptoacademy, #trima-indicator, #steemexclusive, #crypto, your club status tag, and others.
- Only use copyright-free images and they must be well referenced.
- You must have a reputation of 60 and above to be eligible for participation. Also, you must have at least 400 SP excluding delegated-in SP.
- This task runs till the 19th of March 2022. Time: 11:59 PM UTC. Any homework task submitted later than that would be considered invalid. Thank you.
@tipu curate 2
--
This is a manual curation from the @tipU Curation Project.
Upvoted 👌 (Mana: 4/6) Get profit votes with @tipU :)
Hy
Professor @fredquantum if i uses 80 and 50 periods can it will provide ne longterm trade? Can these periods effect the long-term and short-term trades?
Please you are no longer doing advanced nah
We want to learn take the question easy we still have other professor work to do
Some of us are students
Are the questions beyond what was taught in the lecture? I guess if I had repeated a topic or have presented a lecture with a few paragraphs, you'd be happy but you fumes as I haven't done either. As far as I am concerned, this comment lacks basis and no further attention would be given to it. Thank you.
I said the number of questions for Christ sake no one is asking for repetition tho
Repeated topics are not good at all
Just that the number of questions is much
A great lesson Sir, so sad I am missing out because I have a low rep😢
Keep blogging in other communities. I hope you can attain the reputation sooner.
Congratulations, your post has been upvoted by @scilwa, which is a curating account for @R2cornell's Discord Community. We can also be found on our hive community & peakd as well as on my Discord Server
Felicitaciones, su publication ha sido votado por @scilwa. También puedo ser encontrado en nuestra comunidad de colmena y Peakd así como en mi servidor de discordia
Hello there. As I'm working with a cellphone, I think it's impossible to use a demo account in Trading View. Can I just perform real trades with Binance? I'm gonna leave my homework post from two weeks ago 😅 I didn't get an upvote from curator02 yet, so here you are. Thanks and regards in advance:
https://steemit.com/hive-108451/@alegnita/recontra-repost-or-crypto-trading-strategy-with-triple-exponential-moving-average-tema-indicator-crypto-academy-s6w2-homework
Yes, you can use your mobile. Attach the screenshot of my review as the cover picture of your repost.
All right, thank you. I also already have attached it on the post. Regards.
Greetings Professor.
I would like to know whether we have to execute 2 trades (a demo and a real) in question 7? OR do we have to only execute either demo or real?
The question was separated with and not or. And this implies you are placing one demo and one real trade. Thank you.
Respected sir, Sir I successfully power up the steem now. I forgot to check my monthly earnings and I’ll try my best to do better homework from next post onwards. Please add the marks of club5050 so that i’ll be able to get vote. I did efforts to make this post. @fredquantum
Here is the link of my post
https://steemit.com/hive-108451/@samizuberi/crypto-trading-strategy-with-triangular-moving-average-trima-indicator-crypto-academy-s6w4-homework-post-for-fredquantum#@fredquantum/r90ad9