"REPOST"...... ¦ Steemit Crypto Academy Season 4 Week 2 - Beginner's Course | Technical Indicators by @g0h4mroot for the cryptoprofesor @reminiscence01.


They are tools that are used to carry out a technical analysis, worth the redundancy, these indicators keep all the information generated by the price action of an asset in real time and show it graphically.
In short, the technical indicators collect the information of all the orders that have been made on a certain asset and group them into statistics that in turn are transformed into visual records so that the trader has a better understanding of what has happened in the market, market and what is happening at the moment.
Indicators are to a trader what a tool to a mechanic ...
INDISPENSABLE
Technical indicators are very important when trading as they offer us a lot of important information about the status of an asset, that is, they give us a lot of information and everything we need to know during a certain period of time, thanks to the Podemos indicators. know what happened to the value of the asset 4 hours ago, 6 days ago or we can even know what happened the day the asset went on the market and how it behaved.
There are many technical indicators, each one has a different use, but knowing how to combine several indicators our way of operating will be better every day. Doing a market analysis without using technical indicators is the worst madness we can do, it is said that in the 70s technical analysis was frowned upon, until young people began to use it, and from then on technical analysis was stipulated as a tool main for the merchant.
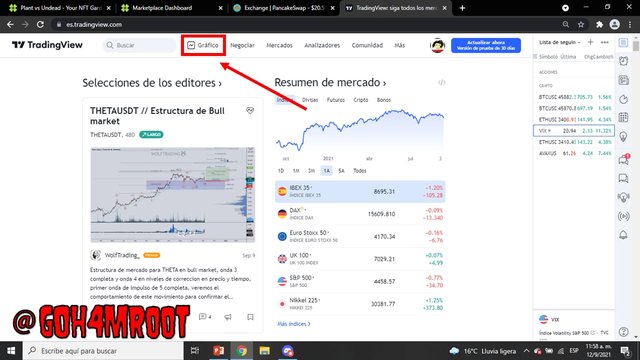
- To add technical indicators to a chart we will use tradingview.com
Well, first of all, log in.
1- let's go to graphics
2- click indicators
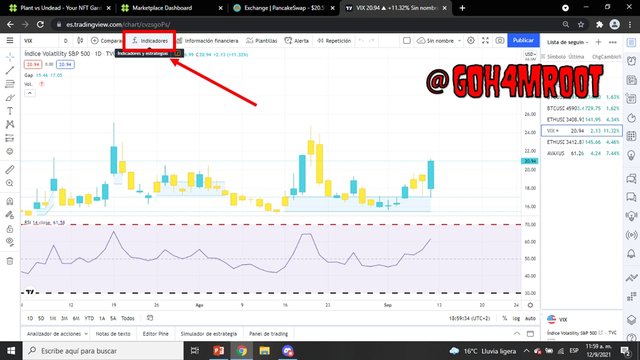
3- we click on defaults
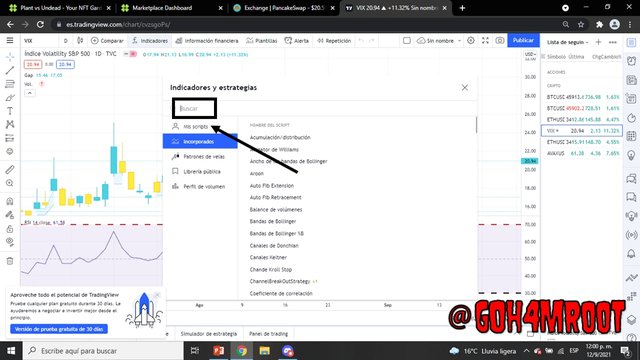
4- in the text box of the search engine we write the indicator that we want to add
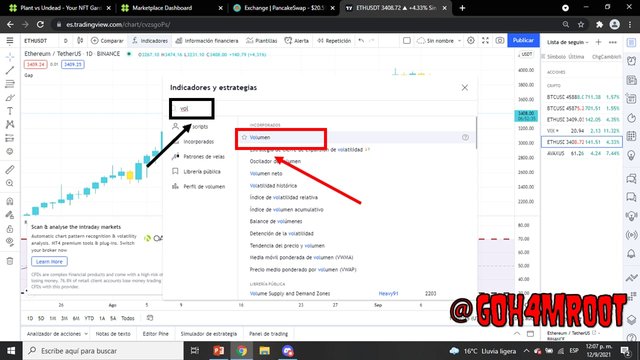
5- we choose the desired indicator, in my case I chose the indicator VOLUME, and ready we have already added the indicator to our chart...
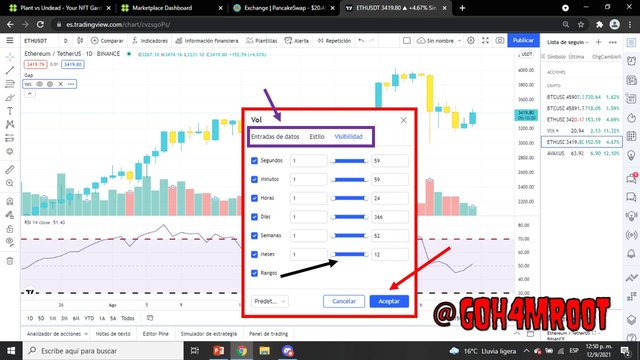
- How to configure our indicator
1- We enter the small gear next to the name of our indicator and press.
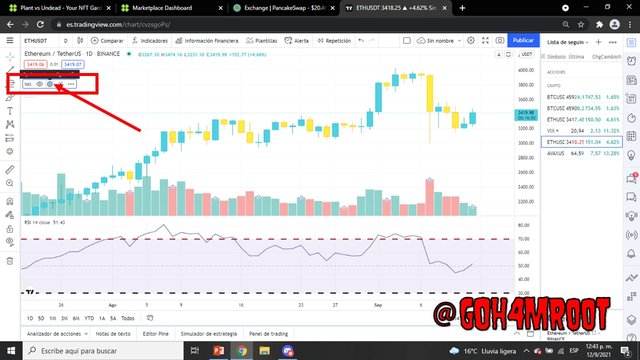
2- A box will be displayed.
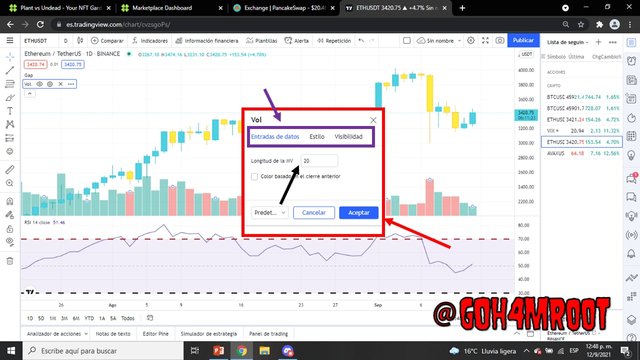

3- Here we can choose how we can modify our indicator.
4- In this case I am going to change the color of the volume blocks
5- Ready, we have configured our indicator.
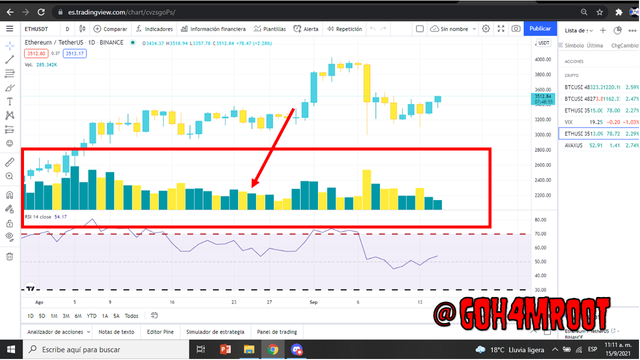
Also, show the indicators used as an example on your chart. (Screenshot required).
Among the technical indicators we have several types, these are:
- Trend Followers
Trend following indicators, as their name indicates, are used to know the movement of a price towards a specific side, that is, upwards if it is an uptrend, downwards if it is a downtrend or if it is lateralizing.
Among the trend following indicators we have the Mobile Average.
MOVING AVERAGE
The MA is an oscillator-type indicator that collects all the information for a certain time dividing it by the data collected, resulting in a direction in the market, that is, indicating a possible trend.
- Volatility indicators
Volatility indicators measure the speed with which the price can change, this is what the best trader look for, the volatility in an asset, this is summarized in profits. Among the technical volatility indicators we find the ATR.
ATR.
The ATR is an oscillator type indicator that tells us how fast the price of an asset changes and the faster it changes, the more volatile it is.
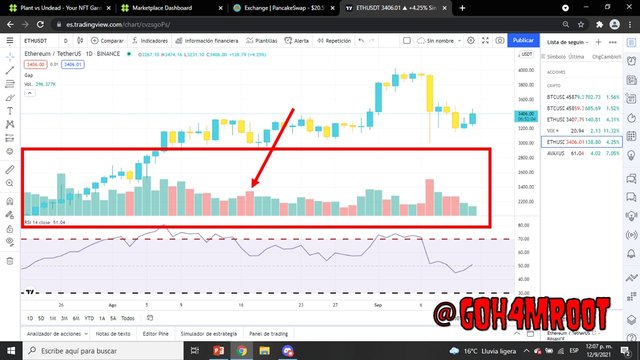
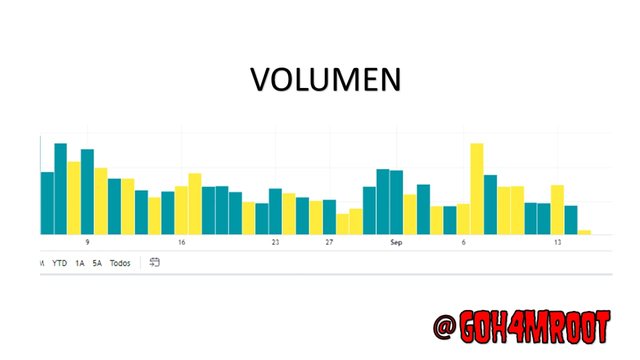
- Volume Indicators
The volume indicators measure the amount of incoming and outgoing orders in a market, these orders are shown in the form of bars, the higher the bar, the more orders there are, this also indicates that there is a lot of capital entering the market that we are analyzing.
- Of moment Indicators
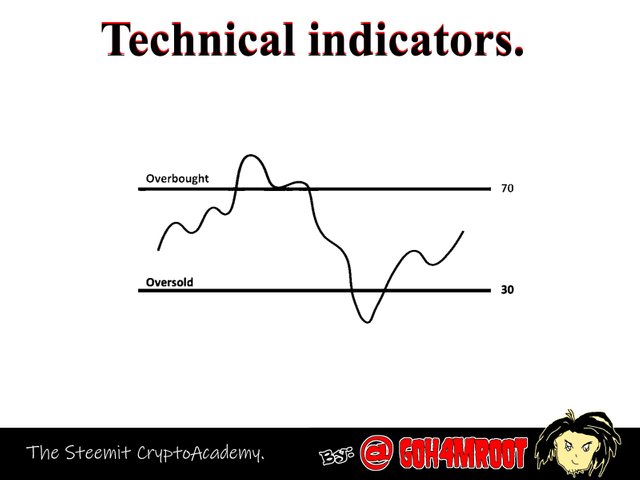
These indicators measure how strongly the price moves in a given period of time, they are used to measure the recent strength in previous periods indicating whether there are oversold or overbought.
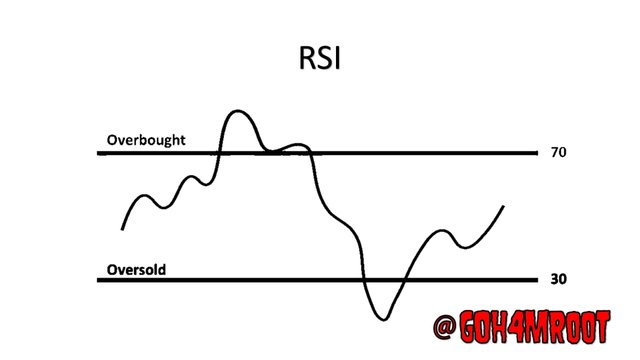
Among the most popular indicators at the moment is the RSI.
RSI
The rsi is an oscillator type indicator that tells us if an asset is oversold or overbought by means of lines, the upper line indicates OVERBURCH and is stable with a margin of 70% and the lower line INDICATES OVERSELL and is established with a margin of 30 % can be set to 80/20 but the standard is 70/30.
b) Briefly explain why the indicators are not advisable to be used as an independent tool for technical analysis.
It is said that the indicators should not be used individually as they are not 100% accurate and always throw errors and more when used for free.
Most of the indicators shown show the statistics with lag times and that causes failures when analyzing the market with a single indicator, so it is advisable to combine several indicators so that the analysis is better and better and we fail less.
If the correct indicators are put together, the entry and exit signals will be more and more accurate and this will make the trade more successful, as the indicators used individually give false signals when used.
Technical indicators are a fundamental tool for the trader and for a correct performance when operating, that is why we have explained what technical indicators are and we have classified the types of indicators for technical analysis, in this magnificent class we learned about indicators, we talk about the rsi and volume which are important technical indicators ...
Compliance with the elements imposed by the crypto teacher is expected to be to your liking.
Please include "Repost" in the title.
ready I did it teacher! Thank you....