Fibinacci Tools - Crypto Academy / S6W4 - Homework post for pelon53.

created with logomaker

1.- Explain in your own words what you mean by Fibonacci retracement. Show an example with screenshot.
Evolution of Fibonacci Retracement
A series of numbers that has all its succeeding numbers to be equal to the sum of two numbers before it is known as the Fibonacci sequence. A vivid example is 0, 1, 1, 2, 3, 5, 8, 13, 21, 34, 55, 89, 144 etc. Here, to obtain the last number which 144, then we get the sum of 55 and 89.
55 + 89 = 144
This sequence was discovered by Leonard Fibonacci, an Italian mathematician who was born in 1170 AD. His sequence is based on the reproduction rate of two rabbits in theory. It was a tool for calculating and hence estimating the subsequent population growth of the two rabbits. Although it may seem to be a ridicule how a tool used for estimating animal reproduction rate could be used for trading analysis and hence, the golden ratio comes to lime light.
Golden Ratio
Traders tend to be more interested in the golden ratio which is deduced from Fibonacci sequence. If we divide a number picked randomly in a Fibonacci sequence by its previous number, we get a value which is called the Golden Ratio. Let us use this following Fibonacci sequence, 2, 3, 5, 8, 13, 21, 34, 55..... If we divide the last number (55) by its previous number, then we are going to get a golden ratio.
55 ÷ 34 = 1.61764705....
34 ÷ 21 = 1.61764705....
21 ÷ 13 = 1.61764705....
This number is widely approximated to 1.618.
It is also believed that the golden ratio is a constant in nature. Example of things in nature that result to a golden ratio include;
• Dividing the number of female bees to make bees in a hive.
• • Each new seed of a sin flower is 0.618 of a turn frlm the last one.
• The ratio of the human forearm to the hand is 1.618.
In trading, when using Fibonacci rule, the golden ratio is translated into three percentages namely;
38.2% (approximated to 38%), 50%and 61.8% (approximated to 62%).
When needed, traders could use more multiples like 23.6%, 161.8%, 423%, 684.4%......
From the Fibonacci sequence, when a number is divided by the second number that succeeds it, it will give rise to the 38.2% ratio. Dividing a number from the sequence by the third number that succeeds it will give rise to the 23.6 ratio. By this means, all other ratios can be deduced. For example;
21 ÷ 55 = 0.382 = 38.2%
21 ÷ 89 = 0.235 = 23.6%
What is Fibonacci Retracement
Fibonacci Retracement refers to horizontal lines that tries to expose places where there is a possibility of the price to reverse direction. It Shows this points in the market using support and resistance lines. Traders tend to buy at a Fibonacci support level at the Retracement when the the market is in an uptrend.
How to Find/ Add the Fibonacci Retracement on a Chart
Firstly, open tradingview. Next open the chart.
.png)
Next, click on the icon as indicated and click on the first option on the dropdown menu.
.png)
.png)
2.- Explain in your own words what you mean by Fibonacci extension. Show an example with screenshot.
Fibonacci Extension
Fibonacci Extension is used by traders to establish profit target or speculate how far a price might move after the prevailing trend has resumed. There is no formula for Fibonacci Extension but they are drawn to mark price levels of utmost importance using three points on a chart. These points are selected by the trader according to the start of a price move, the end of a price move, and the end of the retracement against the move. Most Fibonacci Extension levels are include 61.8%, 100%, 161.8%, 200%....
How to Add Fibonacci Extension to a Chart
Open tradingview chart and click on the icon as indicated on the image below. Next you select the second option which is Fibonacci Extension.
.png)
3.- Perform the calculation of the Fibonacci retracement, for the levels of: 0.618 and 0.236. Pick a crypto pair of your choice. Show a screenshot and explain the calculation you made.
Calculation of Fibonacci Retracement
Formula to calculate Fibonacci levels of retracement are;
R1 = X + [( 1- %Retrace1/100) × (Y - X)]
Where
X is the price at which the retracement began
Y is the maximum value that marks the end of the Fibonacci.
%Retrace1 is the 0.236 ratio
%Retrace2 is the 0.382 ratio
%Retarce3 is the 0.50 ratio
%Retrace4 is the 0.618 ratio
For this task, I will use LTC/USDT pair for the calculation of the various levels.
.png)
The beginning price of the retracement (X) is $99.57 and the final price of the retracement (Y) is $109.34.
To get calculate the Fibonacci Retracement at 0.618 level, we have
R4 = X + [( 1- %Retrace4/ 100) × (Y -X)]
R4 = $99.57 + [( 1- 0.618) × ( $109.34 - $99.57)]
R4 = $99.57 + [(0.382) × (9.77)]
R4 = $99.57 + [ 3.732]
R4 = $103.30
To calculate the Fibonacci Retracement at 0.236 level, we have
R1 = X + [( 1-%retrace1) × (Y - X)]
R1 = $99.57 + [( 1- 0.236) × (Y - X)]
R1 = $99.57 + [(0.764) × (9.77)]
R1 = $99.57 + [ 7.464]
R1 = $107.03
4.- On a Live account, trade using the Fibonacci retracement, screenshots are required.
For this trading excercise, I will use KUCOIN exchange and I will trade LTC/USDT pair. The market is in an downtrend at the moment since it has continued to make lower highs and lower lows.
.png)
tradingview
Fibonacci trading also applies to falling market since the retracement can be applied to bounce back up. Here, the 0.236 levels is forming the resistance. Few minutes later, price breaks the 0.236 level and leaves the 0.382 level as possible new resistance. Here I seek to buy/long at the 0.236 level to take profit at the 0.382 level.
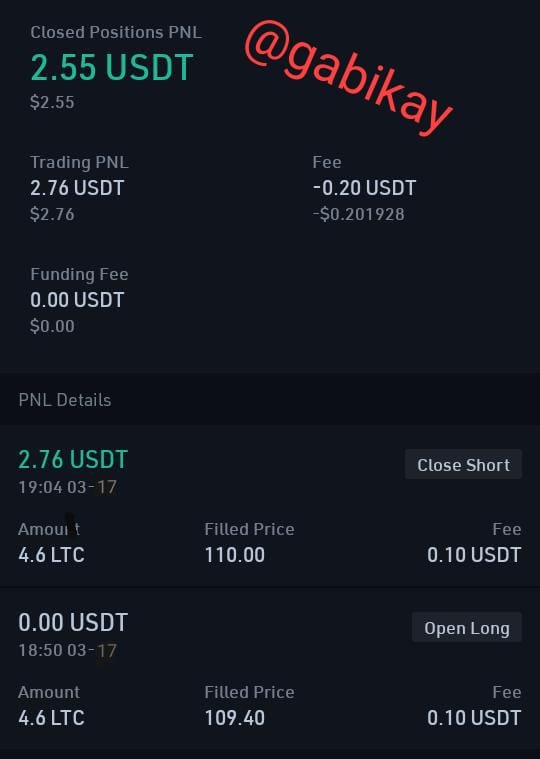
screenshot taken from kucoin mobile app
5.- On a Demo account, make a trade operation using the Fibonacci extension. Screenshots are required.
For this real trade, I will use Meta4 Roboforex demo trading account and trade on ETH/USDT pair using Fibonacci Extension.
Firstly I find a dominant trend and then I had to wait for the market to go against the trend. Also I had to wait for the market to continue moving in the dominant trend which it was previously moving along. At this point, I then apply the Fibonacci Extension making it to touch the three points (a, b & c).
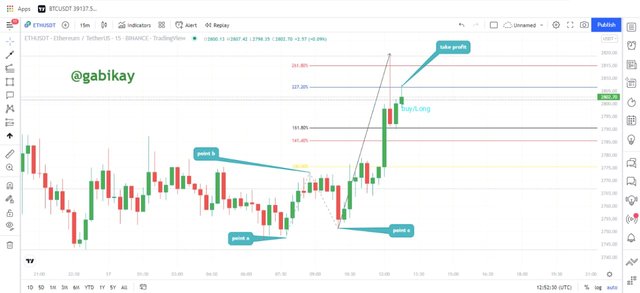
Because my dominant trend is in an uptrend, I then drew a horizontal line at the minimum, maximum and retrace of Fibonacci Extension. At first, the 100 % level created a resistance but later the price broke the level and now 141.8% level is the potential strong support zone.
Hence, I place a buy/long order and set to take profit at 227.20%
.png)
.png)
.png)
Summary
Some traders donnot fancy to trade with the Fibonacci Retracement or extension as some just see it as self fulfilling prophecy levels without being able to pull out any magical feature from the strategy. Not withstanding, Fibonacci Retracement can give an additional level of insight to points where the market could possibly turn which may not be visible at first glance. However, it is wise to put risk management into consideration when applying technical indicators.
Regards to professor @pelon53